| Param | Original file | Final file |
|---|---|---|
| Filename | modeM0/AS1G06_154T01_9000001100_08016cztM0_level2.evt | modeM0/AS1G06_154T01_9000001100_08016cztM0_level2_quad_clean.evt |
| Size (bytes) | 1,654,686,720 | 314,550,720 |
| Size | 1.5 GB | 300.0 MB |
| Events in quadrant A | 11,880,104 | 1,924,492 |
| Events in quadrant B | 11,988,265 | 1,966,849 |
| Events in quadrant C | 11,745,402 | 1,949,506 |
| Events in quadrant D | 12,733,415 | 1,891,393 |
| Mode M9 | |||
|---|---|---|---|
| Quadrant | BADHDUFLAG | Total packets | Discarded packets |
| A | 0 | 25 | 0 |
| B | 0 | 25 | 0 |
| C | 0 | 25 | 0 |
| D | 0 | 25 | 0 |
| Mode SS | |||
|---|---|---|---|
| Quadrant | BADHDUFLAG | Total packets | Discarded packets |
| A | 0 | 530 | 0 |
| B | 0 | 530 | 0 |
| C | 0 | 530 | 0 |
| D | 0 | 530 | 0 |
| Mode M0 | |||
|---|---|---|---|
| Quadrant | BADHDUFLAG | Total packets | Discarded packets |
| A | 0 | 53560 | 4 |
| B | 0 | 53209 | 4 |
| C | 0 | 53101 | 4 |
| D | 0 | 56477 | 4 |
| Quadrant | Total seconds | Saturated seconds | Saturation percentage |
|---|---|---|---|
| A | 26093 | 373 | 1.429502% |
| B | 26093 | 330 | 1.264707% |
| C | 26093 | 266 | 1.019430% |
| D | 26093 | 416 | 1.594297% |
Noise dominated data is calculated using 1-second bins in cleaned event files. If a bin has >2000 counts, and if more than 50% of those come from <1% of pixels, then it is considered to be noise-dominated and hence unusable.
| Quadrant | # 1 sec bins | Bins with >0 counts | Bins with >2000 counts | High rate bins dominated by noise | Noise dominated (total time) | Noise dominated (detector-on time) | Marked lightcurve |
|---|---|---|---|---|---|---|---|
| A | 28593 | 26096 | 9 | 9 | 0.03% | 0.03% | 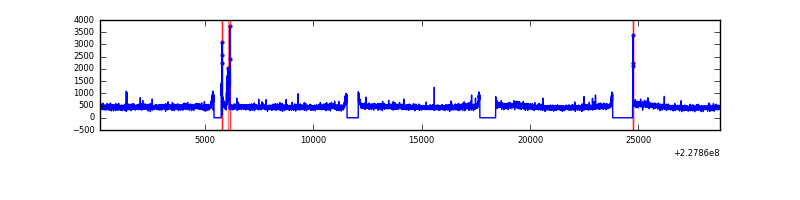 |
| B | 28593 | 26096 | 2 | 2 | 0.01% | 0.01% | 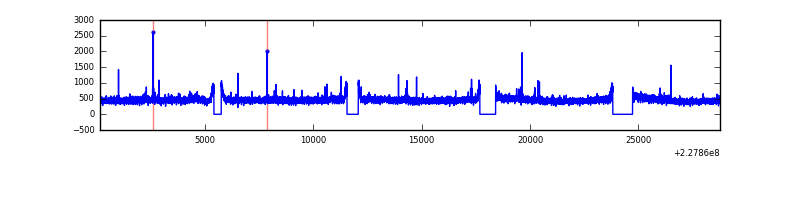 |
| C | 28593 | 26096 | 0 | 0 | 0.00% | 0.00% | 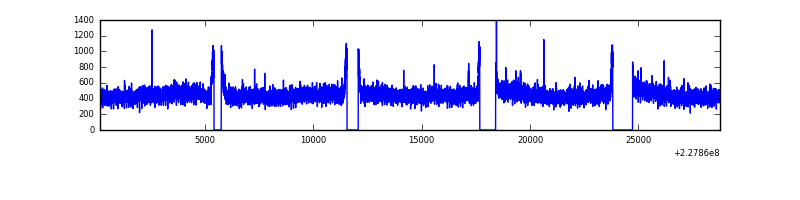 |
| D | 28593 | 26097 | 109 | 109 | 0.38% | 0.42% | 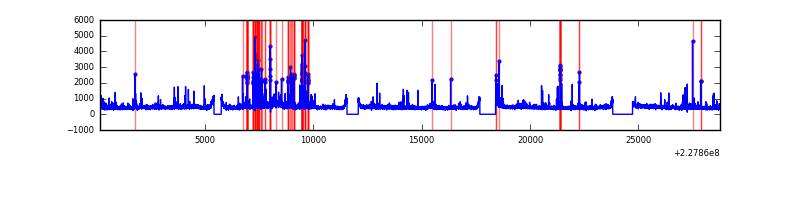 |
Top three noisy pixels from each quadrant. If the there are fewer than three noisy pixels in the level2.evt file, extra rows are filled as -1
| Pixel properties | Quadrant properties | ||||||
|---|---|---|---|---|---|---|---|
| Quadrant | DetID | PixID | Counts | Sigma | Mean | Median | Sigma |
| A | 15 | 234 | 180525 | 287.51 | 3037 | 2960 | 617.6 |
| A | 0 | 226 | 28323 | 41.07 | 3037 | 2960 | 617.6 |
| A | 12 | 194 | 25795 | 36.97 | 3037 | 2960 | 617.6 |
| B | 12 | 111 | 68475 | 110.97 | 3057 | 2977 | 590.2 |
| B | 11 | 111 | 55190 | 88.46 | 3057 | 2977 | 590.2 |
| B | 11 | 51 | 43163 | 68.09 | 3057 | 2977 | 590.2 |
| C | 1 | 16 | 45750 | 61.48 | 2983 | 2992 | 695.4 |
| C | 8 | 128 | 34566 | 45.4 | 2983 | 2992 | 695.4 |
| C | 13 | 61 | 22293 | 27.75 | 2983 | 2992 | 695.4 |
| D | 11 | 144 | 673546 | 941.99 | 2964 | 2885 | 712.0 |
| D | 1 | 52 | 429679 | 599.46 | 2964 | 2885 | 712.0 |
| D | 2 | 14 | 259327 | 360.19 | 2964 | 2885 | 712.0 |
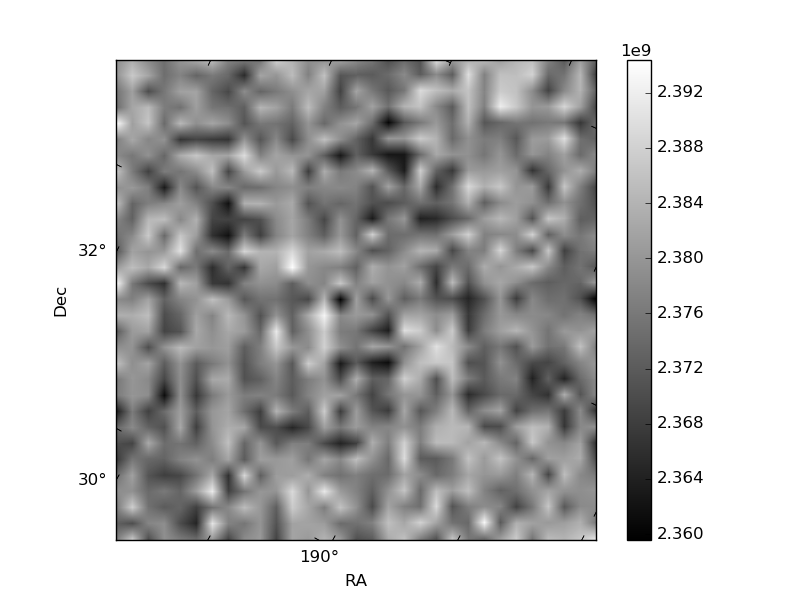
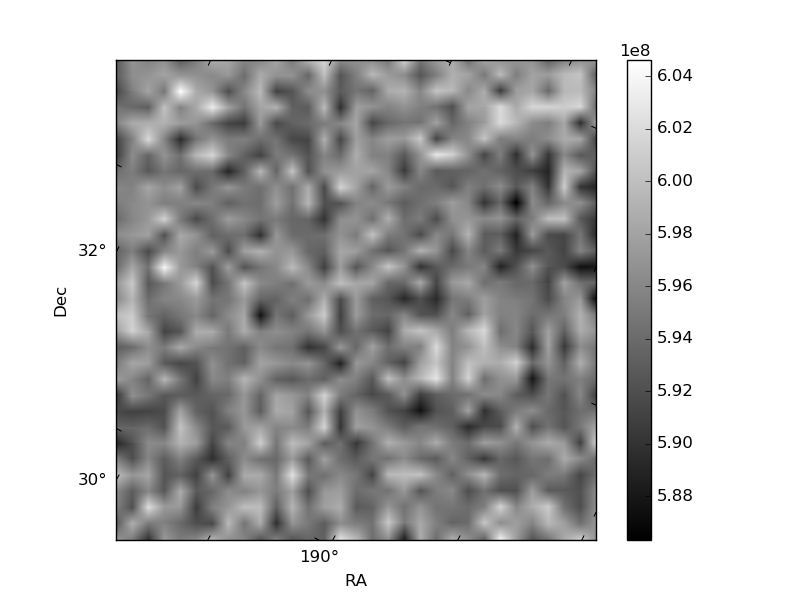
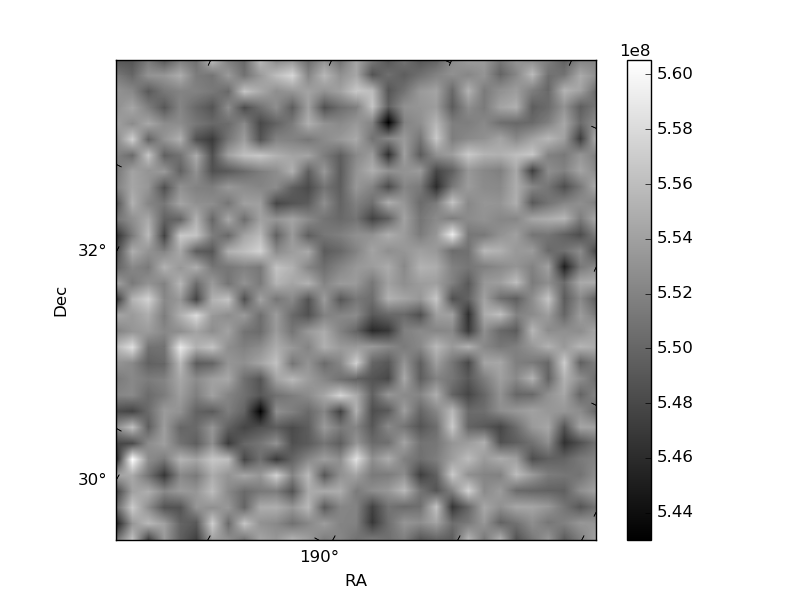
Histogram calculated using DETX and DETY for each event in the final _common_clean file
| Quadrant A | 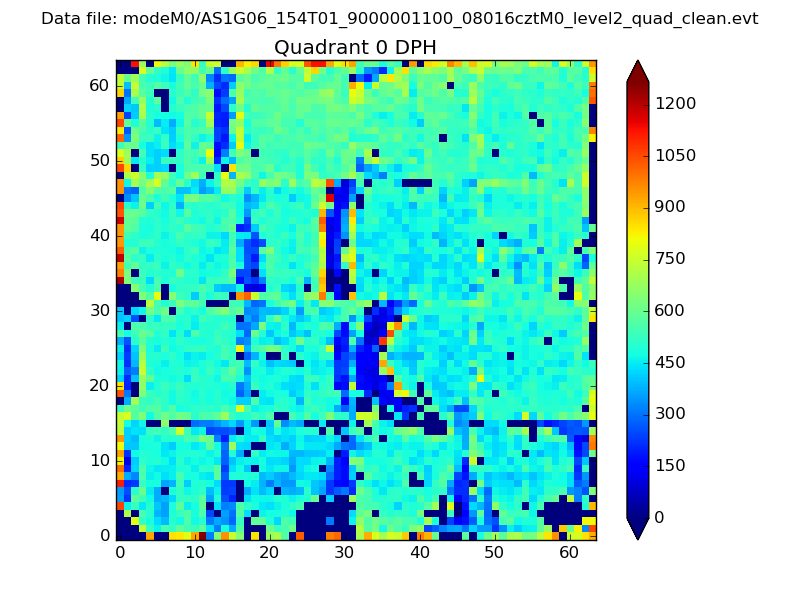 |
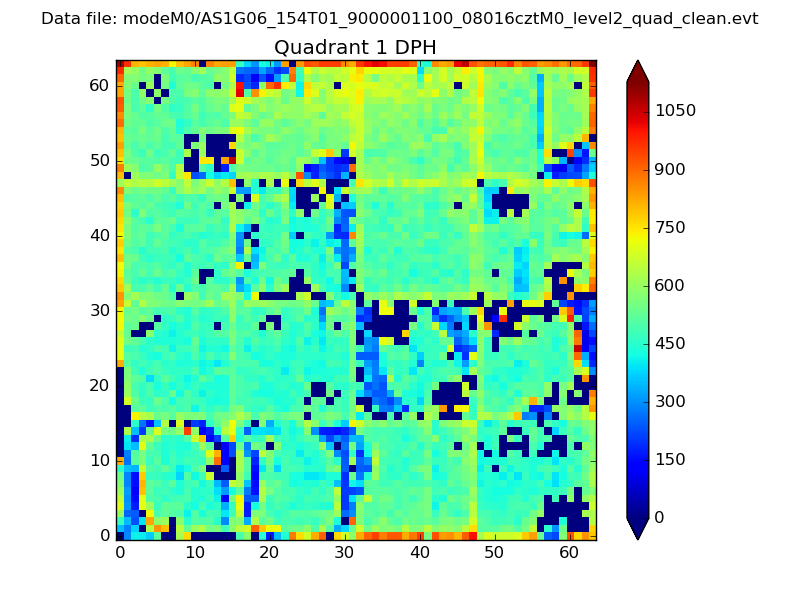 |
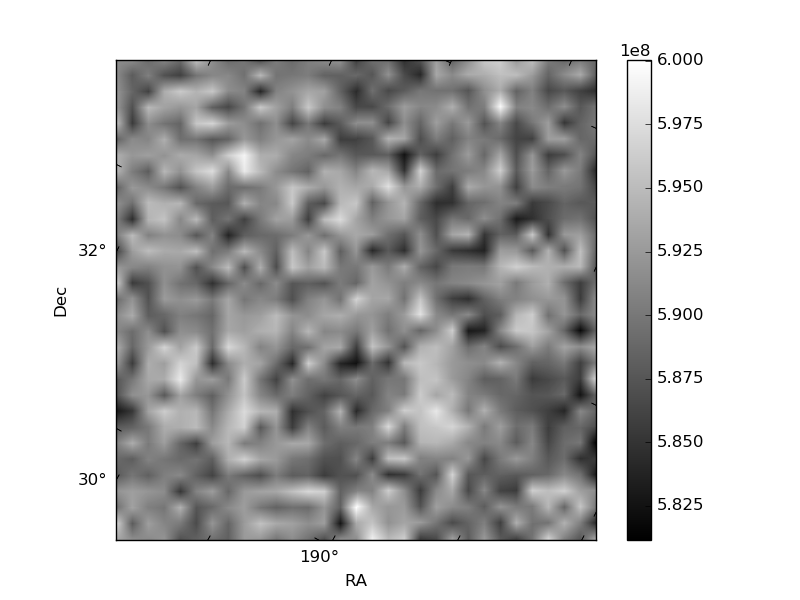
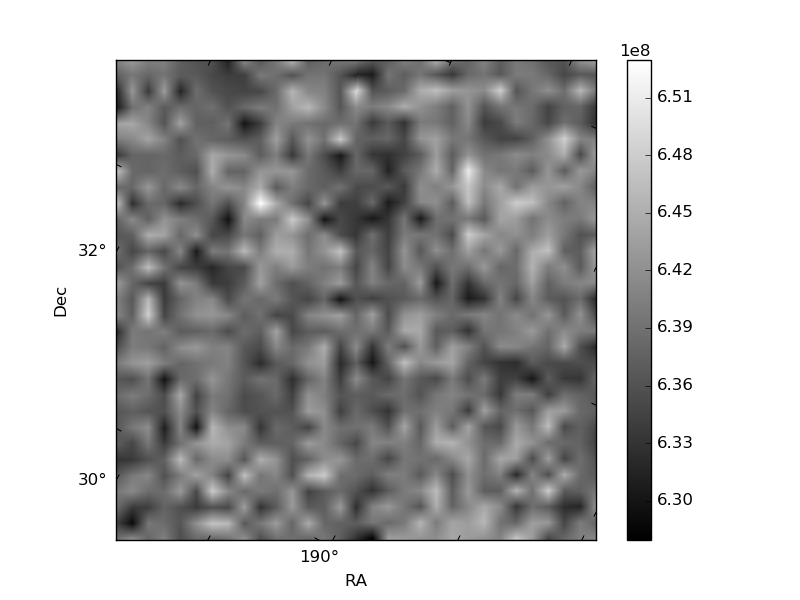
Quadrant B |
|---|---|---|---|
| Quadrant D | 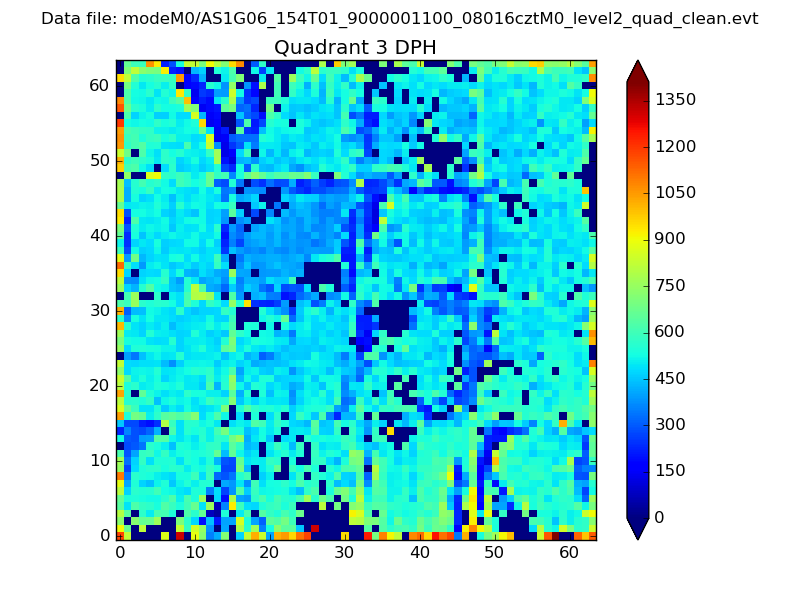 |
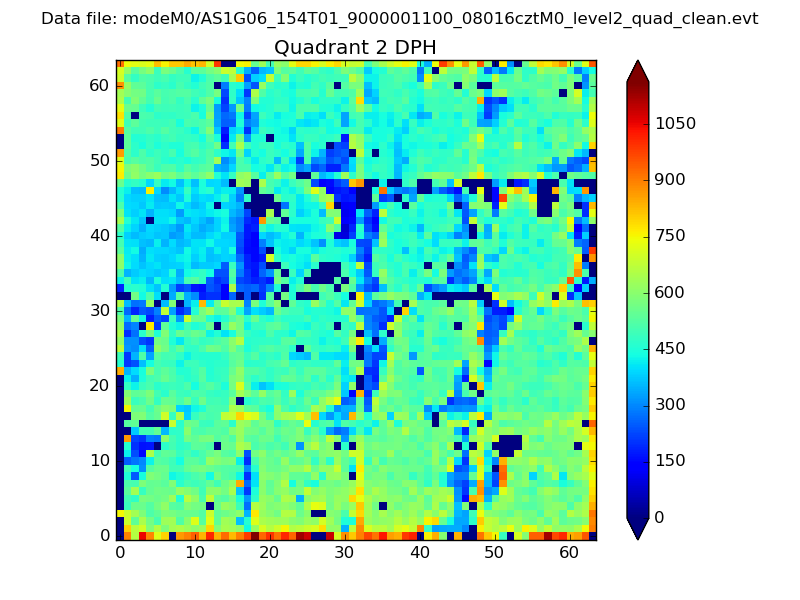 |
Quadrant C |
| Plot type | Count rate plots | Images |
|---|---|---|
| Comparison with Poisson distribution Blue bars denote a histogram of data divided into 1 sec bins. Red curve is a Poisson curve with rate = median count rate of data. |
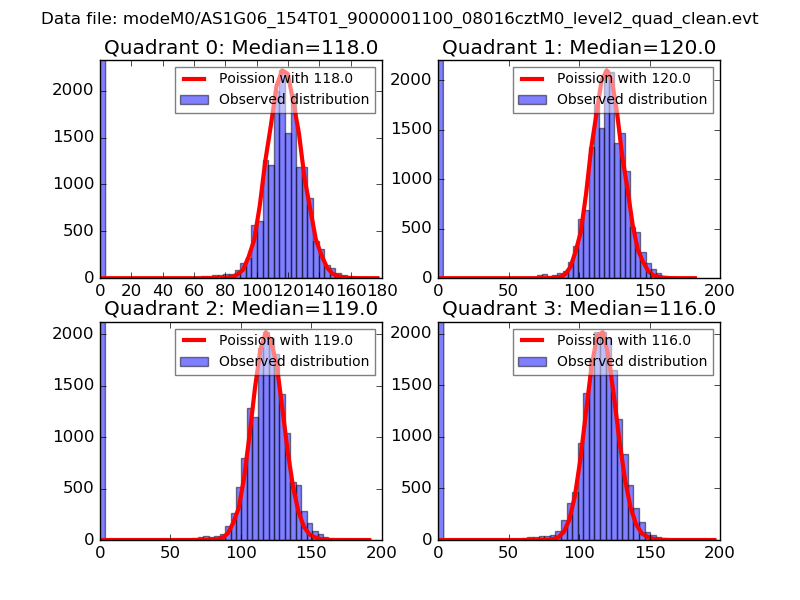 |
 |
| Quadrant-wise count rates Data is divided into 100 sec bins |
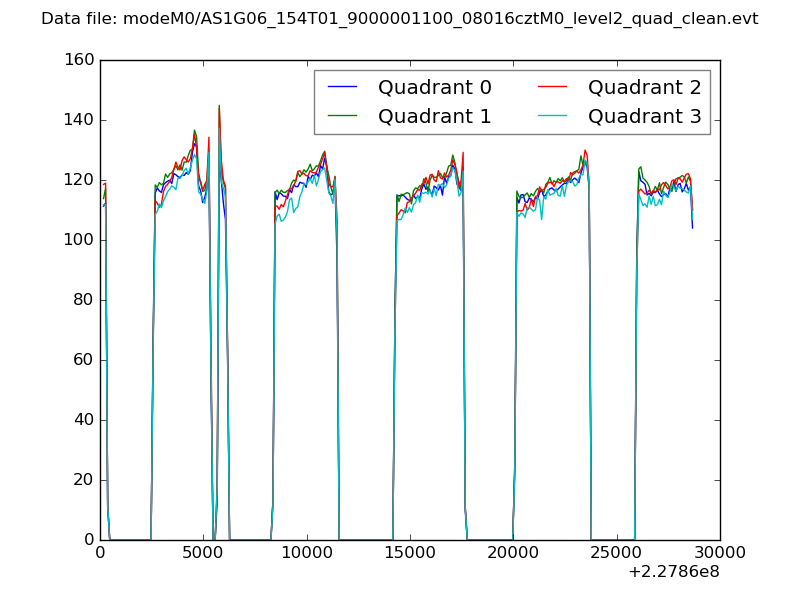 |
|
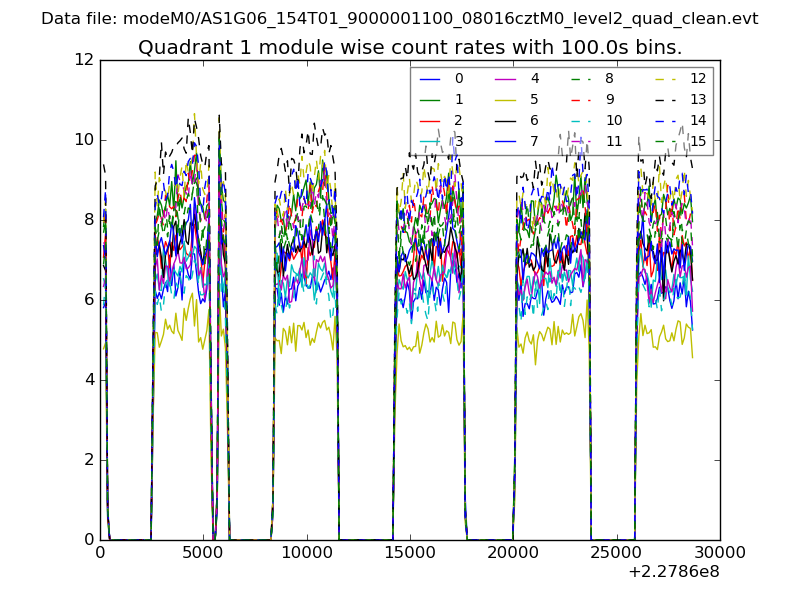
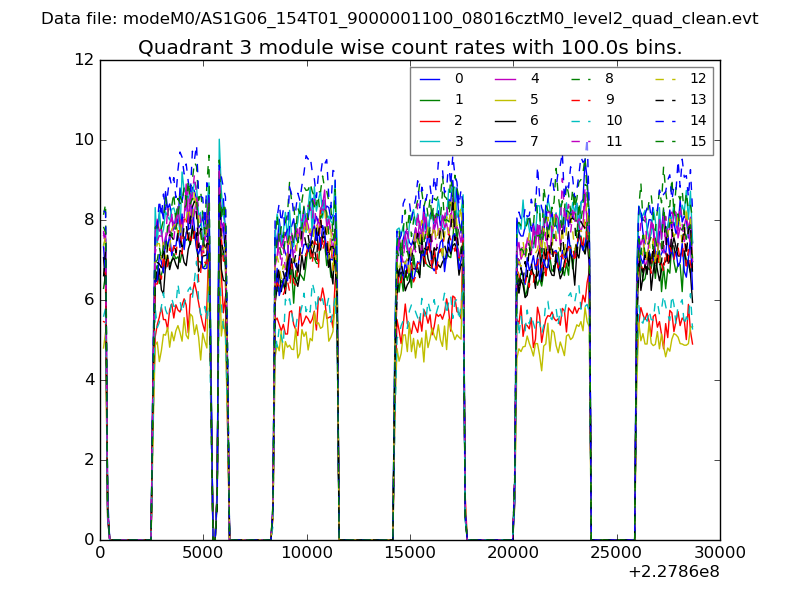
| Module-wise count rates for Quadrant A Data is divided into 100 sec bins |
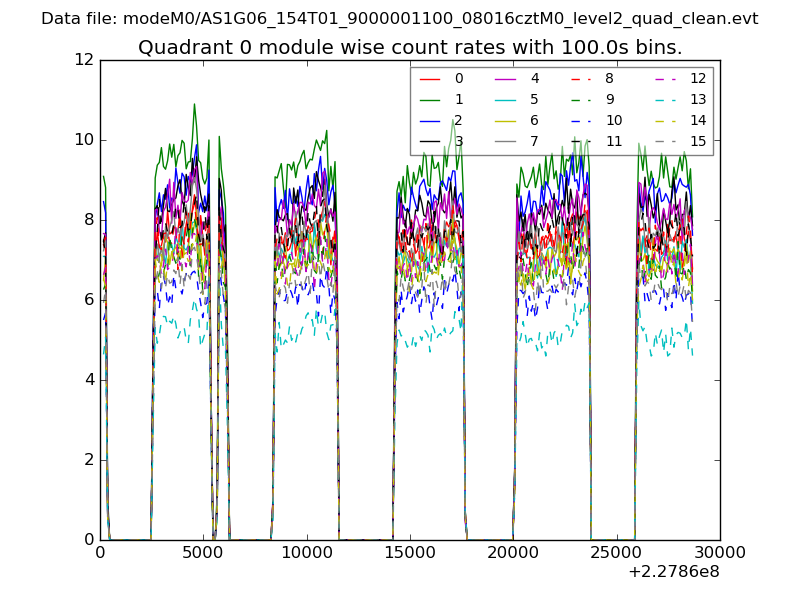 |
 |
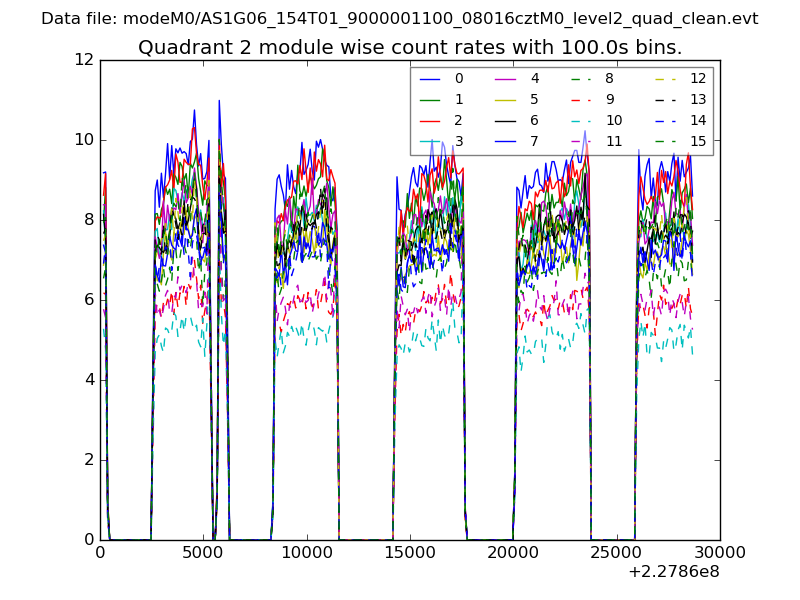
| Module-wise count rates for Quadrant B Data is divided into 100 sec bins |
 |
 |
| Module-wise count rates for Quadrant C Data is divided into 100 sec bins |
 |
 |
| Module-wise count rates for Quadrant D Data is divided into 100 sec bins |
 |
 |
| Parameter | Plot |
|---|---|
| CZT HV Monitor | 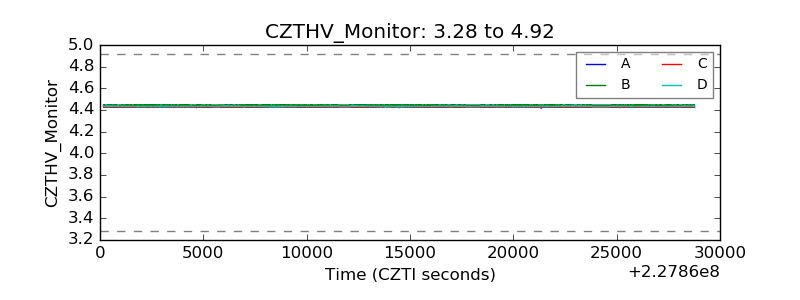 |
| D_VDD | 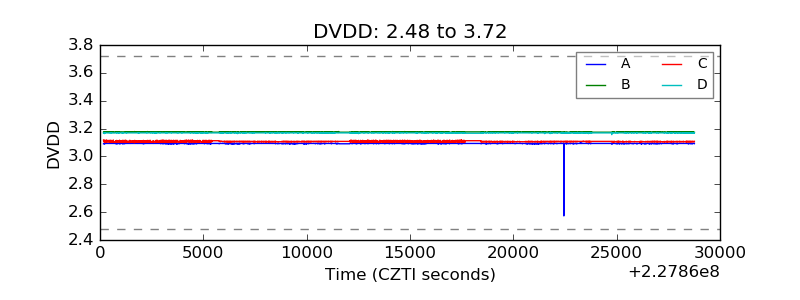 |
| Temperature 1 | 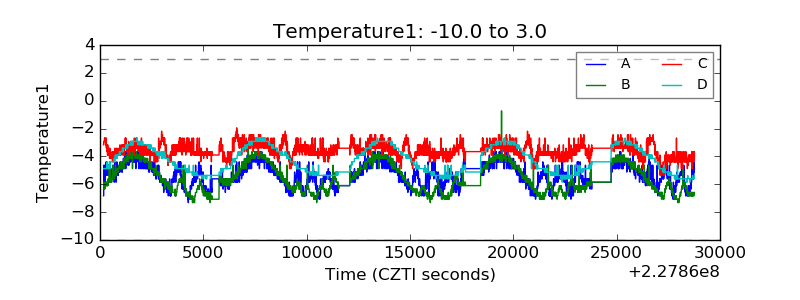 |
| Veto HV Monitor | 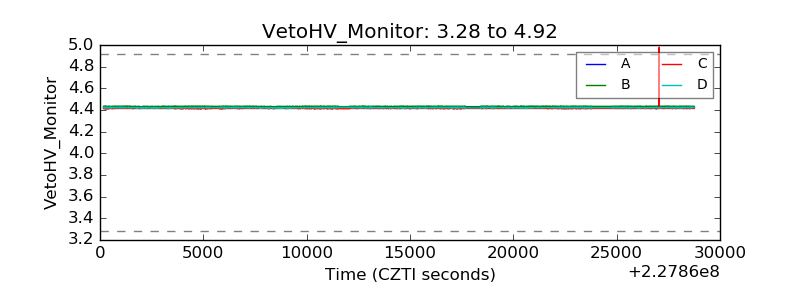 |
| Veto LLD | 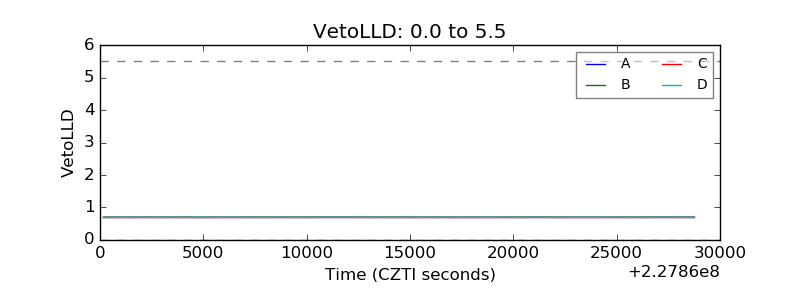 |
| Alpha Counter | 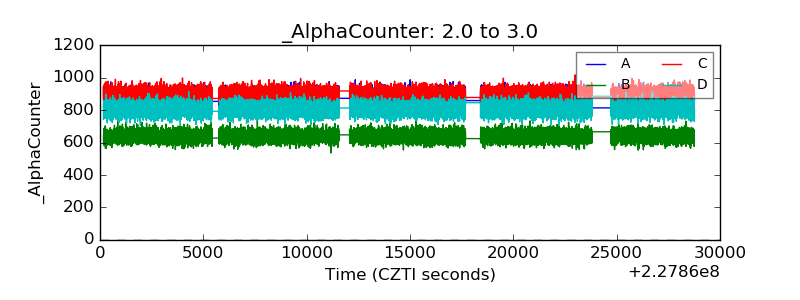 |
| _CPM_Rate | 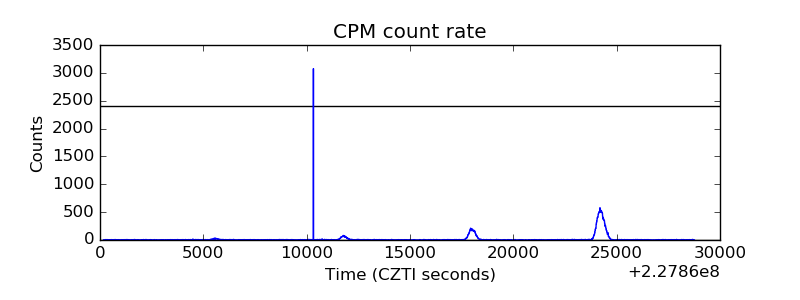 |
| CZT Counter | 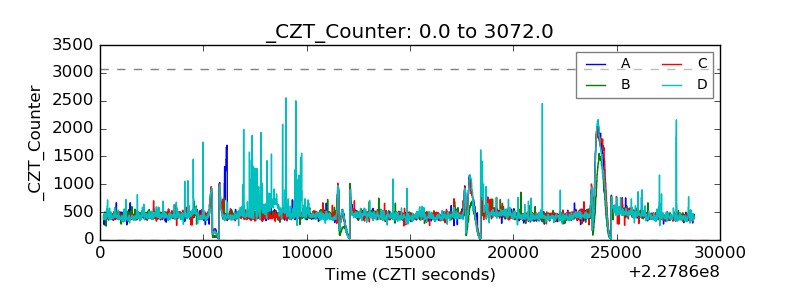 |
| +2.5 Volts monitor |  |
| +5 Volts monitor |  |
| _ROLL_ROT | 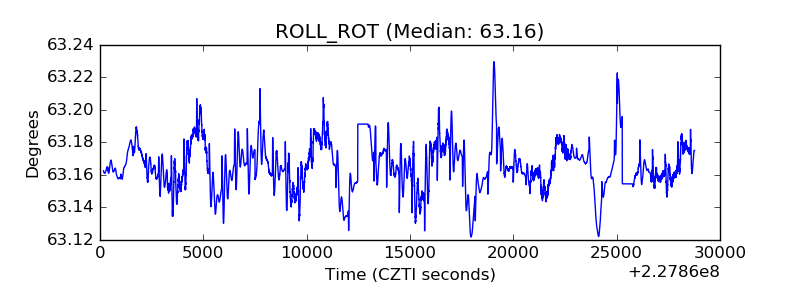 |
| _Roll_DEC | 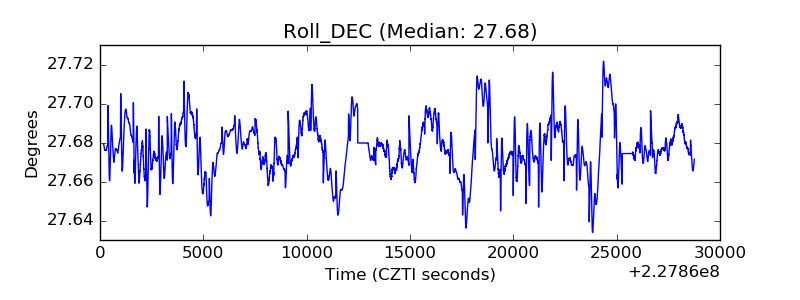 |
| _Roll_RA | 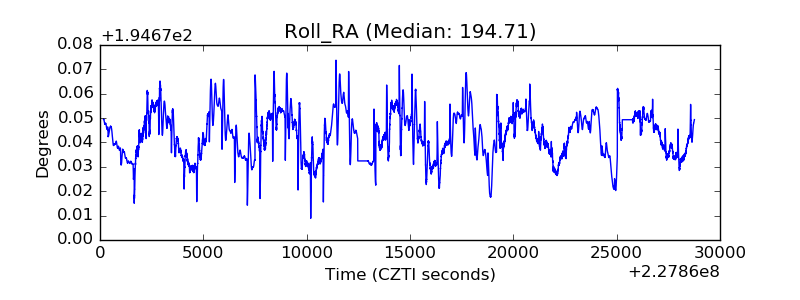 |
| Veto Counter | 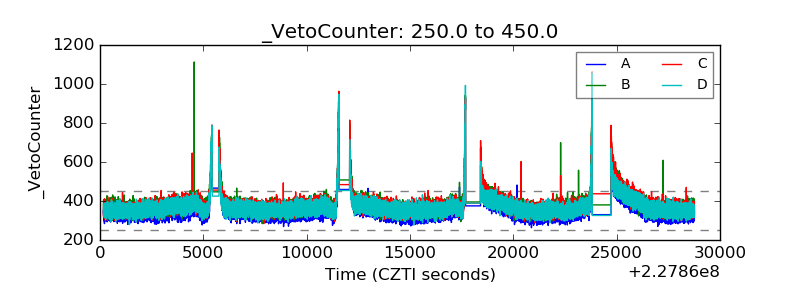 |