| Param | Original file | Final file |
|---|---|---|
| Filename | modeM0/AS1G06_154T01_9000001100_08190cztM0_level2.evt | modeM0/AS1G06_154T01_9000001100_08190cztM0_level2_quad_clean.evt |
| Size (bytes) | 16,761,600 | 4,608,000 |
| Size | 16.0 MB | 4.4 MB |
| Events in quadrant A | 103,130 | 29,211 |
| Events in quadrant B | 106,470 | 29,373 |
| Events in quadrant C | 96,662 | 29,028 |
| Events in quadrant D | 182,382 | 27,236 |
| Mode SS | |||
|---|---|---|---|
| Quadrant | BADHDUFLAG | Total packets | Discarded packets |
| A | 0 | 4 | 0 |
| B | 0 | 4 | 0 |
| C | 0 | 4 | 0 |
| D | 0 | 4 | 0 |
| Mode M0 | |||
|---|---|---|---|
| Quadrant | BADHDUFLAG | Total packets | Discarded packets |
| A | 0 | 455 | 1 |
| B | 0 | 460 | 0 |
| C | 0 | 452 | 0 |
| D | 0 | 697 | 0 |
| Quadrant | Total seconds | Saturated seconds | Saturation percentage |
|---|---|---|---|
| A | 226 | 0 | 0.000000% |
| B | 226 | 0 | 0.000000% |
| C | 226 | 0 | 0.000000% |
| D | 226 | 14 | 6.194690% |
Noise dominated data is calculated using 1-second bins in cleaned event files. If a bin has >2000 counts, and if more than 50% of those come from <1% of pixels, then it is considered to be noise-dominated and hence unusable.
| Quadrant | # 1 sec bins | Bins with >0 counts | Bins with >2000 counts | High rate bins dominated by noise | Noise dominated (total time) | Noise dominated (detector-on time) | Marked lightcurve |
|---|---|---|---|---|---|---|---|
| A | 226 | 226 | 0 | 0 | 0.00% | 0.00% | 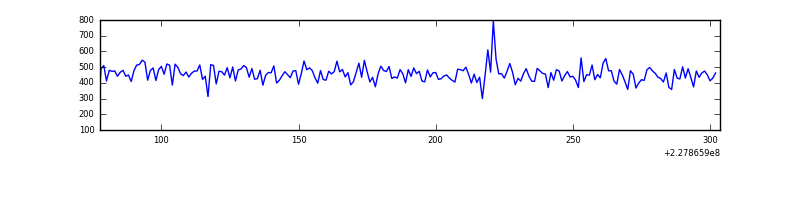 |
| B | 226 | 226 | 0 | 0 | 0.00% | 0.00% | 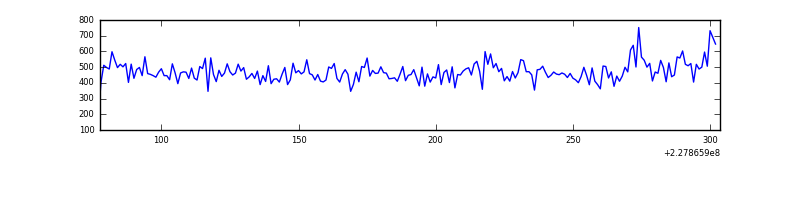 |
| C | 226 | 226 | 0 | 0 | 0.00% | 0.00% | 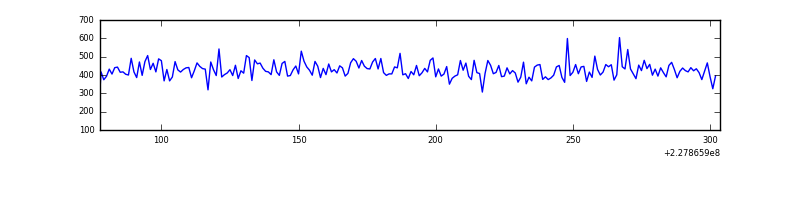 |
| D | 226 | 226 | 13 | 13 | 5.75% | 5.75% |  |
Top three noisy pixels from each quadrant. If the there are fewer than three noisy pixels in the level2.evt file, extra rows are filled as -1
| Pixel properties | Quadrant properties | ||||||
|---|---|---|---|---|---|---|---|
| Quadrant | DetID | PixID | Counts | Sigma | Mean | Median | Sigma |
| A | 8 | 15 | 532 | 69.71 | 26 | 25 | 7.3 |
| A | 13 | 14 | 407 | 52.52 | 26 | 25 | 7.3 |
| A | 12 | 194 | 264 | 32.86 | 26 | 25 | 7.3 |
| B | 0 | 214 | 3861 | 539.23 | 25 | 24 | 7.1 |
| B | 0 | 219 | 1941 | 269.4 | 25 | 24 | 7.1 |
| B | 15 | 204 | 758 | 103.15 | 25 | 24 | 7.1 |
| C | 13 | 61 | 180 | 21.29 | 24 | 24 | 7.3 |
| C | 3 | 202 | 80 | 7.64 | 24 | 24 | 7.3 |
| C | 14 | 246 | 61 | 5.05 | 24 | 24 | 7.3 |
| D | 12 | 233 | 85220 | 10598.42 | 24 | 23 | 8.0 |
| D | 6 | 225 | 1390 | 170.05 | 24 | 23 | 8.0 |
| D | 2 | 234 | 926 | 112.33 | 24 | 23 | 8.0 |
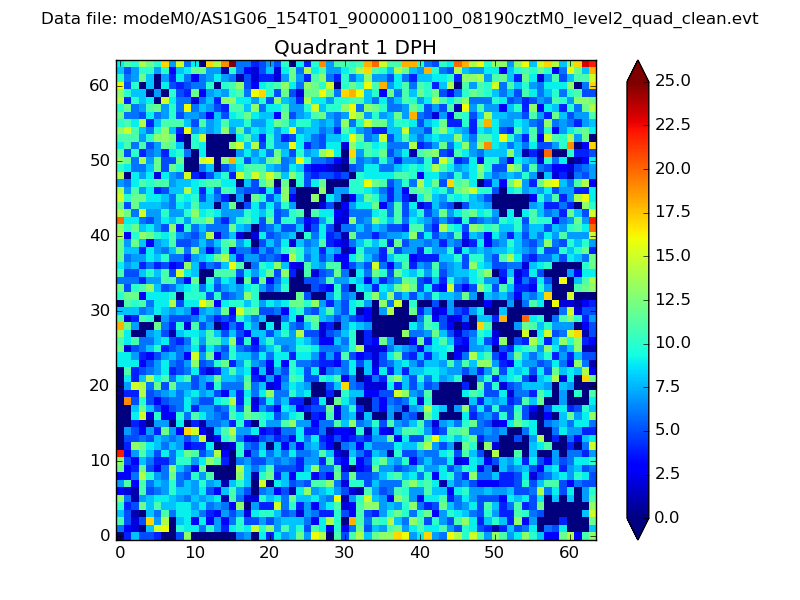
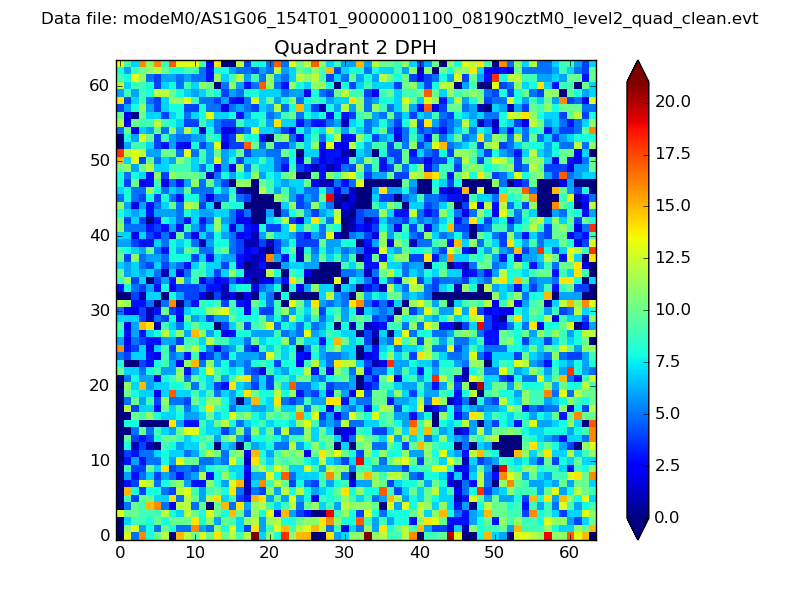
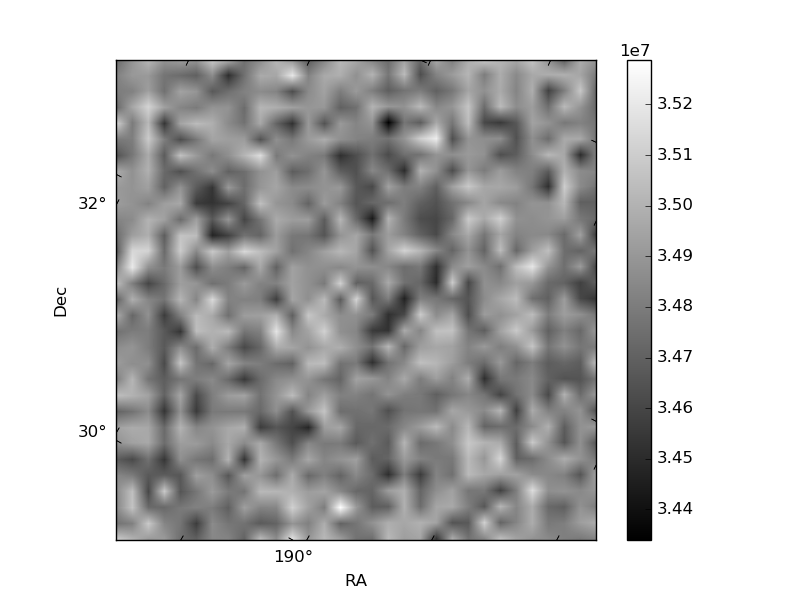
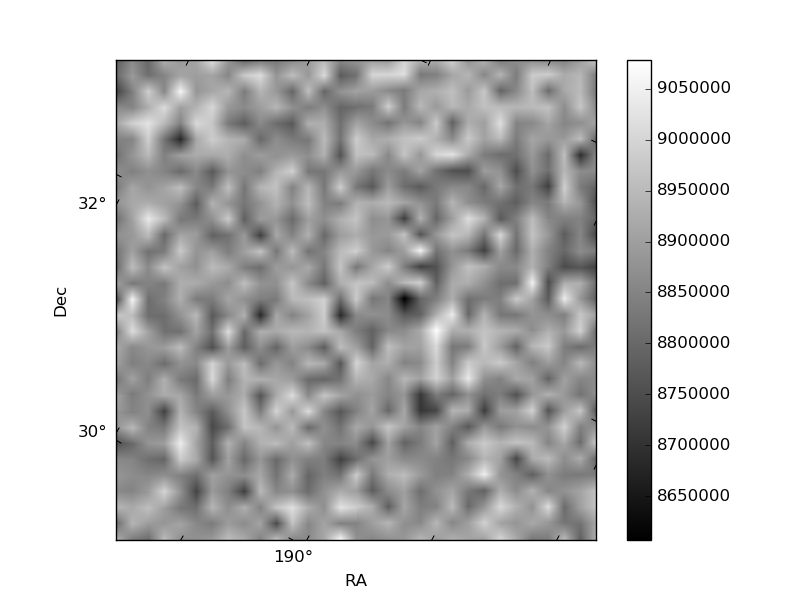
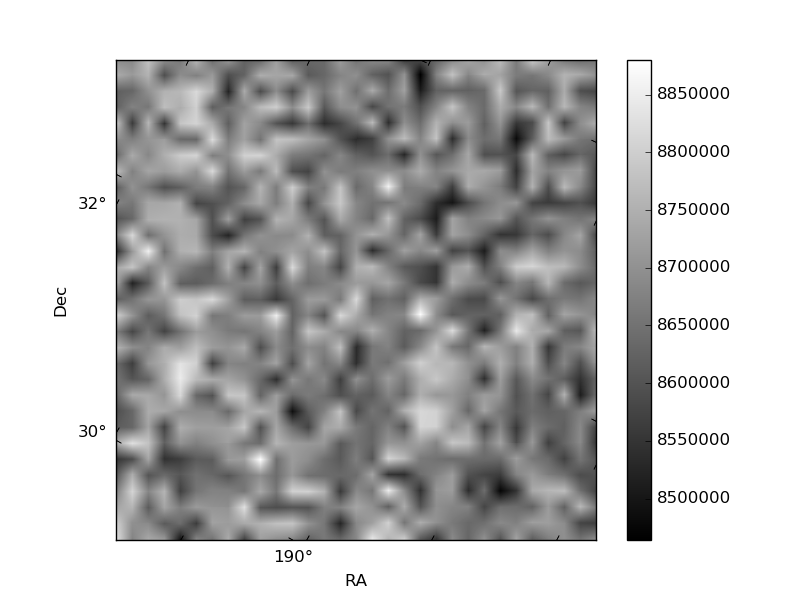
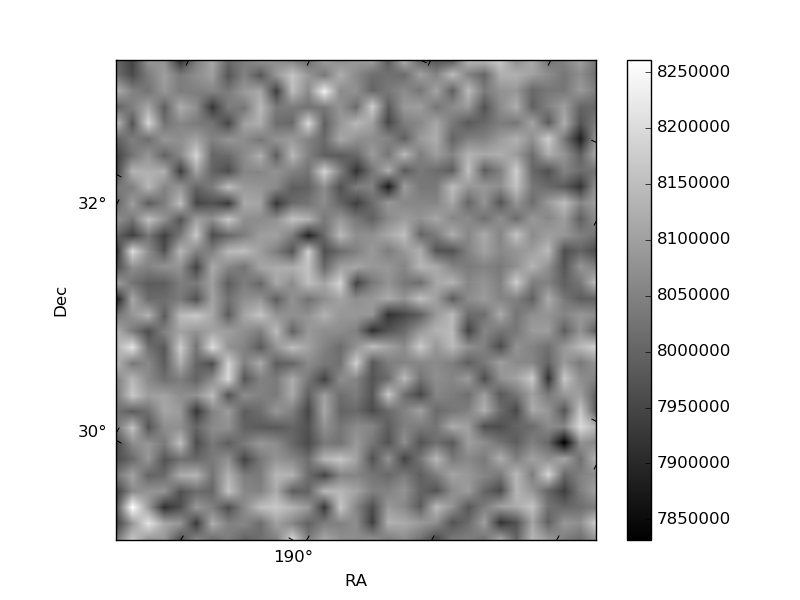
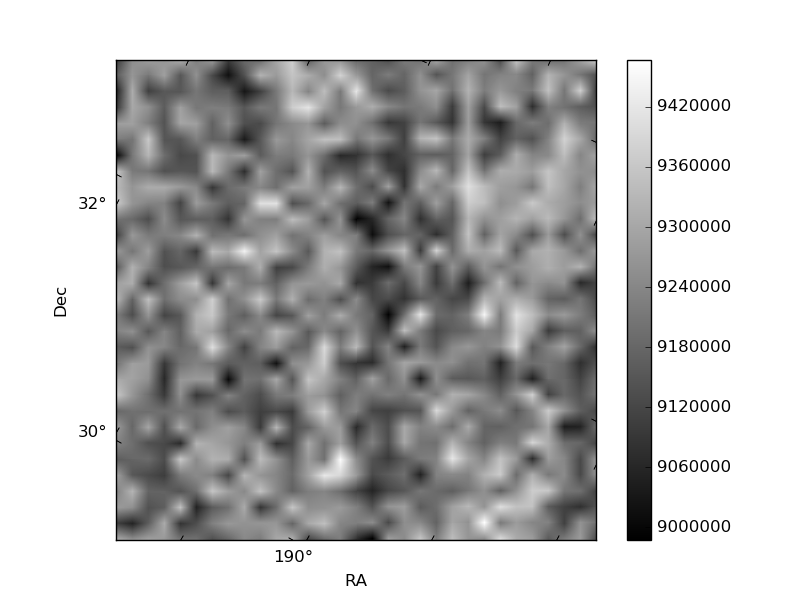
Histogram calculated using DETX and DETY for each event in the final _common_clean file
| Quadrant A | 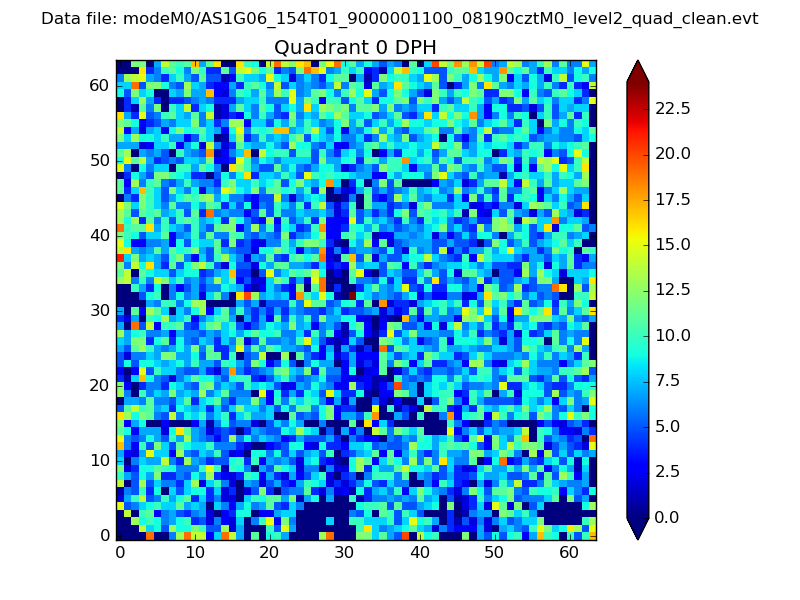 |
 |
Quadrant B |
|---|---|---|---|
| Quadrant D | 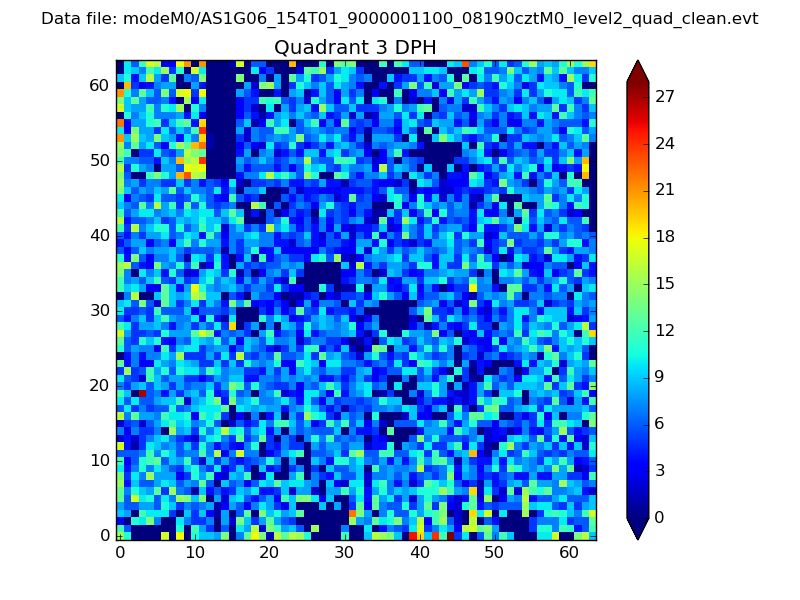 |
 |
Quadrant C |
| Plot type | Count rate plots | Images |
|---|---|---|
| Comparison with Poisson distribution Blue bars denote a histogram of data divided into 1 sec bins. Red curve is a Poisson curve with rate = median count rate of data. |
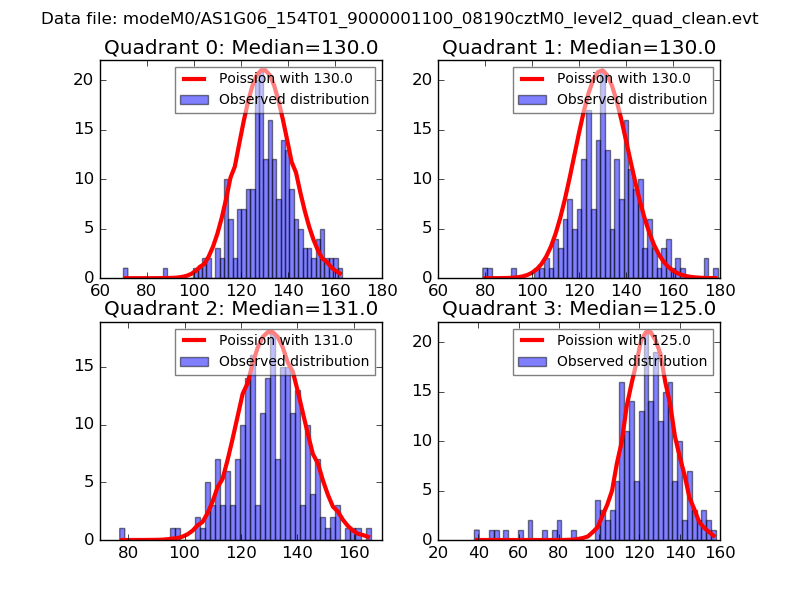 |
 |
| Quadrant-wise count rates Data is divided into 100 sec bins |
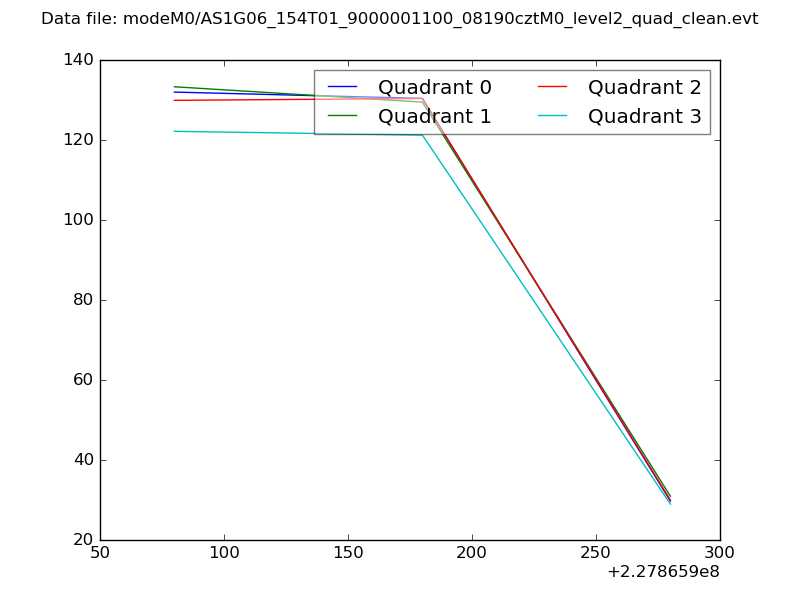 |
|
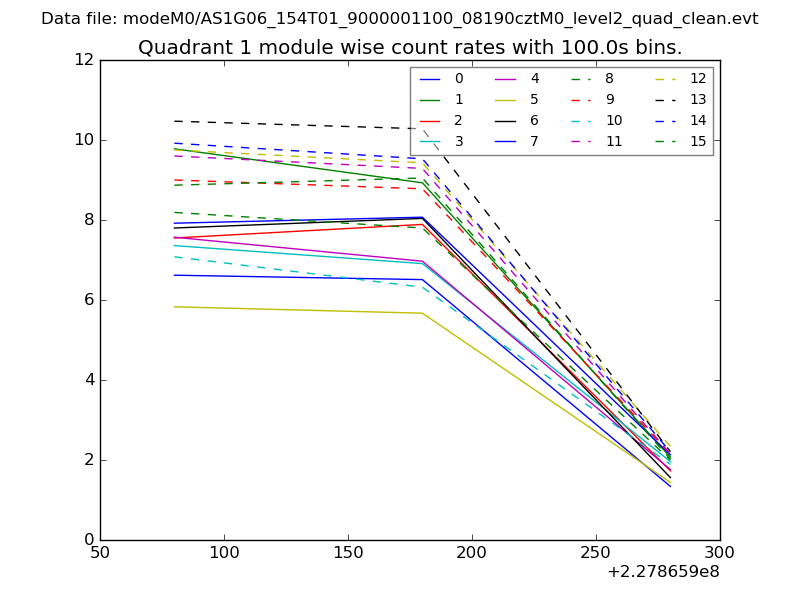
| Module-wise count rates for Quadrant A Data is divided into 100 sec bins |
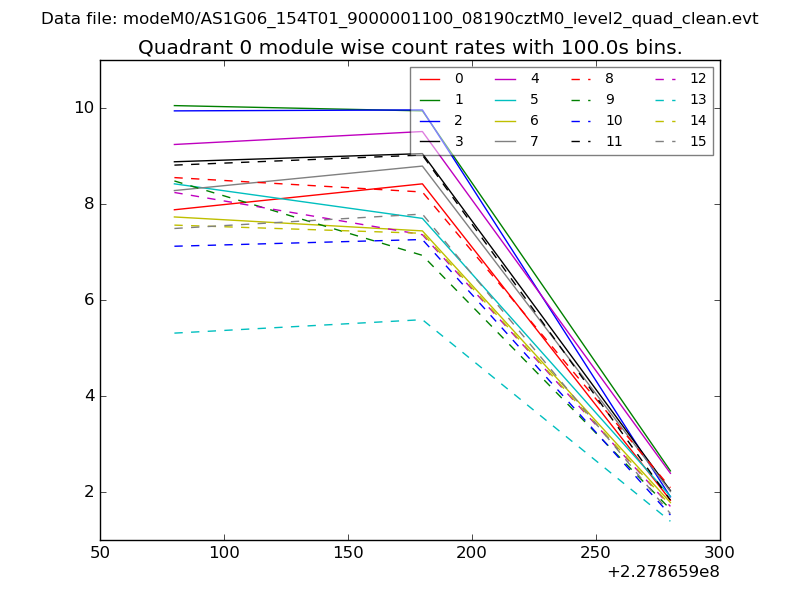 |
 |
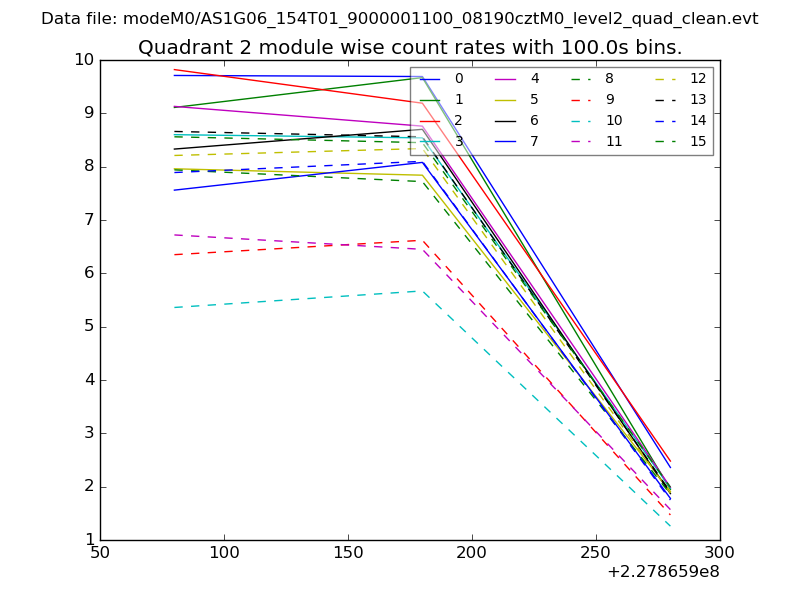
| Module-wise count rates for Quadrant B Data is divided into 100 sec bins |
 |
 |
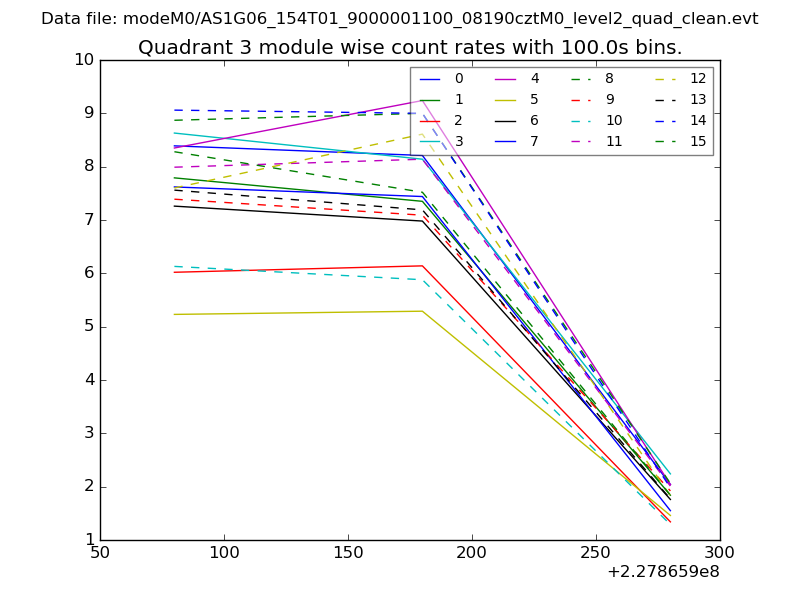
| Module-wise count rates for Quadrant C Data is divided into 100 sec bins |
 |
 |
| Module-wise count rates for Quadrant D Data is divided into 100 sec bins |
 |
 |
| Parameter | Plot |
|---|---|
| CZT HV Monitor | 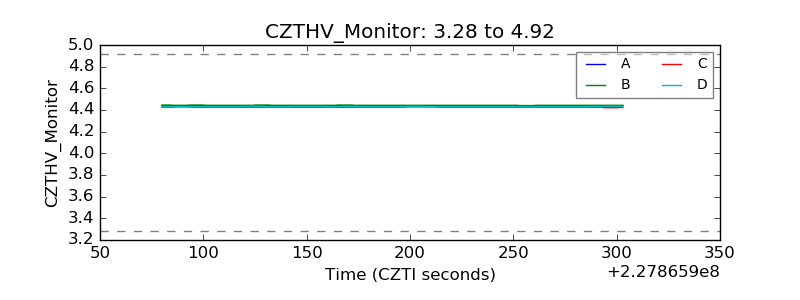 |
| D_VDD |  |
| Temperature 1 | 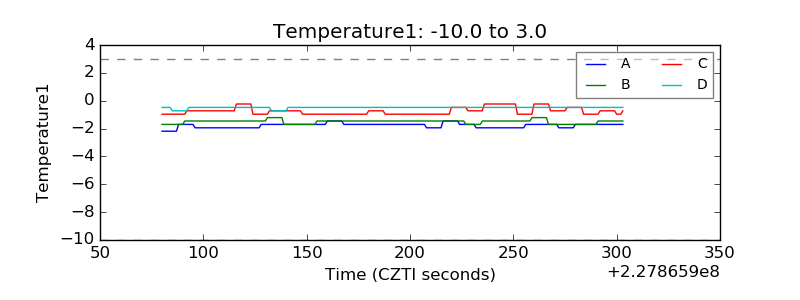 |
| Veto HV Monitor |  |
| Veto LLD | 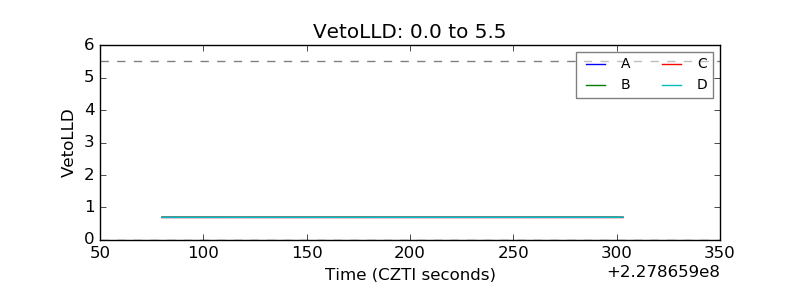 |
| Alpha Counter | 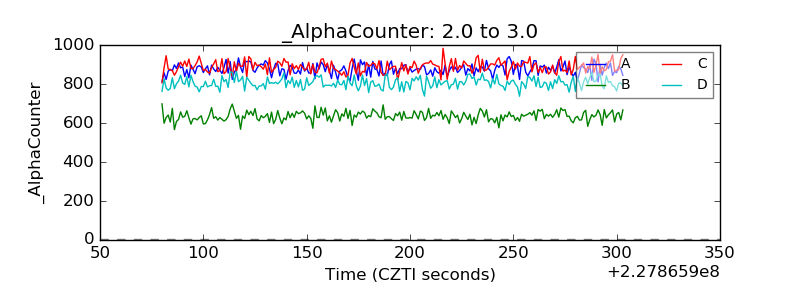 |
| _CPM_Rate | 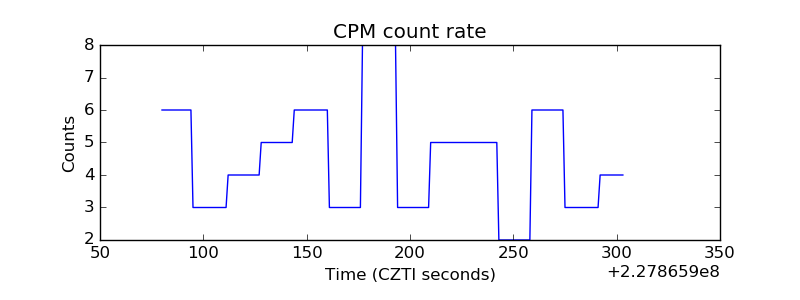 |
| CZT Counter | 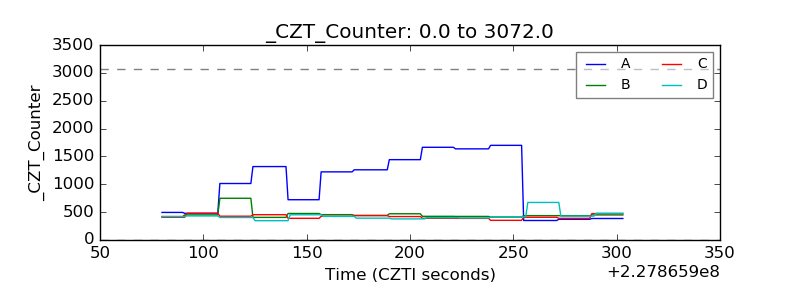 |
| +2.5 Volts monitor |  |
| +5 Volts monitor |  |
| _ROLL_ROT | 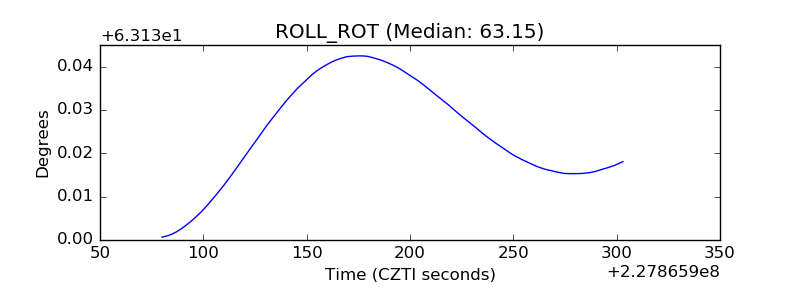 |
| _Roll_DEC | 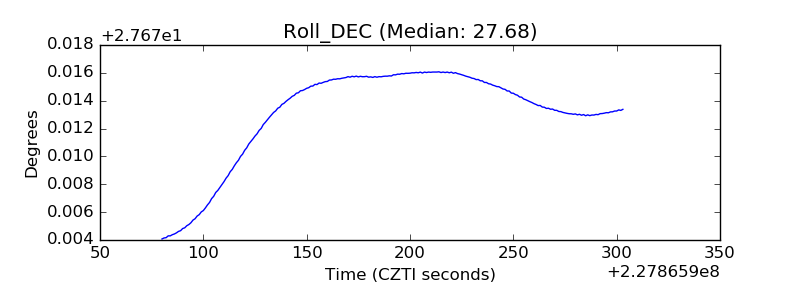 |
| _Roll_RA |  |
| Veto Counter | 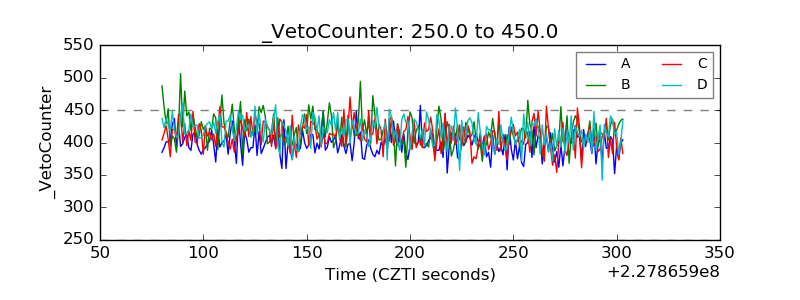 |