| Param | Original file | Final file |
|---|---|---|
| Filename | modeM0/AS1G06_154T02_9000001102cztM0_level2.fits | modeM0/AS1G06_154T02_9000001102cztM0_level2_quad_clean.evt |
| Size (bytes) | 523,114,560 | 458,743,680 |
| Size | 498.9 MB | 437.5 MB |
| Events in quadrant A | 3,132,296 | 2,597,187 |
| Events in quadrant B | 3,067,106 | 2,647,252 |
| Events in quadrant C | 3,165,556 | 2,571,897 |
| Events in quadrant D | 2,728,598 | 2,326,831 |
| Mode M0 | |||
|---|---|---|---|
| Quadrant | BADHDUFLAG | Total packets | Discarded packets |
| A | 0 | 112981 | 0 |
| B | 0 | 114709 | 0 |
| C | 0 | 113183 | 0 |
| D | 0 | 121432 | 0 |
| Mode SS | |||
|---|---|---|---|
| Quadrant | BADHDUFLAG | Total packets | Discarded packets |
| A | 0 | 1112 | 0 |
| B | 0 | 1112 | 0 |
| C | 0 | 1112 | 0 |
| D | 0 | 1112 | 0 |
| Mode M9 | |||
|---|---|---|---|
| Quadrant | BADHDUFLAG | Total packets | Discarded packets |
| A | 0 | 85 | 0 |
| B | 0 | 85 | 0 |
| C | 0 | 85 | 0 |
| D | 0 | 85 | 0 |
| Quadrant | Total seconds | Saturated seconds | Saturation percentage |
|---|---|---|---|
| A | 54642 | 575 | 1.052304% |
| B | 54645 | 768 | 1.405435% |
| C | 54644 | 394 | 0.721031% |
| D | 54644 | 927 | 1.696435% |
Noise dominated data is calculated using 1-second bins in cleaned event files. If a bin has >2000 counts, and if more than 50% of those come from <1% of pixels, then it is considered to be noise-dominated and hence unusable.
| Quadrant | # 1 sec bins | Bins with >0 counts | Bins with >2000 counts | High rate bins dominated by noise | Noise dominated (total time) | Noise dominated (detector-on time) | Marked lightcurve |
|---|---|---|---|---|---|---|---|
| A | 63206 | 54647 | 0 | 0 | 0.00% | 0.00% |  |
| B | 63206 | 54647 | 0 | 0 | 0.00% | 0.00% |  |
| C | 63206 | 54646 | 0 | 0 | 0.00% | 0.00% |  |
| D | 63206 | 54645 | 0 | 0 | 0.00% | 0.00% |  |
Top three noisy pixels from each quadrant. If the there are fewer than three noisy pixels in the level2.evt file, extra rows are filled as -1
| Pixel properties | Quadrant properties | ||||||
|---|---|---|---|---|---|---|---|
| Quadrant | DetID | PixID | Counts | Sigma | Mean | Median | Sigma |
| A | 0 | 29 | 2949 | 10.48 | 813 | 756 | 209.2 |
| A | 7 | 110 | 2648 | 9.04 | 813 | 756 | 209.2 |
| A | 9 | 19 | 2298 | 7.37 | 813 | 756 | 209.2 |
| B | 2 | 9 | 2618 | 11.19 | 808 | 764 | 165.6 |
| B | 5 | 225 | 2072 | 7.9 | 808 | 764 | 165.6 |
| B | 12 | 226 | 2071 | 7.89 | 808 | 764 | 165.6 |
| C | 1 | 80 | 2348 | 7.11 | 835 | 775 | 221.3 |
| C | 1 | 81 | 2264 | 6.73 | 835 | 775 | 221.3 |
| C | 12 | 241 | 2206 | 6.47 | 835 | 775 | 221.3 |
| D | 6 | 231 | 2001 | 6.19 | 776 | 705 | 209.4 |
| D | 3 | 14 | 1983 | 6.1 | 776 | 705 | 209.4 |
| D | 1 | 19 | 1960 | 5.99 | 776 | 705 | 209.4 |
Histogram calculated using DETX and DETY for each event in the final _common_clean file
| Quadrant A |  |
 |
Quadrant B |
|---|---|---|---|
| Quadrant D | 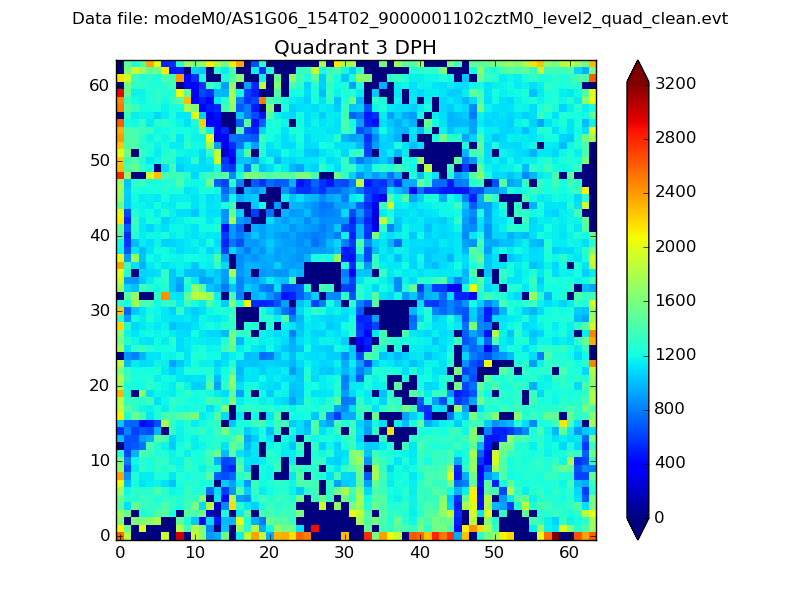 |
 |
Quadrant C |
| Plot type | Count rate plots | Images |
|---|---|---|
| Comparison with Poisson distribution Blue bars denote a histogram of data divided into 1 sec bins. Red curve is a Poisson curve with rate = median count rate of data. |
 |
 |
| Quadrant-wise count rates Data is divided into 100 sec bins |
 |
|
| Module-wise count rates for Quadrant A Data is divided into 100 sec bins |
 |
 |
| Module-wise count rates for Quadrant B Data is divided into 100 sec bins |
 |
 |
| Module-wise count rates for Quadrant C Data is divided into 100 sec bins |
 |
 |
| Module-wise count rates for Quadrant D Data is divided into 100 sec bins |
 |
 |
| Parameter | Plot |
|---|---|
| CZT HV Monitor |  |
| D_VDD |  |
| Temperature 1 |  |
| Veto HV Monitor |  |
| Veto LLD |  |
| Alpha Counter |  |
| _CPM_Rate |  |
| CZT Counter |  |
| +2.5 Volts monitor |  |
| +5 Volts monitor |  |
| _ROLL_ROT |  |
| _Roll_DEC |  |
| _Roll_RA |  |
| Veto Counter |  |