| Param | Original file | Final file |
|---|---|---|
| Filename | modeM0/AS1G06_154T02_9000001102_08016cztM0_level2.evt | modeM0/AS1G06_154T02_9000001102_08016cztM0_level2_quad_clean.evt |
| Size (bytes) | 484,574,400 | 101,764,800 |
| Size | 462.1 MB | 97.1 MB |
| Events in quadrant A | 3,477,549 | 638,187 |
| Events in quadrant B | 3,550,246 | 657,283 |
| Events in quadrant C | 3,496,000 | 653,260 |
| Events in quadrant D | 3,662,314 | 631,726 |
| Mode M0 | |||
|---|---|---|---|
| Quadrant | BADHDUFLAG | Total packets | Discarded packets |
| A | 0 | 15214 | 3 |
| B | 0 | 15340 | 2 |
| C | 0 | 15252 | 2 |
| D | 0 | 15943 | 2 |
| Mode SS | |||
|---|---|---|---|
| Quadrant | BADHDUFLAG | Total packets | Discarded packets |
| A | 0 | 148 | 0 |
| B | 0 | 148 | 0 |
| C | 0 | 148 | 0 |
| D | 0 | 148 | 0 |
| Mode M9 | |||
|---|---|---|---|
| Quadrant | BADHDUFLAG | Total packets | Discarded packets |
| A | 0 | 23 | 0 |
| B | 0 | 23 | 0 |
| C | 0 | 23 | 0 |
| D | 0 | 23 | 0 |
| Quadrant | Total seconds | Saturated seconds | Saturation percentage |
|---|---|---|---|
| A | 7202 | 65 | 0.902527% |
| B | 7202 | 69 | 0.958067% |
| C | 7202 | 59 | 0.819217% |
| D | 7202 | 74 | 1.027492% |
Noise dominated data is calculated using 1-second bins in cleaned event files. If a bin has >2000 counts, and if more than 50% of those come from <1% of pixels, then it is considered to be noise-dominated and hence unusable.
| Quadrant | # 1 sec bins | Bins with >0 counts | Bins with >2000 counts | High rate bins dominated by noise | Noise dominated (total time) | Noise dominated (detector-on time) | Marked lightcurve |
|---|---|---|---|---|---|---|---|
| A | 9502 | 7204 | 0 | 0 | 0.00% | 0.00% | 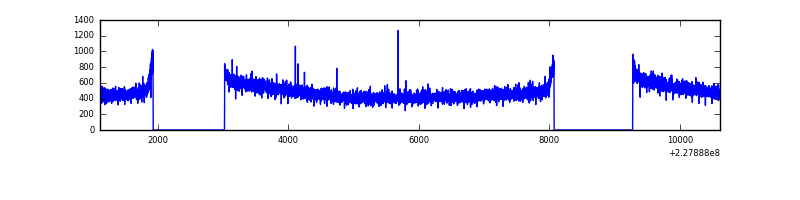 |
| B | 9502 | 7204 | 0 | 0 | 0.00% | 0.00% | 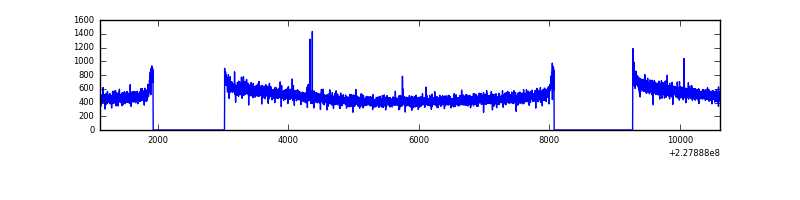 |
| C | 9502 | 7204 | 0 | 0 | 0.00% | 0.00% | 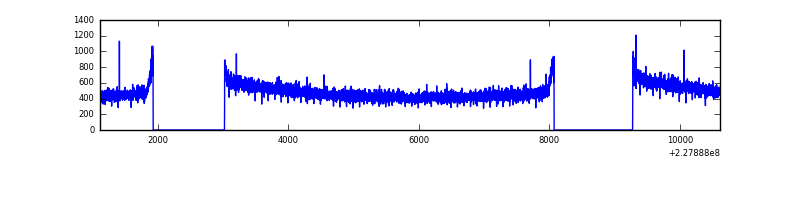 |
| D | 9502 | 7204 | 6 | 6 | 0.06% | 0.08% |  |
Top three noisy pixels from each quadrant. If the there are fewer than three noisy pixels in the level2.evt file, extra rows are filled as -1
| Pixel properties | Quadrant properties | ||||||
|---|---|---|---|---|---|---|---|
| Quadrant | DetID | PixID | Counts | Sigma | Mean | Median | Sigma |
| A | 0 | 226 | 8550 | 42.05 | 903 | 885 | 182.3 |
| A | 12 | 194 | 7588 | 36.77 | 903 | 885 | 182.3 |
| A | 3 | 137 | 3573 | 14.75 | 903 | 885 | 182.3 |
| B | 12 | 111 | 19543 | 108.24 | 911 | 891 | 172.3 |
| B | 11 | 111 | 15774 | 86.37 | 911 | 891 | 172.3 |
| B | 14 | 111 | 11778 | 63.18 | 911 | 891 | 172.3 |
| C | 1 | 16 | 8561 | 37.07 | 893 | 900 | 206.7 |
| C | 13 | 61 | 6730 | 28.21 | 893 | 900 | 206.7 |
| C | 8 | 222 | 3880 | 14.42 | 893 | 900 | 206.7 |
| D | 11 | 144 | 213649 | 1005.17 | 885 | 863 | 211.7 |
| D | 1 | 52 | 57342 | 266.8 | 885 | 863 | 211.7 |
| D | 2 | 14 | 45845 | 212.49 | 885 | 863 | 211.7 |
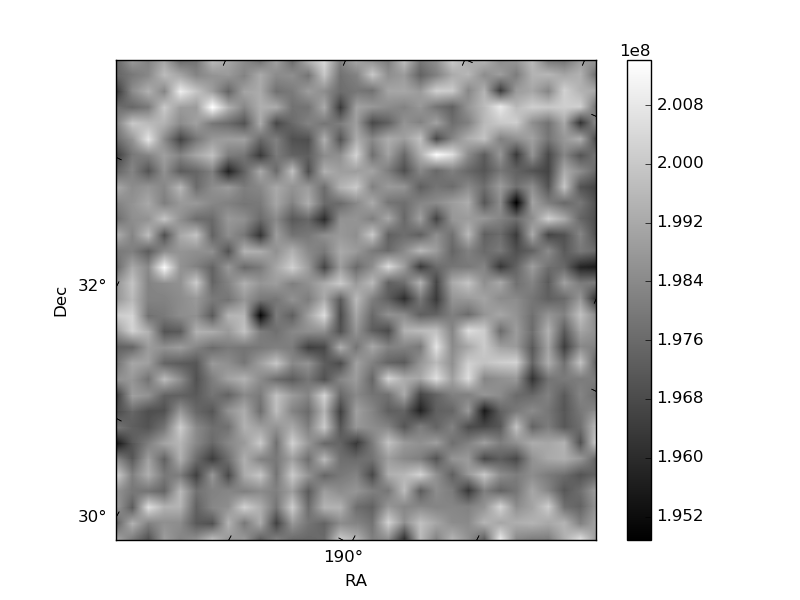
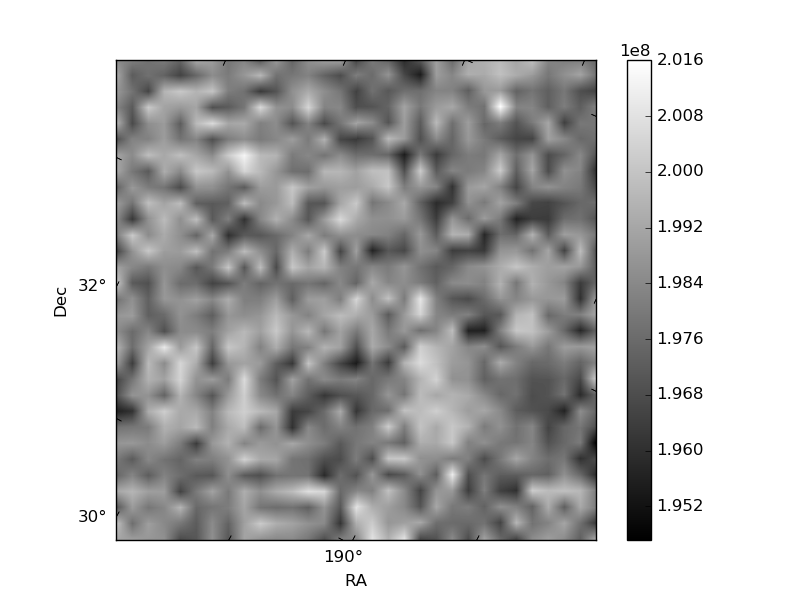
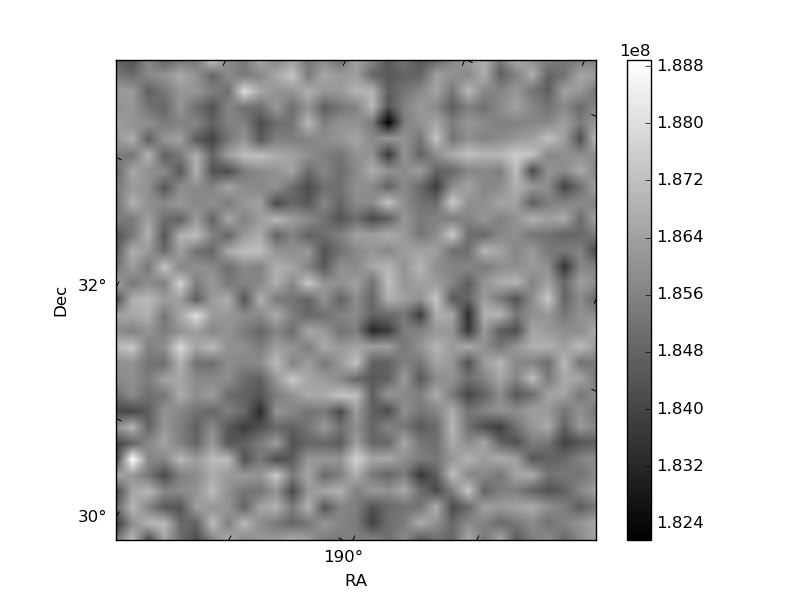
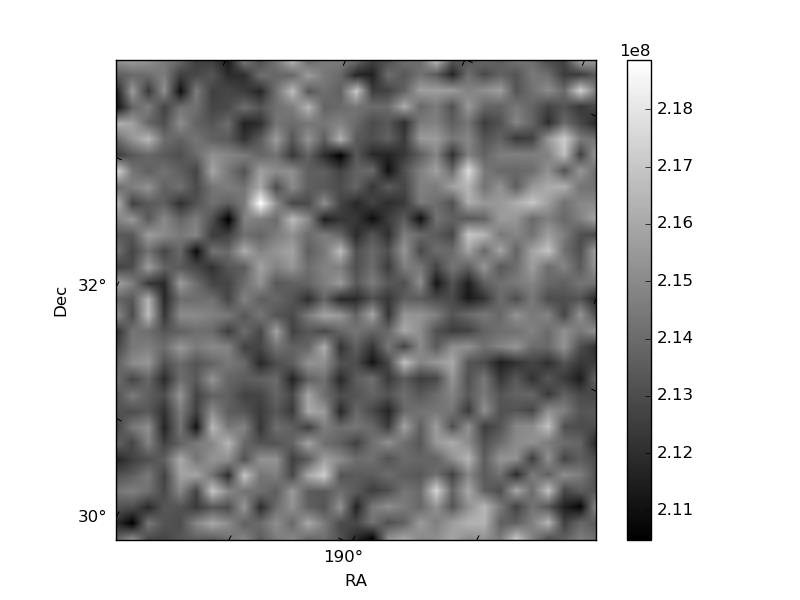
Histogram calculated using DETX and DETY for each event in the final _common_clean file
| Quadrant A |  |
 |
Quadrant B |
|---|---|---|---|
| Quadrant D |  |
 |
Quadrant C |
| Plot type | Count rate plots | Images |
|---|---|---|
| Comparison with Poisson distribution Blue bars denote a histogram of data divided into 1 sec bins. Red curve is a Poisson curve with rate = median count rate of data. |
 |
 |
| Quadrant-wise count rates Data is divided into 100 sec bins |
 |
|
| Module-wise count rates for Quadrant A Data is divided into 100 sec bins |
 |
 |
| Module-wise count rates for Quadrant B Data is divided into 100 sec bins |
 |
 |
| Module-wise count rates for Quadrant C Data is divided into 100 sec bins |
 |
 |
| Module-wise count rates for Quadrant D Data is divided into 100 sec bins |
 |
 |
| Parameter | Plot |
|---|---|
| CZT HV Monitor |  |
| D_VDD |  |
| Temperature 1 |  |
| Veto HV Monitor |  |
| Veto LLD |  |
| Alpha Counter |  |
| _CPM_Rate |  |
| CZT Counter |  |
| +2.5 Volts monitor |  |
| +5 Volts monitor |  |
| _ROLL_ROT |  |
| _Roll_DEC |  |
| _Roll_RA |  |
| Veto Counter |  |