| Param | Original file | Final file |
|---|---|---|
| Filename | modeM0/AS1G06_154T02_9000001102_08017cztM0_level2.evt | modeM0/AS1G06_154T02_9000001102_08017cztM0_level2_quad_clean.evt |
| Size (bytes) | 439,689,600 | 105,626,880 |
| Size | 419.3 MB | 100.7 MB |
| Events in quadrant A | 3,160,913 | 676,533 |
| Events in quadrant B | 3,285,792 | 702,668 |
| Events in quadrant C | 3,226,374 | 701,491 |
| Events in quadrant D | 3,207,935 | 671,891 |
| Mode M0 | |||
|---|---|---|---|
| Quadrant | BADHDUFLAG | Total packets | Discarded packets |
| A | 0 | 13690 | 3 |
| B | 0 | 13887 | 2 |
| C | 0 | 13840 | 2 |
| D | 0 | 13868 | 2 |
| Mode SS | |||
|---|---|---|---|
| Quadrant | BADHDUFLAG | Total packets | Discarded packets |
| A | 0 | 132 | 0 |
| B | 0 | 132 | 0 |
| C | 0 | 132 | 0 |
| D | 0 | 132 | 0 |
| Mode M9 | |||
|---|---|---|---|
| Quadrant | BADHDUFLAG | Total packets | Discarded packets |
| A | 0 | 25 | 0 |
| B | 0 | 25 | 0 |
| C | 0 | 25 | 0 |
| D | 0 | 25 | 0 |
| Quadrant | Total seconds | Saturated seconds | Saturation percentage |
|---|---|---|---|
| A | 6401 | 56 | 0.874863% |
| B | 6401 | 77 | 1.202937% |
| C | 6401 | 57 | 0.890486% |
| D | 6401 | 48 | 0.749883% |
Noise dominated data is calculated using 1-second bins in cleaned event files. If a bin has >2000 counts, and if more than 50% of those come from <1% of pixels, then it is considered to be noise-dominated and hence unusable.
| Quadrant | # 1 sec bins | Bins with >0 counts | Bins with >2000 counts | High rate bins dominated by noise | Noise dominated (total time) | Noise dominated (detector-on time) | Marked lightcurve |
|---|---|---|---|---|---|---|---|
| A | 8911 | 6403 | 0 | 0 | 0.00% | 0.00% | 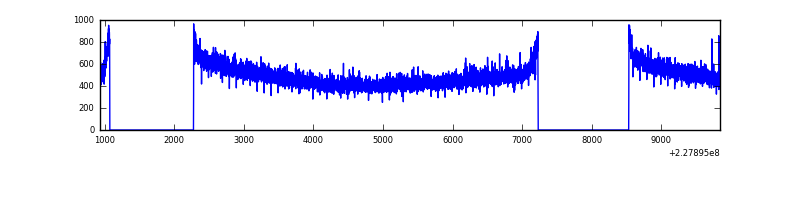 |
| B | 8911 | 6403 | 2 | 2 | 0.02% | 0.03% | 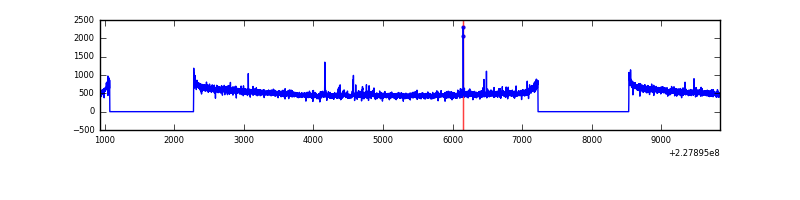 |
| C | 8911 | 6403 | 0 | 0 | 0.00% | 0.00% | 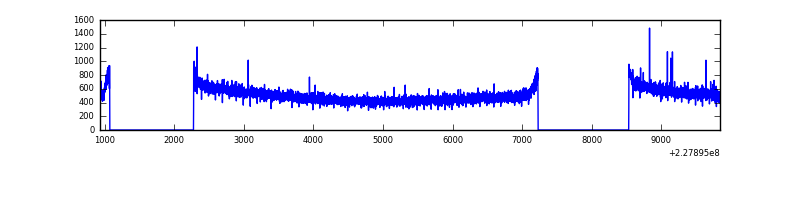 |
| D | 8911 | 6403 | 7 | 7 | 0.08% | 0.11% | 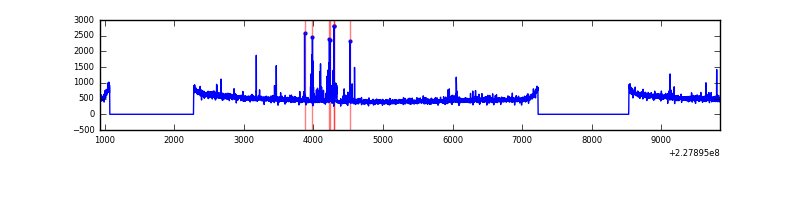 |
Top three noisy pixels from each quadrant. If the there are fewer than three noisy pixels in the level2.evt file, extra rows are filled as -1
| Pixel properties | Quadrant properties | ||||||
|---|---|---|---|---|---|---|---|
| Quadrant | DetID | PixID | Counts | Sigma | Mean | Median | Sigma |
| A | 0 | 226 | 7700 | 41.38 | 821 | 805 | 166.6 |
| A | 12 | 194 | 6797 | 35.96 | 821 | 805 | 166.6 |
| A | 3 | 137 | 3211 | 14.44 | 821 | 805 | 166.6 |
| B | 5 | 250 | 52695 | 332.58 | 830 | 809 | 156.0 |
| B | 12 | 111 | 17314 | 105.79 | 830 | 809 | 156.0 |
| B | 11 | 111 | 14101 | 85.2 | 830 | 809 | 156.0 |
| C | 13 | 61 | 6135 | 28.15 | 823 | 830 | 188.5 |
| C | 1 | 16 | 4858 | 21.37 | 823 | 830 | 188.5 |
| C | 12 | 4 | 4613 | 20.07 | 823 | 830 | 188.5 |
| D | 2 | 14 | 68283 | 350.35 | 814 | 794 | 192.6 |
| D | 1 | 52 | 34482 | 174.88 | 814 | 794 | 192.6 |
| D | 2 | 234 | 16431 | 81.18 | 814 | 794 | 192.6 |
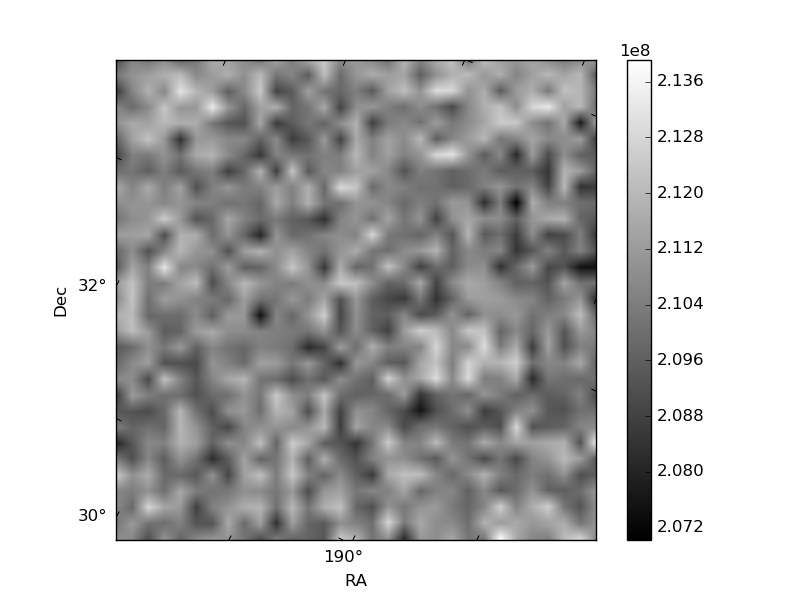
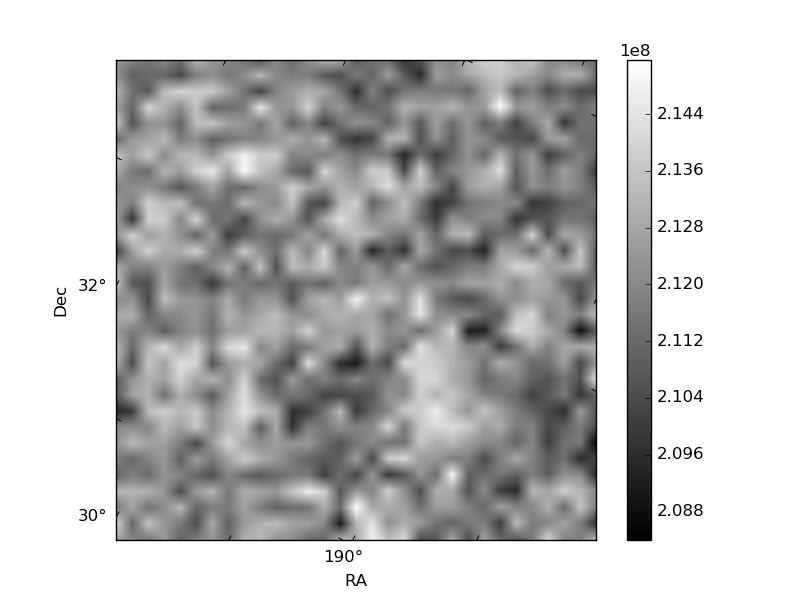
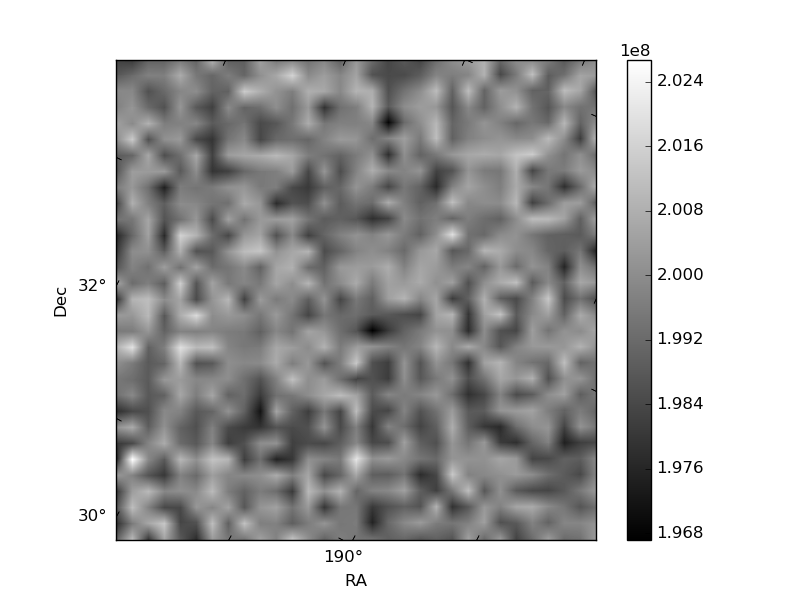
Histogram calculated using DETX and DETY for each event in the final _common_clean file
| Quadrant A | 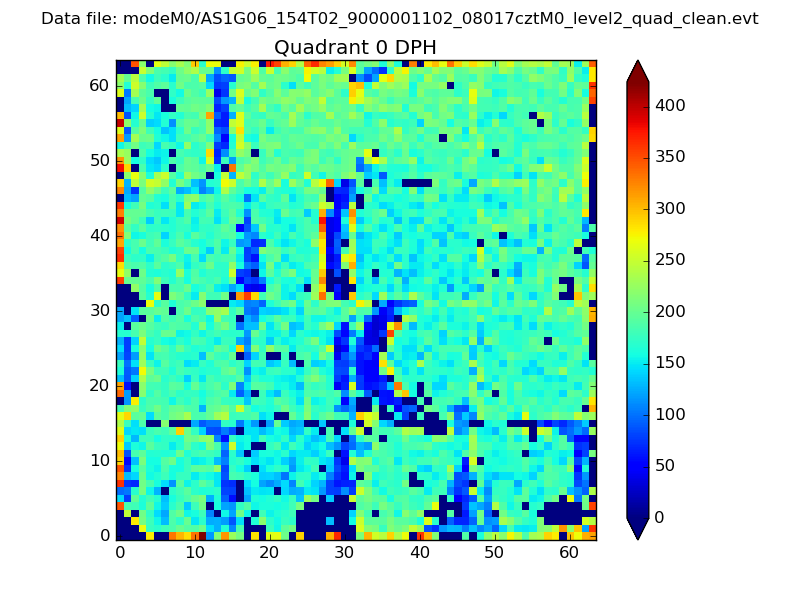 |
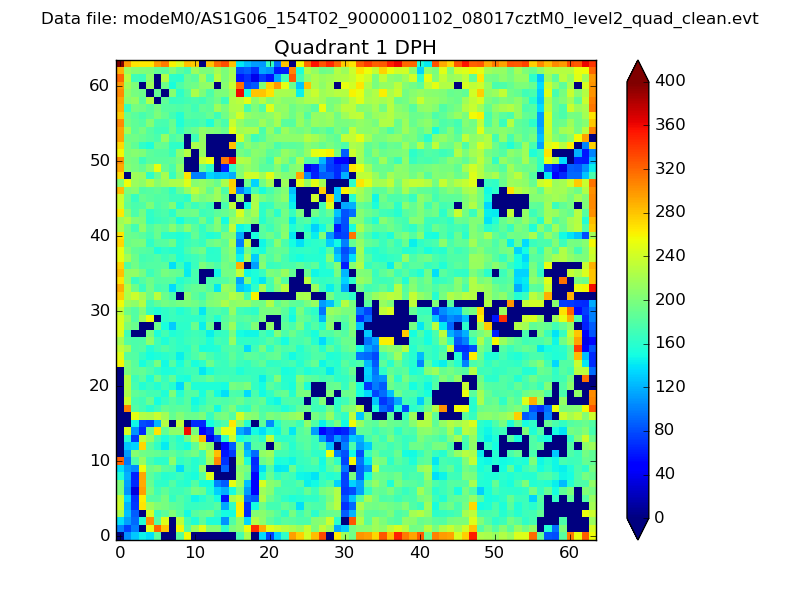 |
Quadrant B |
|---|---|---|---|
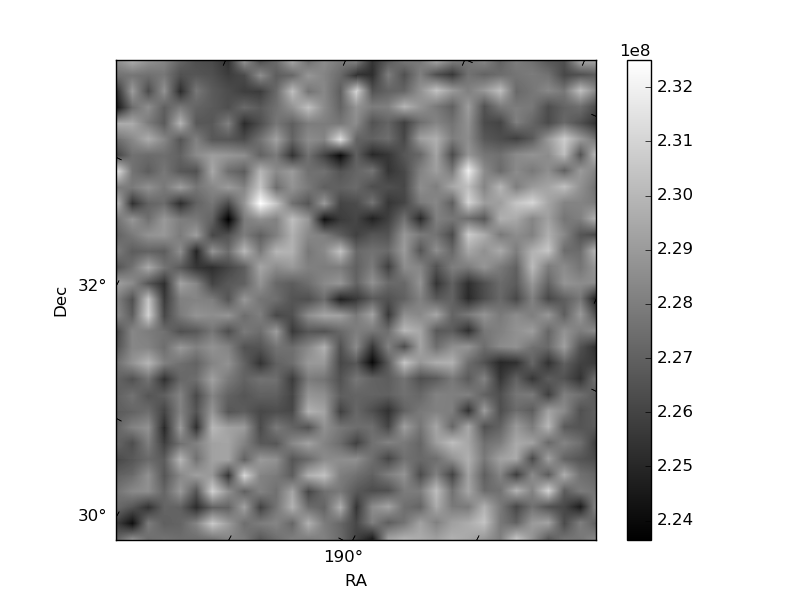
| Quadrant D | 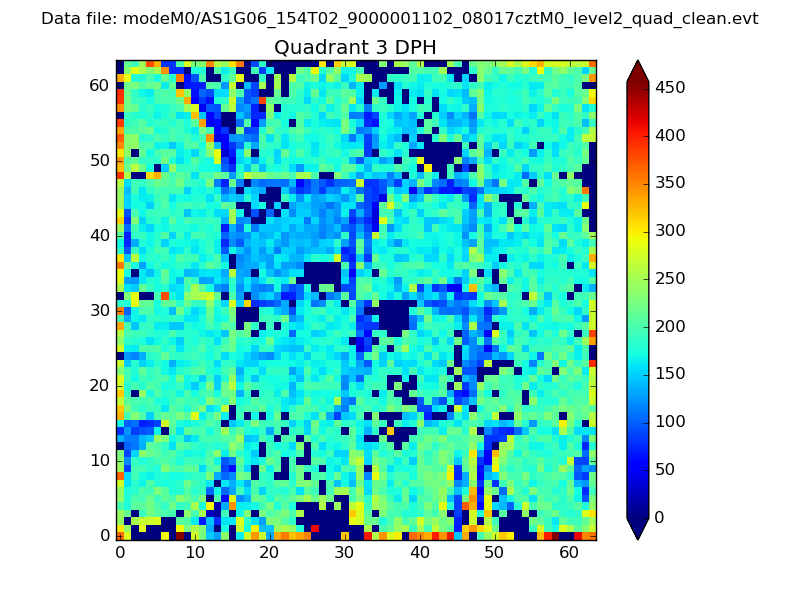 |
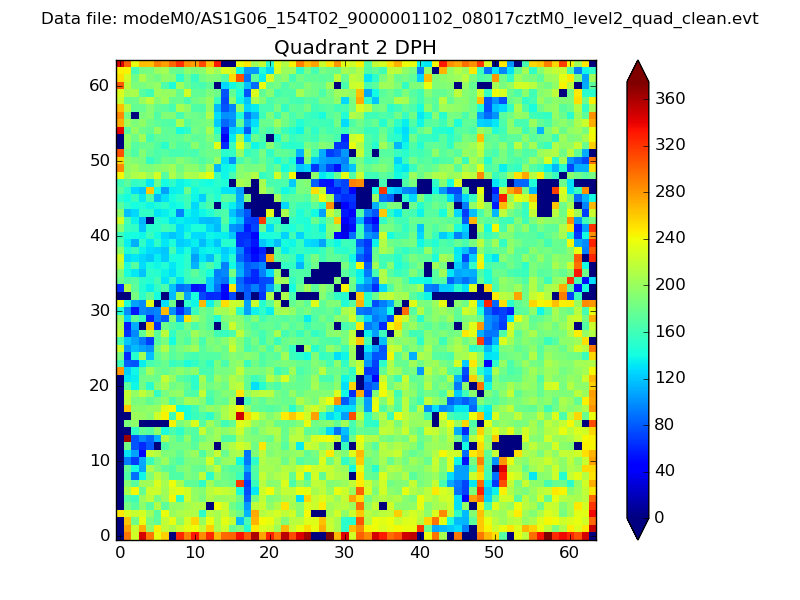 |
Quadrant C |
| Plot type | Count rate plots | Images |
|---|---|---|
| Comparison with Poisson distribution Blue bars denote a histogram of data divided into 1 sec bins. Red curve is a Poisson curve with rate = median count rate of data. |
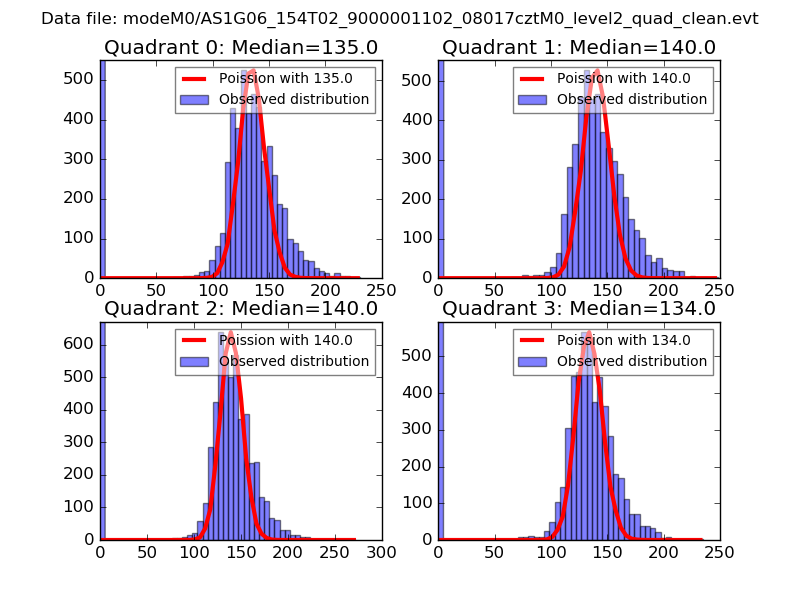 |
 |
| Quadrant-wise count rates Data is divided into 100 sec bins |
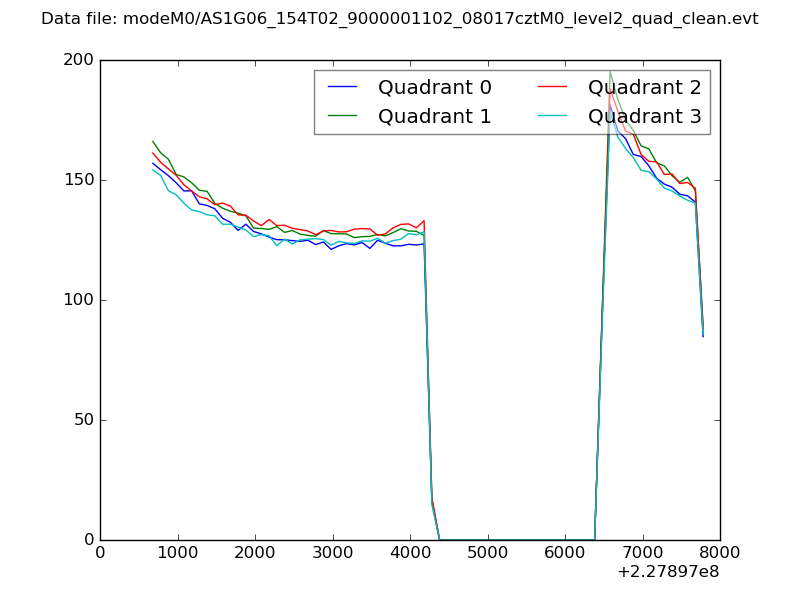 |
|
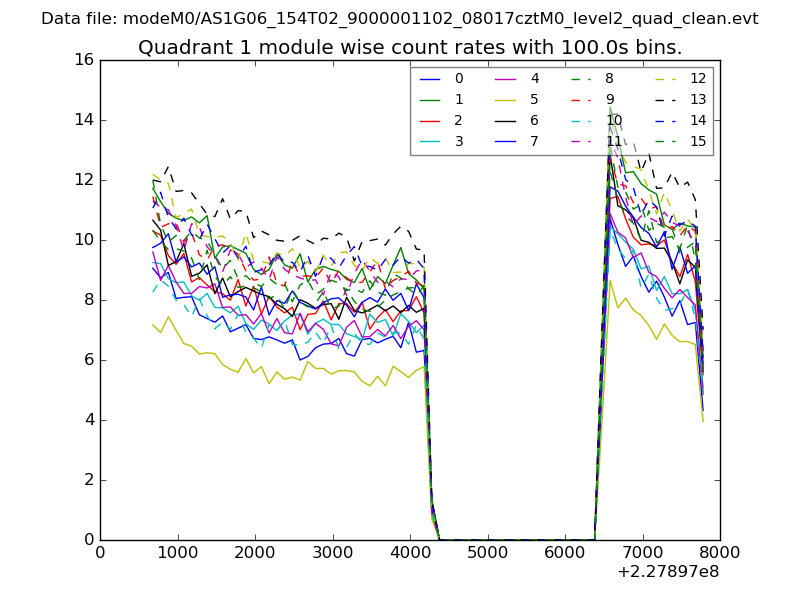
| Module-wise count rates for Quadrant A Data is divided into 100 sec bins |
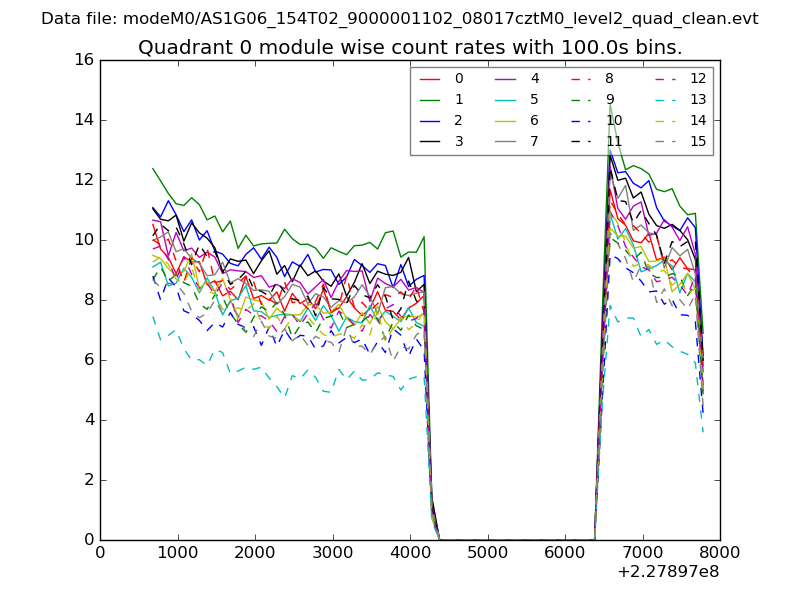 |
 |
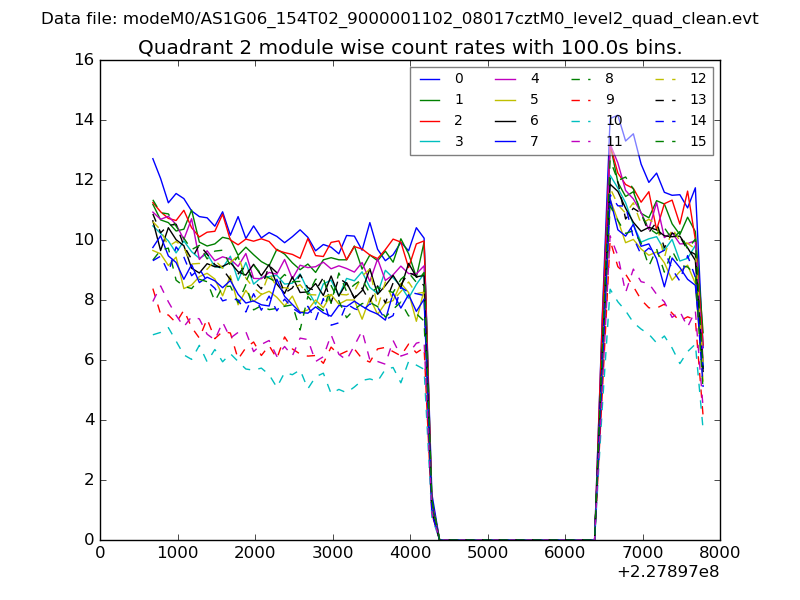
| Module-wise count rates for Quadrant B Data is divided into 100 sec bins |
 |
 |
| Module-wise count rates for Quadrant C Data is divided into 100 sec bins |
 |
 |
| Module-wise count rates for Quadrant D Data is divided into 100 sec bins |
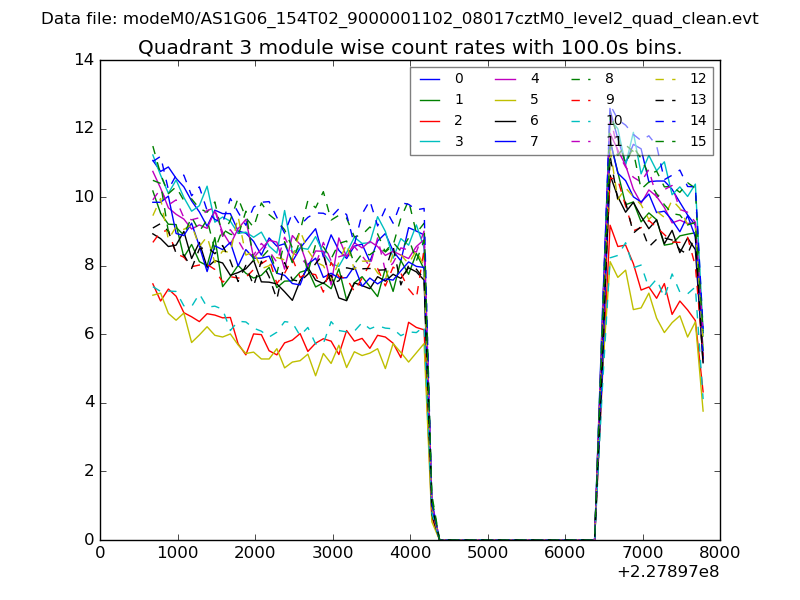 |
 |
| Parameter | Plot |
|---|---|
| CZT HV Monitor | 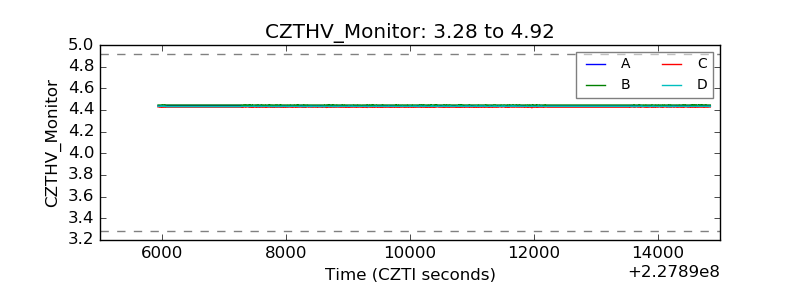 |
| D_VDD | 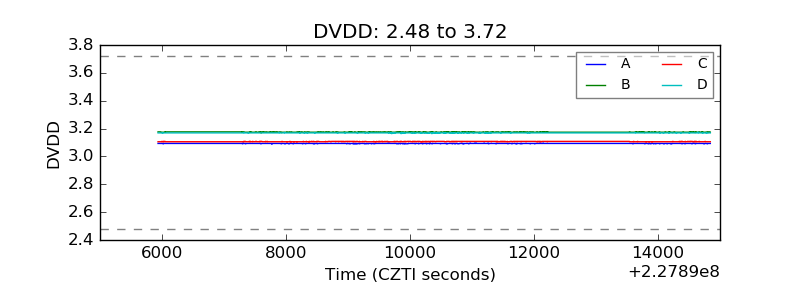 |
| Temperature 1 | 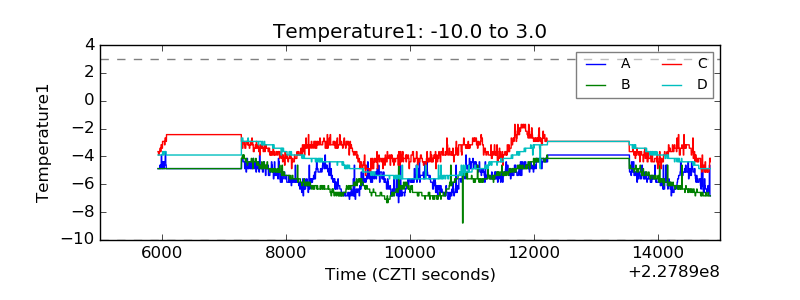 |
| Veto HV Monitor | 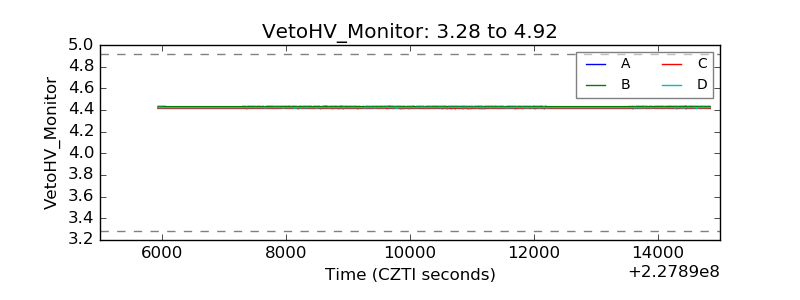 |
| Veto LLD | 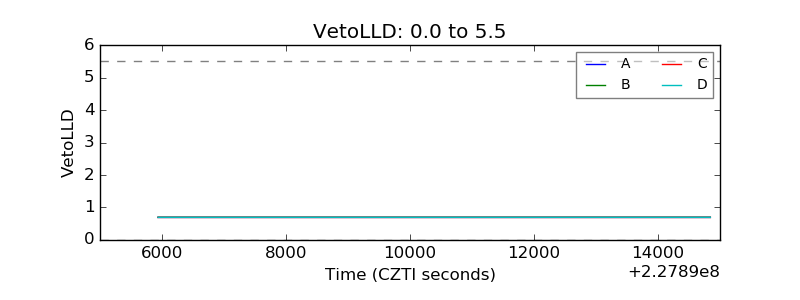 |
| Alpha Counter | 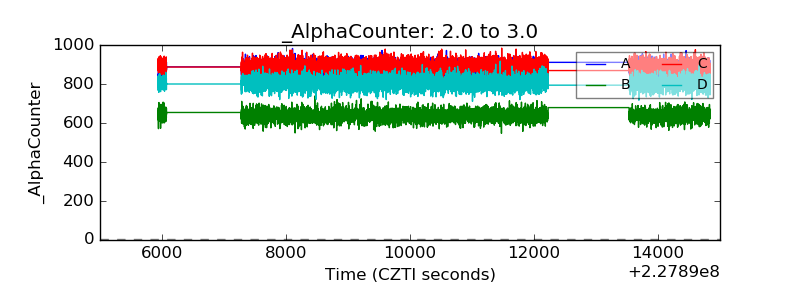 |
| _CPM_Rate | 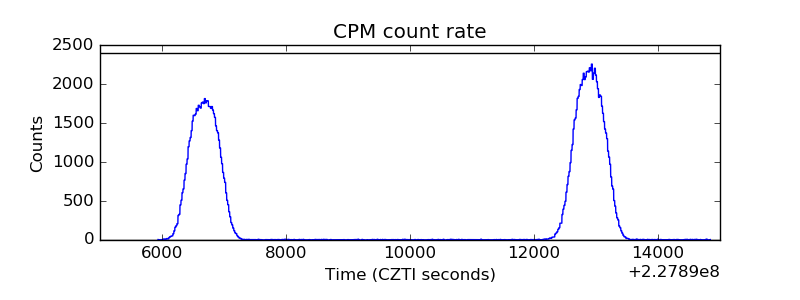 |
| CZT Counter | 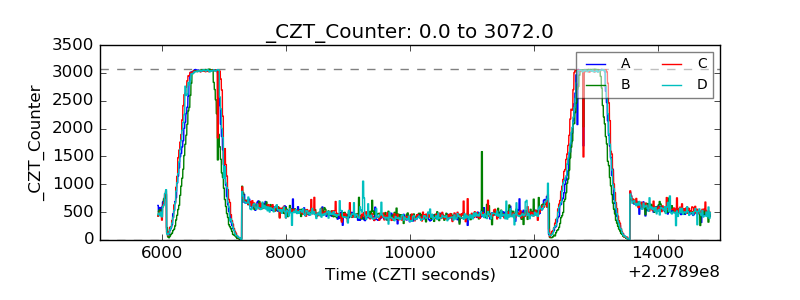 |
| +2.5 Volts monitor |  |
| +5 Volts monitor |  |
| _ROLL_ROT | 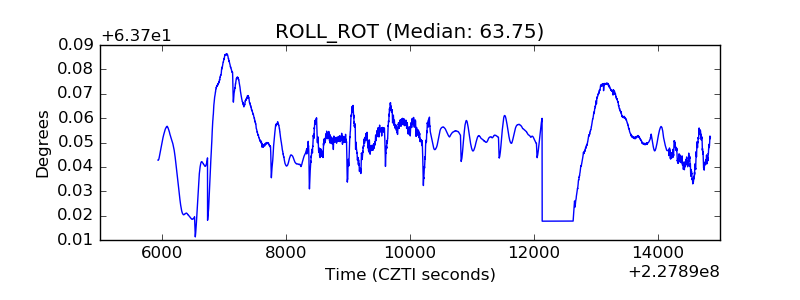 |
| _Roll_DEC | 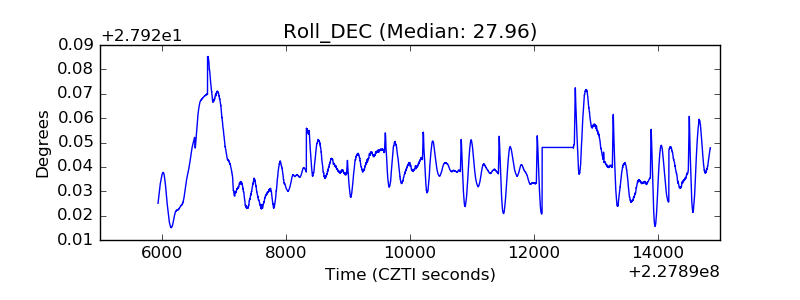 |
| _Roll_RA |  |
| Veto Counter | 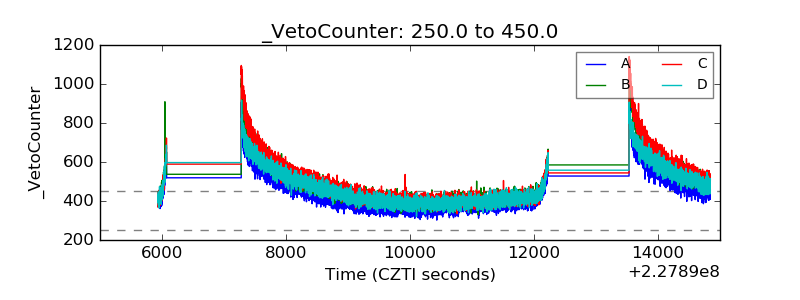 |