| Param | Original file | Final file |
|---|---|---|
| Filename | modeM0/AS1G06_154T02_9000001102_08018cztM0_level2.evt | modeM0/AS1G06_154T02_9000001102_08018cztM0_level2_quad_clean.evt |
| Size (bytes) | 425,448,000 | 107,133,120 |
| Size | 405.7 MB | 102.2 MB |
| Events in quadrant A | 3,011,626 | 689,657 |
| Events in quadrant B | 3,170,378 | 719,791 |
| Events in quadrant C | 3,093,990 | 719,088 |
| Events in quadrant D | 3,189,149 | 685,339 |
| Mode M0 | |||
|---|---|---|---|
| Quadrant | BADHDUFLAG | Total packets | Discarded packets |
| A | 0 | 13002 | 3 |
| B | 0 | 13379 | 2 |
| C | 0 | 13214 | 2 |
| D | 0 | 13600 | 2 |
| Mode SS | |||
|---|---|---|---|
| Quadrant | BADHDUFLAG | Total packets | Discarded packets |
| A | 0 | 126 | 0 |
| B | 0 | 126 | 0 |
| C | 0 | 126 | 0 |
| D | 0 | 126 | 0 |
| Mode M9 | |||
|---|---|---|---|
| Quadrant | BADHDUFLAG | Total packets | Discarded packets |
| A | 0 | 21 | 0 |
| B | 0 | 21 | 0 |
| C | 0 | 21 | 0 |
| D | 0 | 22 | 0 |
| Quadrant | Total seconds | Saturated seconds | Saturation percentage |
|---|---|---|---|
| A | 6171 | 27 | 0.437530% |
| B | 6171 | 52 | 0.842651% |
| C | 6171 | 34 | 0.550964% |
| D | 6171 | 52 | 0.842651% |
Noise dominated data is calculated using 1-second bins in cleaned event files. If a bin has >2000 counts, and if more than 50% of those come from <1% of pixels, then it is considered to be noise-dominated and hence unusable.
| Quadrant | # 1 sec bins | Bins with >0 counts | Bins with >2000 counts | High rate bins dominated by noise | Noise dominated (total time) | Noise dominated (detector-on time) | Marked lightcurve |
|---|---|---|---|---|---|---|---|
| A | 7516 | 6172 | 0 | 0 | 0.00% | 0.00% |  |
| B | 7516 | 6172 | 3 | 3 | 0.04% | 0.05% |  |
| C | 7516 | 6172 | 0 | 0 | 0.00% | 0.00% | 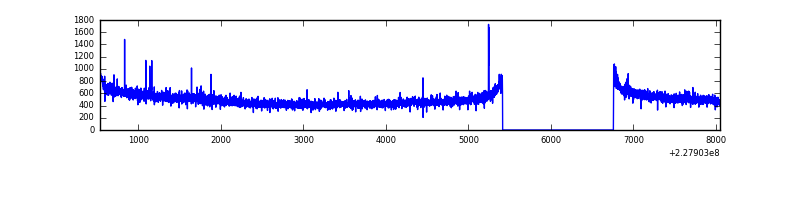 |
| D | 7516 | 6172 | 31 | 31 | 0.41% | 0.50% | 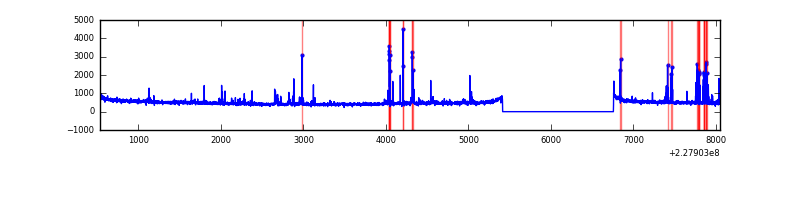 |
Top three noisy pixels from each quadrant. If the there are fewer than three noisy pixels in the level2.evt file, extra rows are filled as -1
| Pixel properties | Quadrant properties | ||||||
|---|---|---|---|---|---|---|---|
| Quadrant | DetID | PixID | Counts | Sigma | Mean | Median | Sigma |
| A | 0 | 226 | 7252 | 41.1 | 781 | 764 | 157.9 |
| A | 12 | 194 | 6484 | 36.23 | 781 | 764 | 157.9 |
| A | 13 | 254 | 3110 | 14.86 | 781 | 764 | 157.9 |
| B | 5 | 250 | 61296 | 402.06 | 795 | 776 | 150.5 |
| B | 5 | 255 | 27374 | 176.7 | 795 | 776 | 150.5 |
| B | 12 | 111 | 16206 | 102.51 | 795 | 776 | 150.5 |
| C | 12 | 4 | 11735 | 60.86 | 786 | 794 | 179.8 |
| C | 1 | 16 | 10828 | 55.81 | 786 | 794 | 179.8 |
| C | 13 | 61 | 5805 | 27.87 | 786 | 794 | 179.8 |
| D | 1 | 52 | 153099 | 826.2 | 774 | 756 | 184.4 |
| D | 2 | 136 | 55794 | 298.49 | 774 | 756 | 184.4 |
| D | 14 | 34 | 31841 | 168.58 | 774 | 756 | 184.4 |
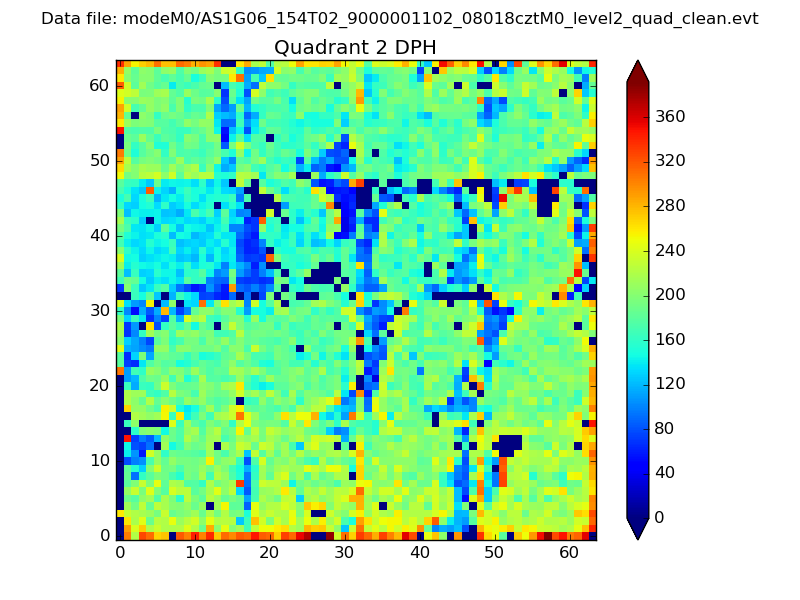
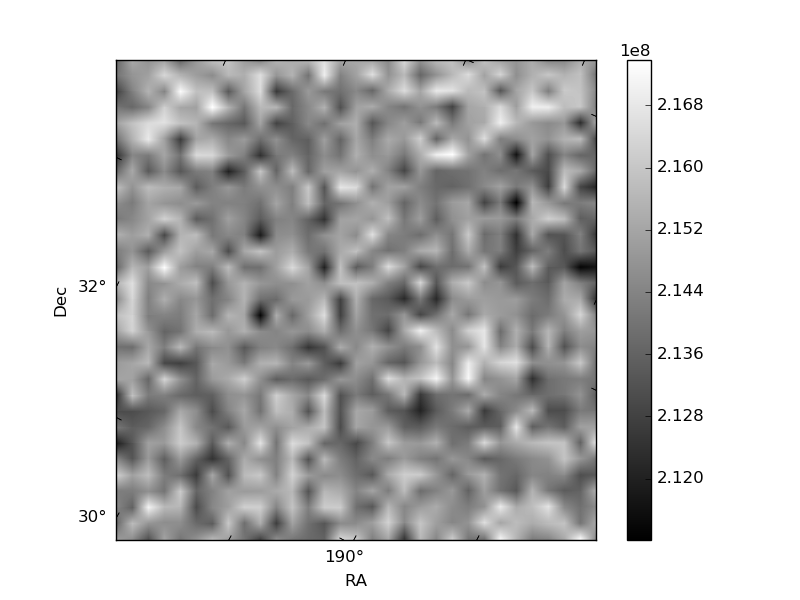
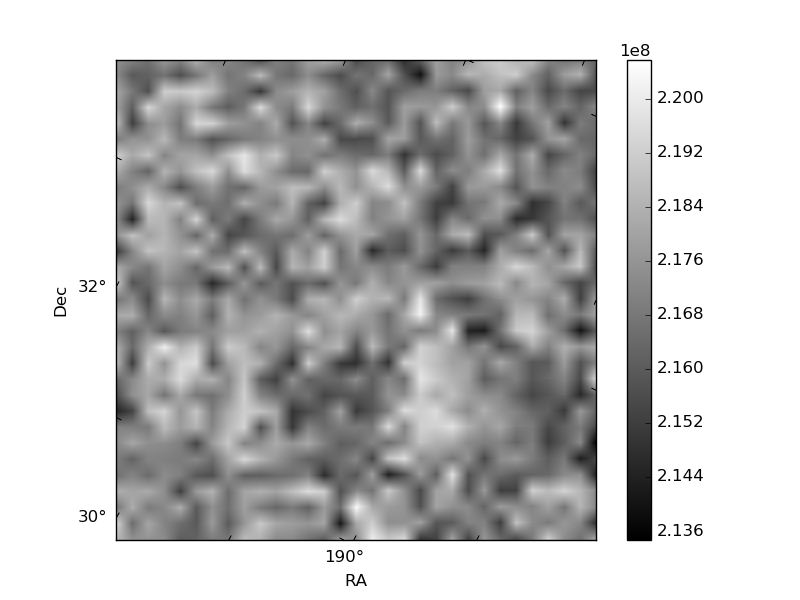
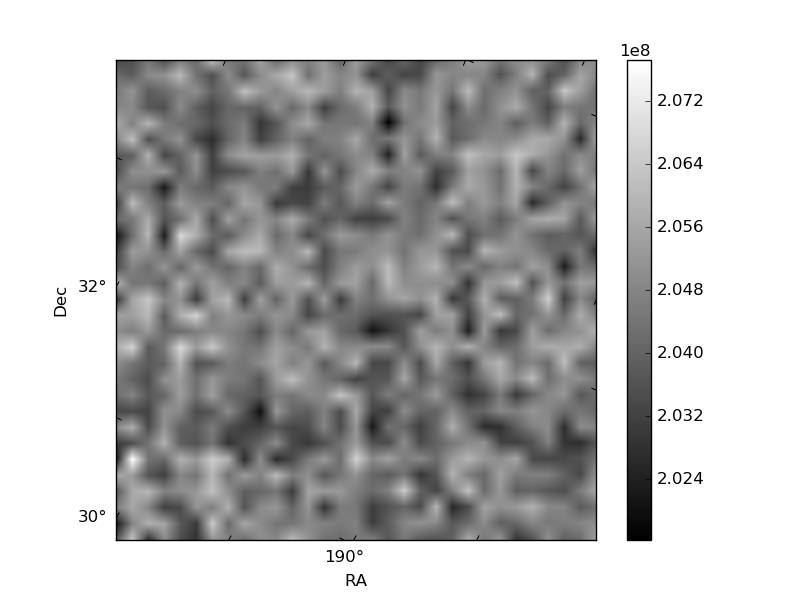
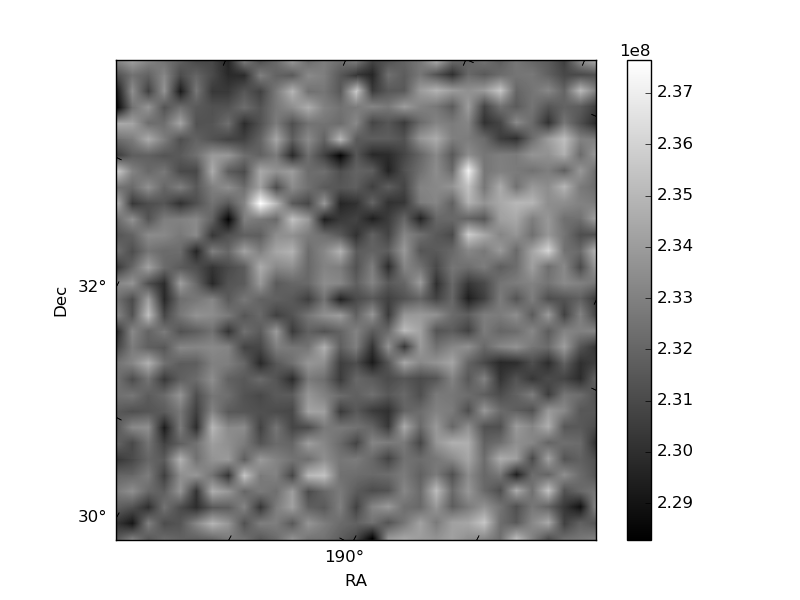
Histogram calculated using DETX and DETY for each event in the final _common_clean file
| Quadrant A | 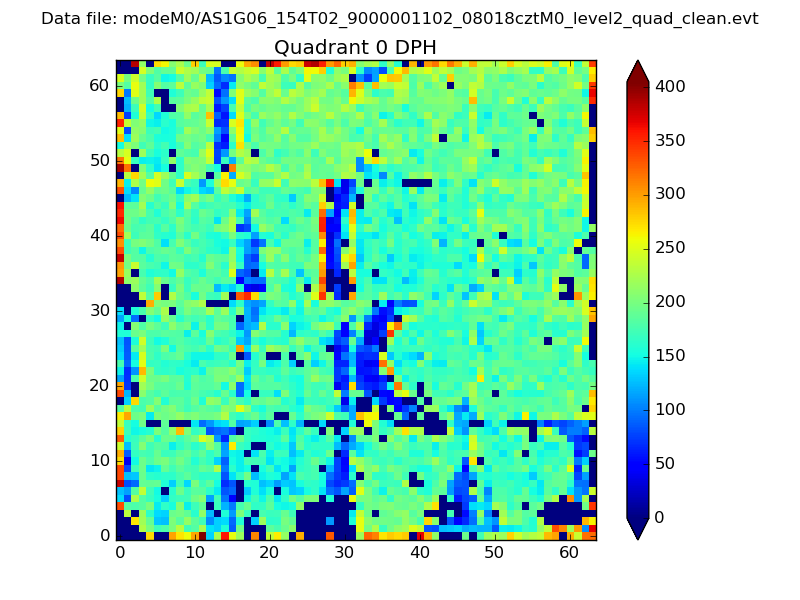 |
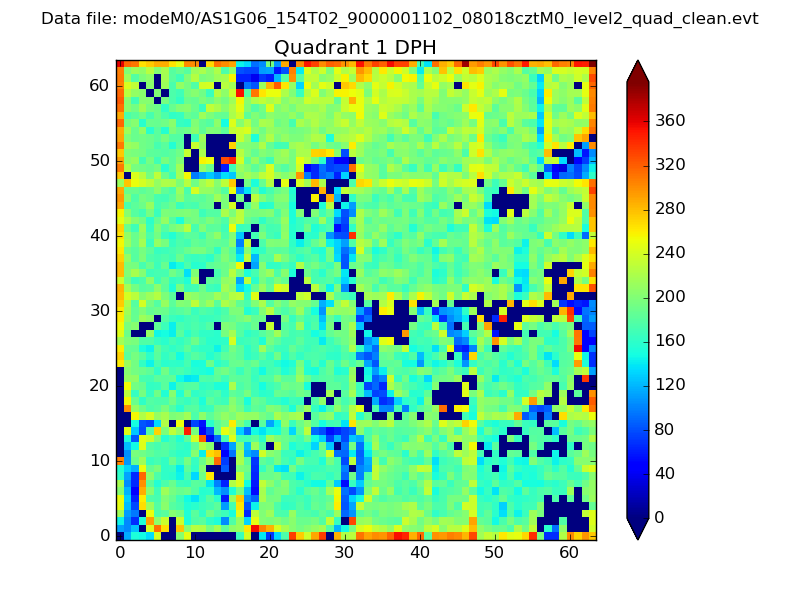 |
Quadrant B |
|---|---|---|---|
| Quadrant D | 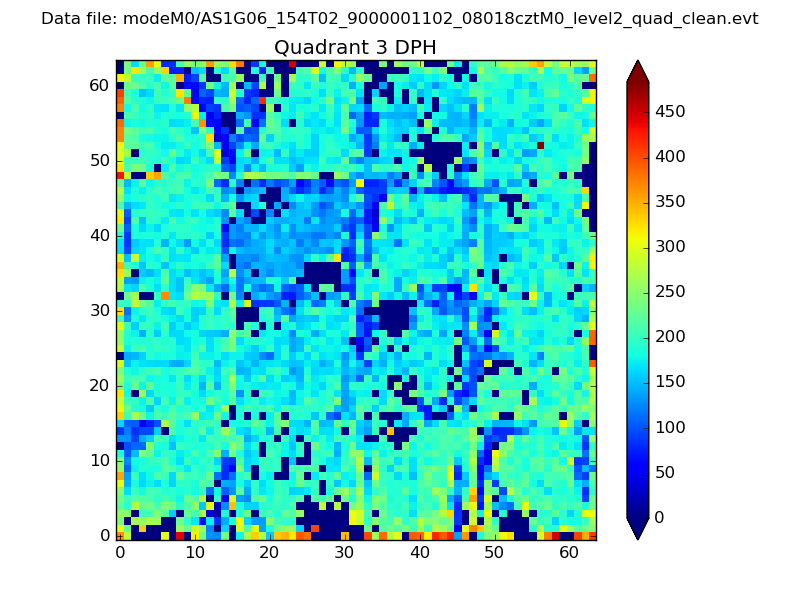 |
 |
Quadrant C |
| Plot type | Count rate plots | Images |
|---|---|---|
| Comparison with Poisson distribution Blue bars denote a histogram of data divided into 1 sec bins. Red curve is a Poisson curve with rate = median count rate of data. |
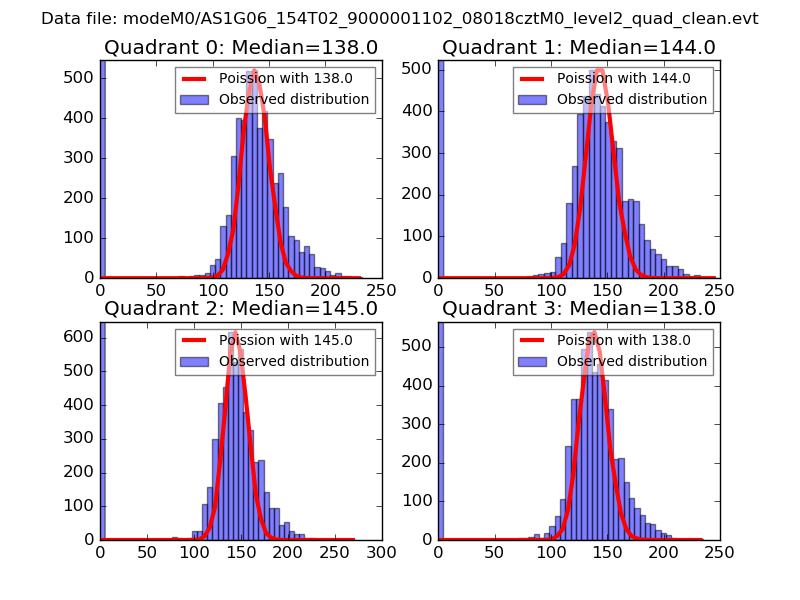 |
 |
| Quadrant-wise count rates Data is divided into 100 sec bins |
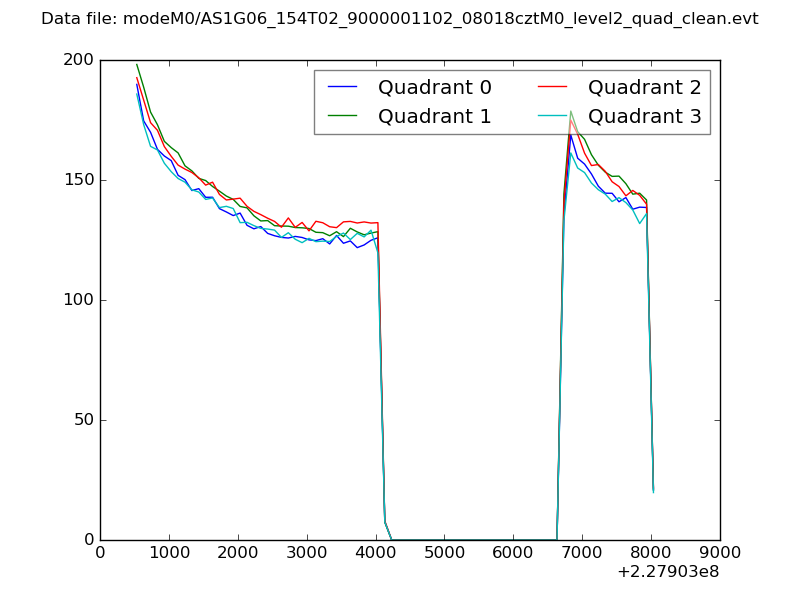 |
|
| Module-wise count rates for Quadrant A Data is divided into 100 sec bins |
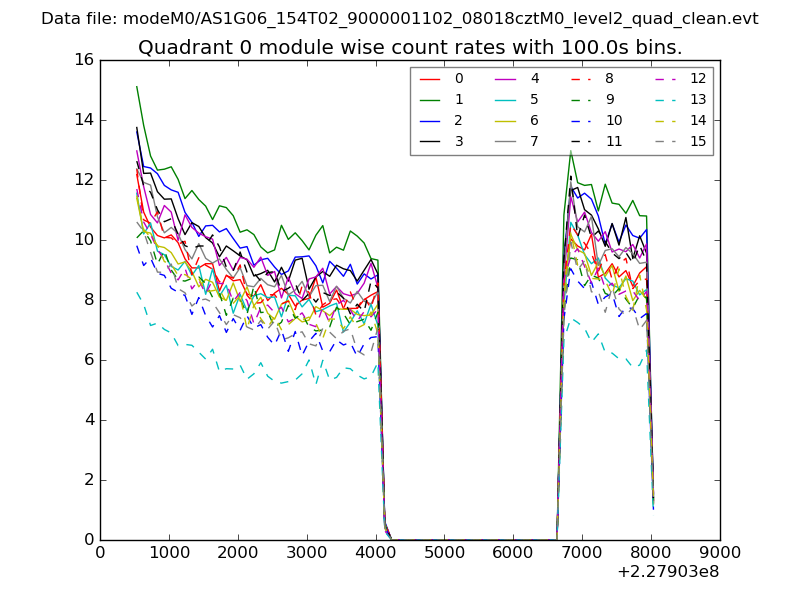 |
 |
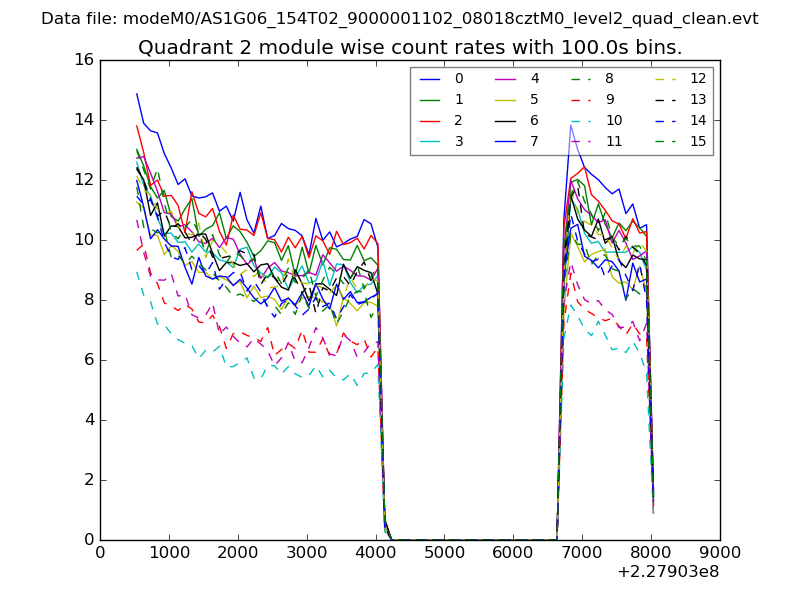
| Module-wise count rates for Quadrant B Data is divided into 100 sec bins |
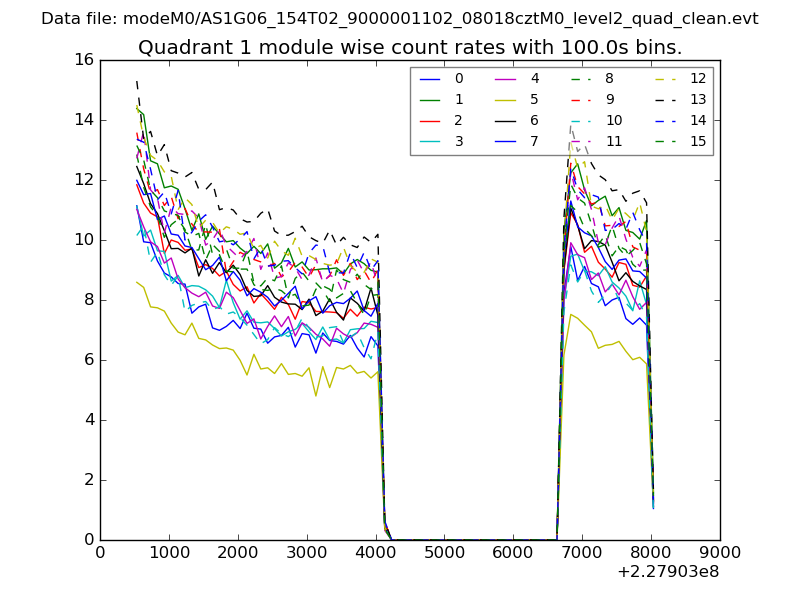 |
 |
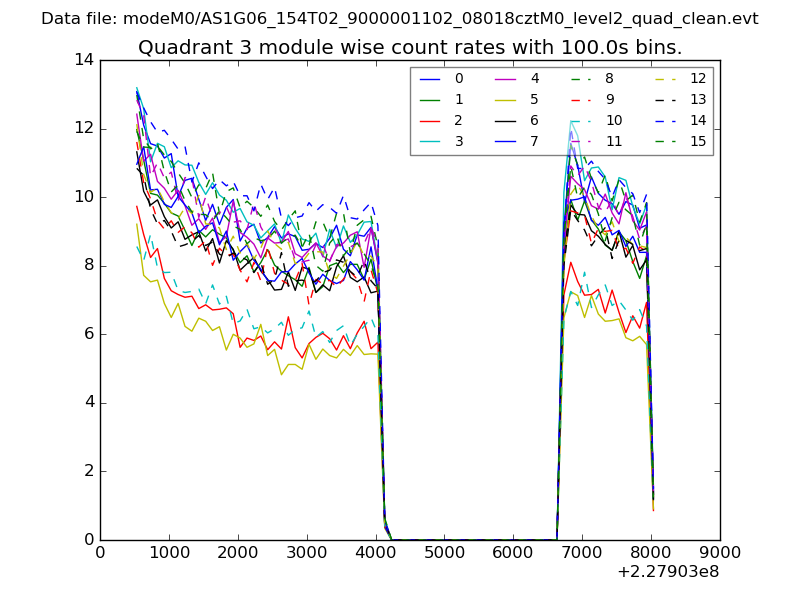
| Module-wise count rates for Quadrant C Data is divided into 100 sec bins |
 |
 |
| Module-wise count rates for Quadrant D Data is divided into 100 sec bins |
 |
 |
| Parameter | Plot |
|---|---|
| CZT HV Monitor | 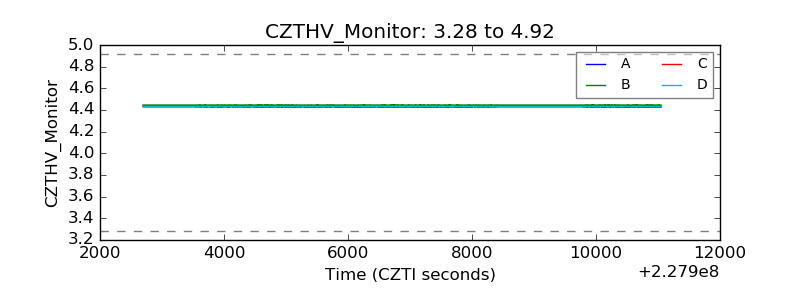 |
| D_VDD |  |
| Temperature 1 | 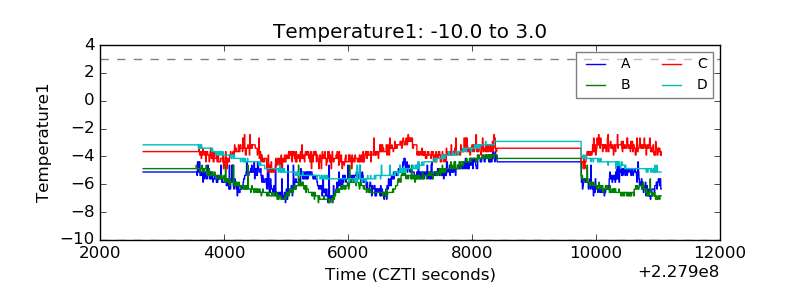 |
| Veto HV Monitor | 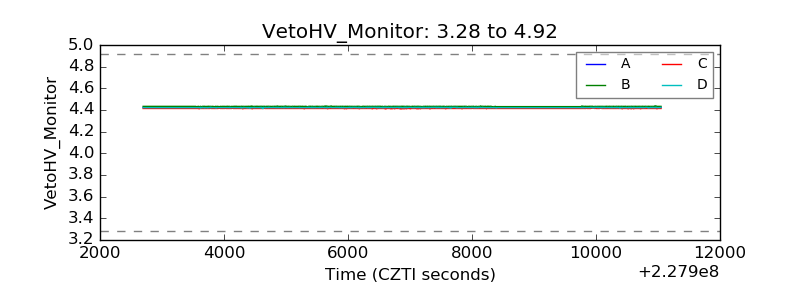 |
| Veto LLD | 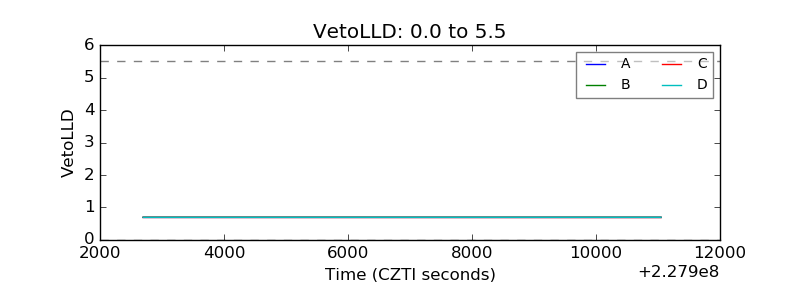 |
| Alpha Counter | 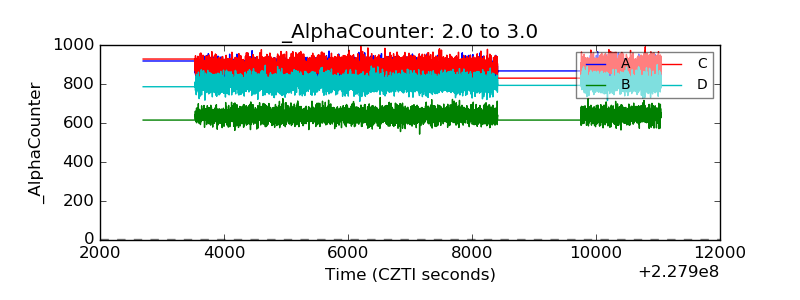 |
| _CPM_Rate | 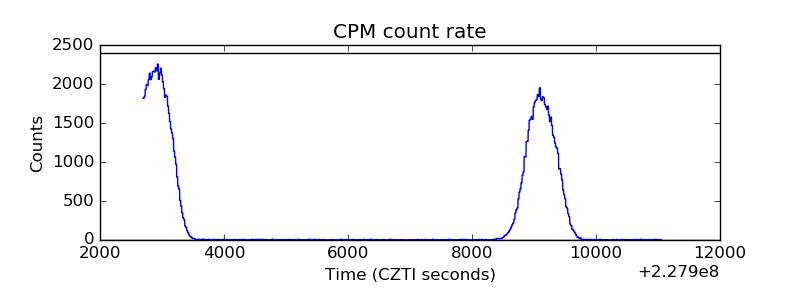 |
| CZT Counter | 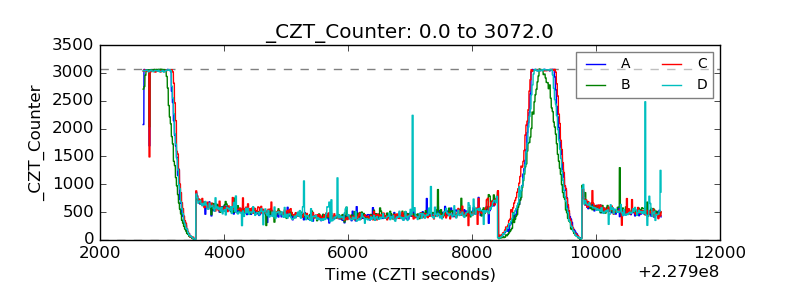 |
| +2.5 Volts monitor |  |
| +5 Volts monitor |  |
| _ROLL_ROT | 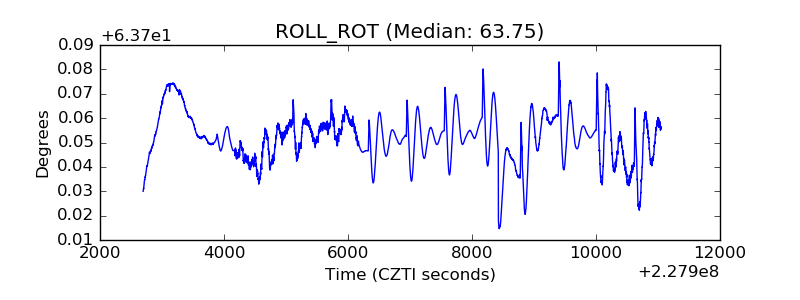 |
| _Roll_DEC | 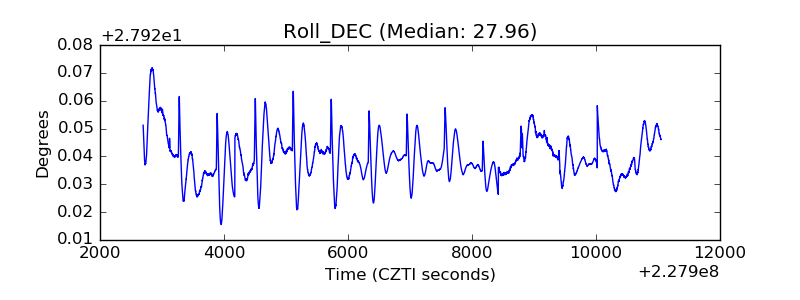 |
| _Roll_RA | 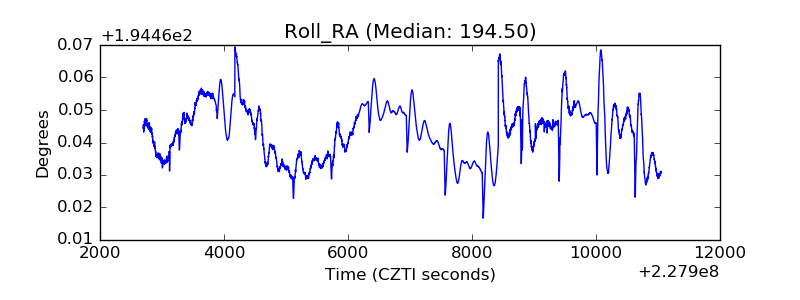 |
| Veto Counter | 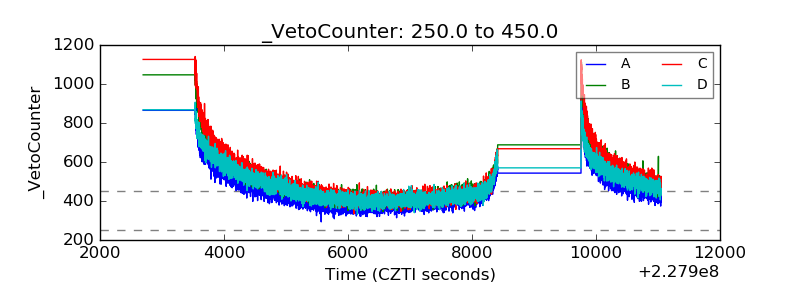 |