| Param | Original file | Final file |
|---|---|---|
| Filename | modeM0/AS1G06_154T02_9000001102_08020cztM0_level2.evt | modeM0/AS1G06_154T02_9000001102_08020cztM0_level2_quad_clean.evt |
| Size (bytes) | 408,412,800 | 84,833,280 |
| Size | 389.5 MB | 80.9 MB |
| Events in quadrant A | 2,928,480 | 522,531 |
| Events in quadrant B | 3,048,764 | 542,959 |
| Events in quadrant C | 2,977,708 | 543,683 |
| Events in quadrant D | 2,983,876 | 518,803 |
| Mode M0 | |||
|---|---|---|---|
| Quadrant | BADHDUFLAG | Total packets | Discarded packets |
| A | 0 | 13091 | 3 |
| B | 0 | 13386 | 2 |
| C | 0 | 13145 | 2 |
| D | 0 | 13433 | 2 |
| Mode SS | |||
|---|---|---|---|
| Quadrant | BADHDUFLAG | Total packets | Discarded packets |
| A | 0 | 128 | 0 |
| B | 0 | 128 | 0 |
| C | 0 | 128 | 0 |
| D | 0 | 128 | 0 |
| Mode M9 | |||
|---|---|---|---|
| Quadrant | BADHDUFLAG | Total packets | Discarded packets |
| A | 0 | 18 | 0 |
| B | 0 | 18 | 0 |
| C | 0 | 18 | 0 |
| D | 0 | 19 | 0 |
| Quadrant | Total seconds | Saturated seconds | Saturation percentage |
|---|---|---|---|
| A | 6320 | 26 | 0.411392% |
| B | 6320 | 42 | 0.664557% |
| C | 6320 | 26 | 0.411392% |
| D | 6320 | 32 | 0.506329% |
Noise dominated data is calculated using 1-second bins in cleaned event files. If a bin has >2000 counts, and if more than 50% of those come from <1% of pixels, then it is considered to be noise-dominated and hence unusable.
| Quadrant | # 1 sec bins | Bins with >0 counts | Bins with >2000 counts | High rate bins dominated by noise | Noise dominated (total time) | Noise dominated (detector-on time) | Marked lightcurve |
|---|---|---|---|---|---|---|---|
| A | 7500 | 6321 | 0 | 0 | 0.00% | 0.00% |  |
| B | 7500 | 6321 | 0 | 0 | 0.00% | 0.00% |  |
| C | 7500 | 6321 | 0 | 0 | 0.00% | 0.00% | 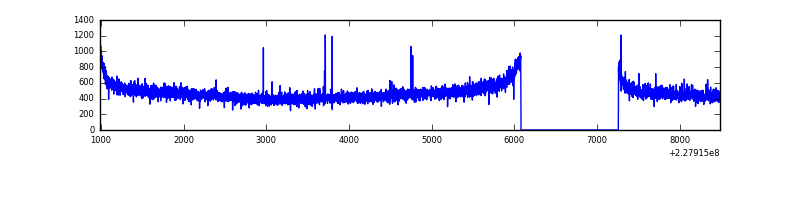 |
| D | 7500 | 6321 | 19 | 19 | 0.25% | 0.30% |  |
Top three noisy pixels from each quadrant. If the there are fewer than three noisy pixels in the level2.evt file, extra rows are filled as -1
| Pixel properties | Quadrant properties | ||||||
|---|---|---|---|---|---|---|---|
| Quadrant | DetID | PixID | Counts | Sigma | Mean | Median | Sigma |
| A | 0 | 226 | 6976 | 39.99 | 761 | 744 | 155.8 |
| A | 12 | 194 | 6728 | 38.4 | 761 | 744 | 155.8 |
| A | 13 | 254 | 3042 | 14.75 | 761 | 744 | 155.8 |
| B | 5 | 250 | 51642 | 343.01 | 772 | 754 | 148.4 |
| B | 12 | 111 | 16324 | 104.95 | 772 | 754 | 148.4 |
| B | 11 | 111 | 13583 | 86.47 | 772 | 754 | 148.4 |
| C | 1 | 16 | 19800 | 107.93 | 756 | 762 | 176.4 |
| C | 13 | 61 | 5796 | 28.54 | 756 | 762 | 176.4 |
| C | 1 | 3 | 3431 | 15.13 | 756 | 762 | 176.4 |
| D | 2 | 14 | 90323 | 501.58 | 743 | 724 | 178.6 |
| D | 2 | 136 | 49769 | 274.56 | 743 | 724 | 178.6 |
| D | 1 | 52 | 33088 | 181.18 | 743 | 724 | 178.6 |
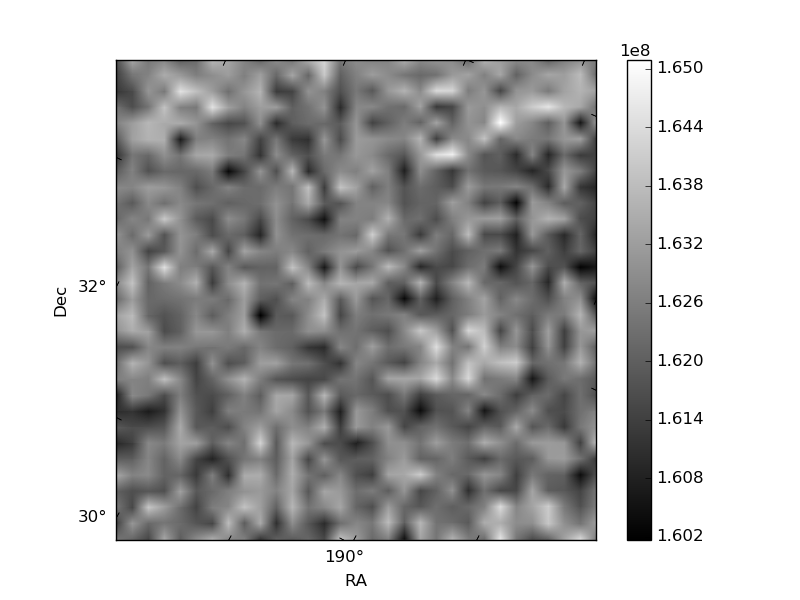
Histogram calculated using DETX and DETY for each event in the final _common_clean file
| Quadrant A | 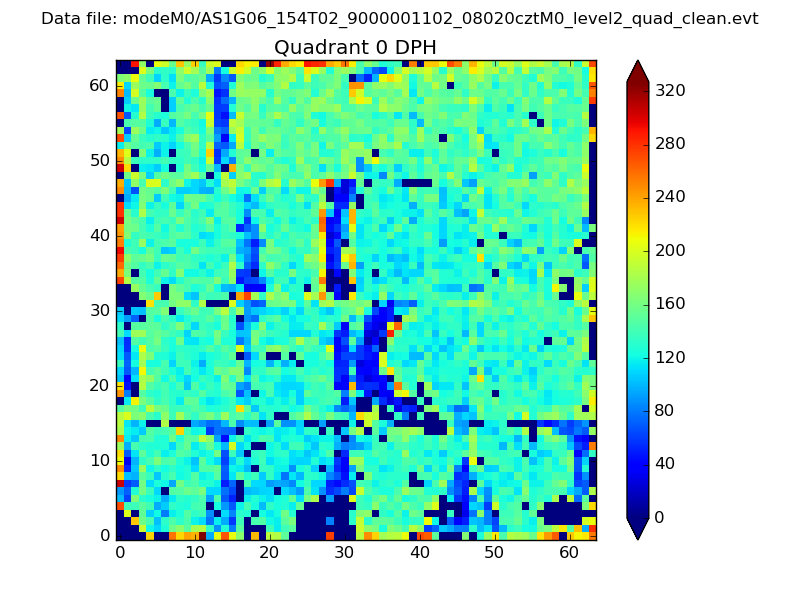 |
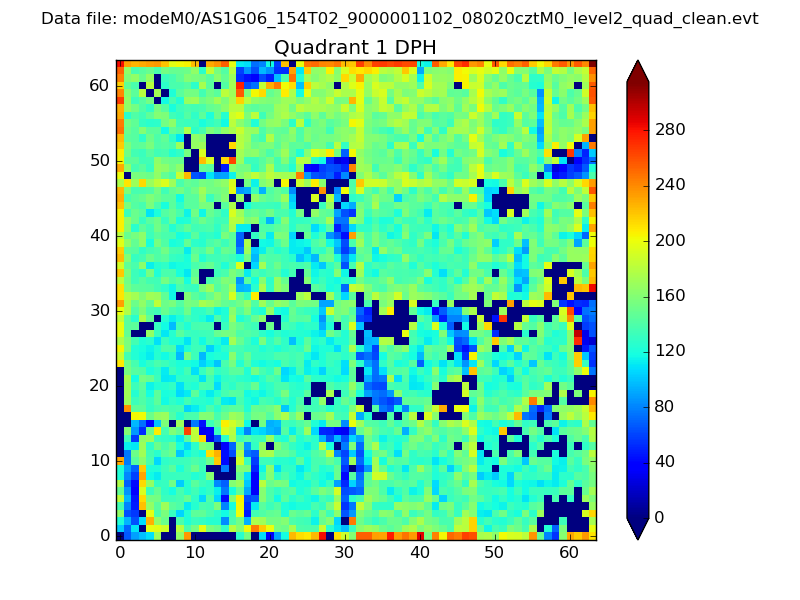 |
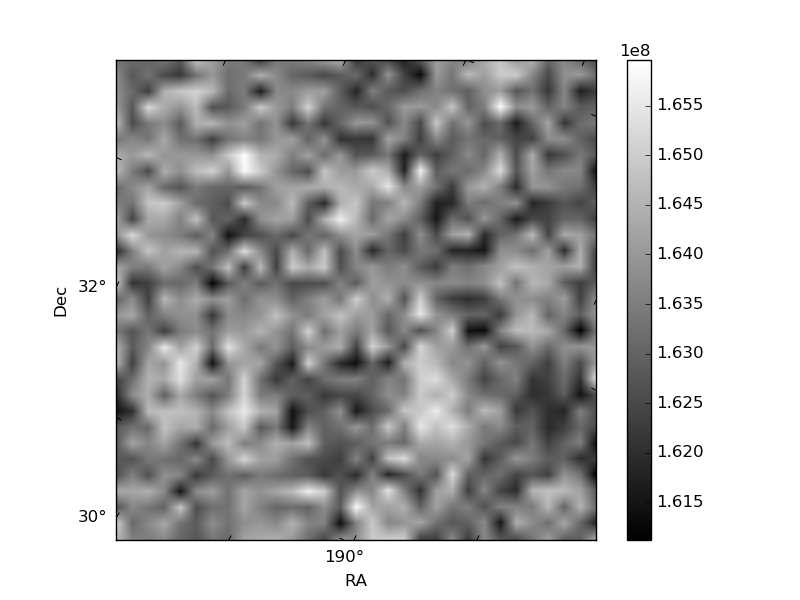
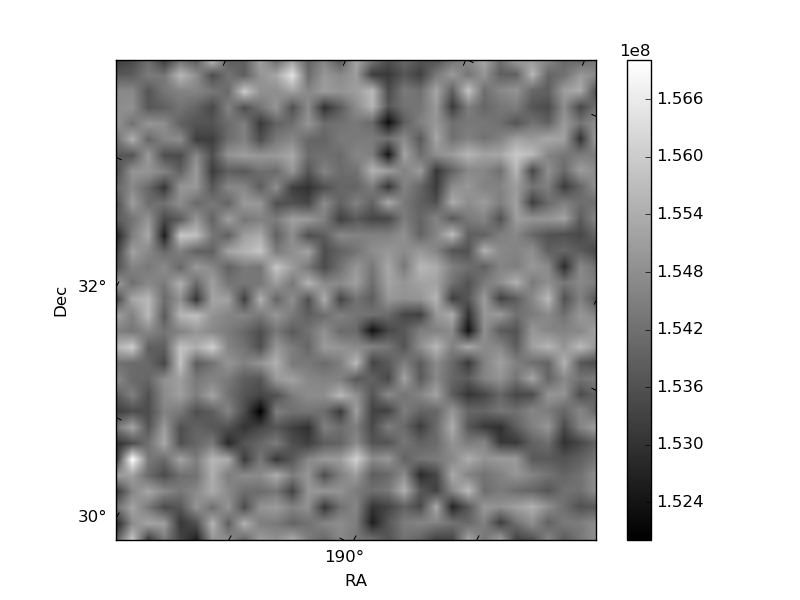
Quadrant B |
|---|---|---|---|
| Quadrant D | 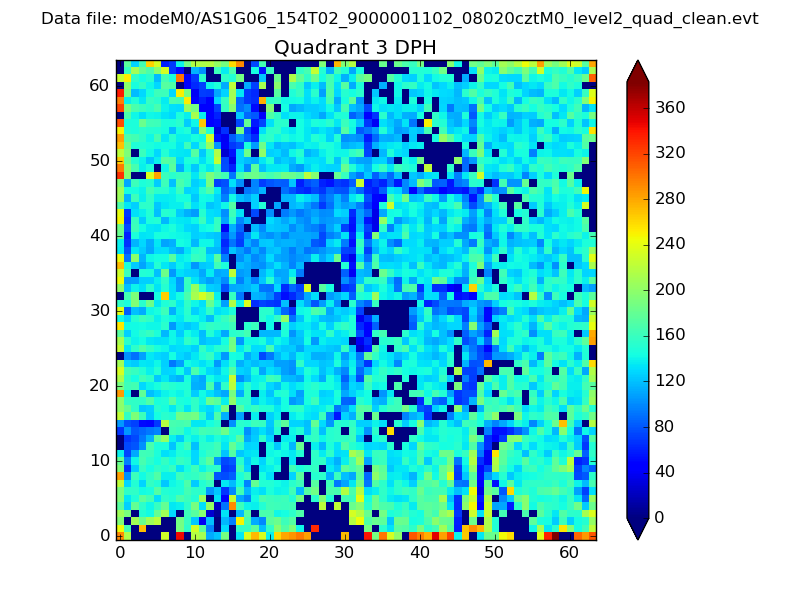 |
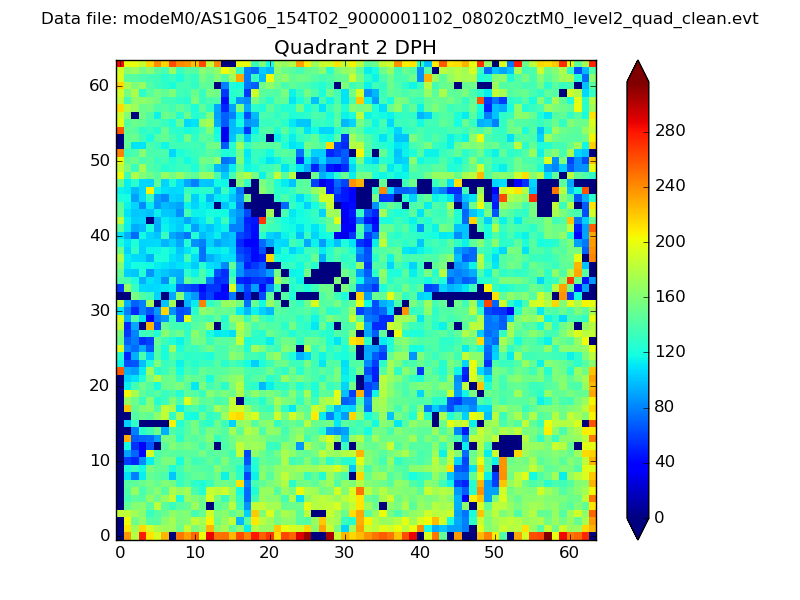 |
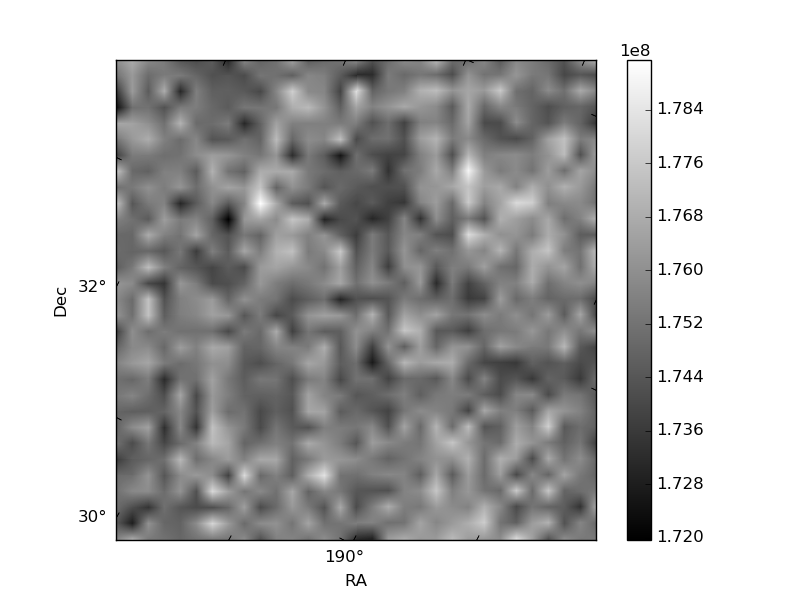
Quadrant C |
| Plot type | Count rate plots | Images |
|---|---|---|
| Comparison with Poisson distribution Blue bars denote a histogram of data divided into 1 sec bins. Red curve is a Poisson curve with rate = median count rate of data. |
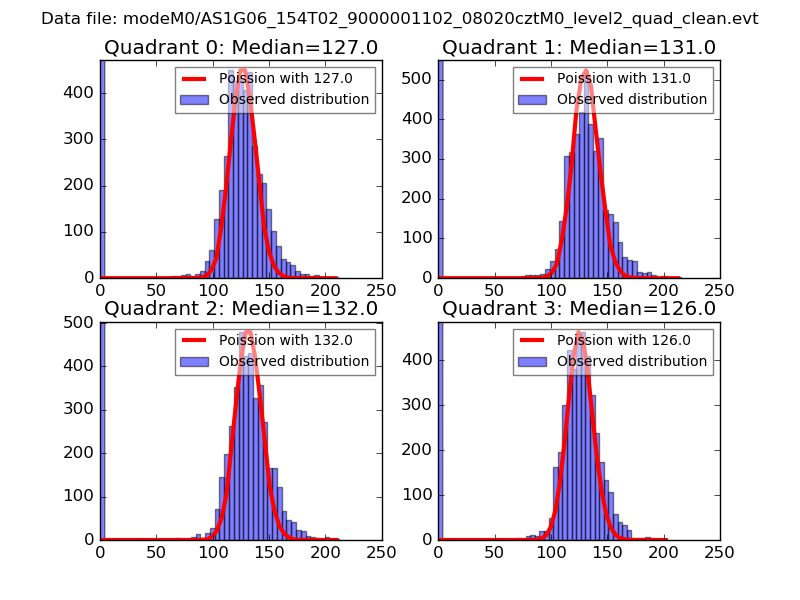 |
 |
| Quadrant-wise count rates Data is divided into 100 sec bins |
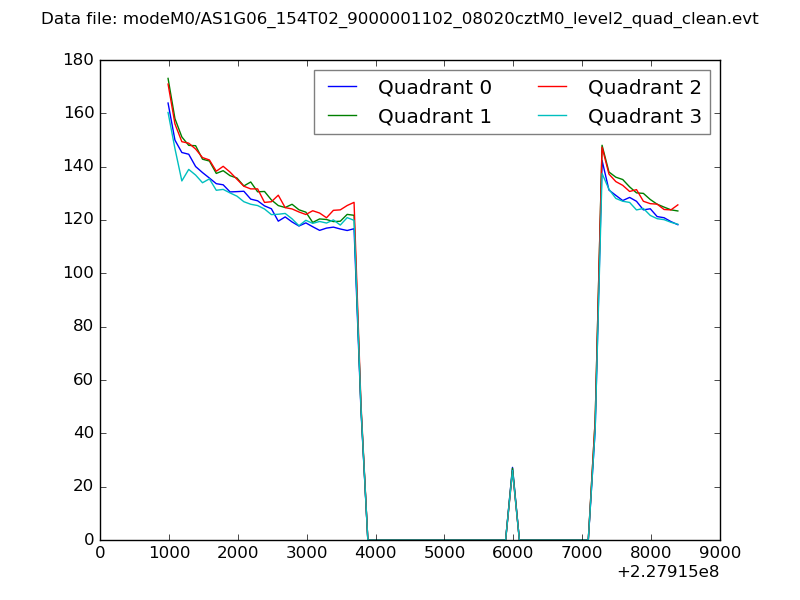 |
|
| Module-wise count rates for Quadrant A Data is divided into 100 sec bins |
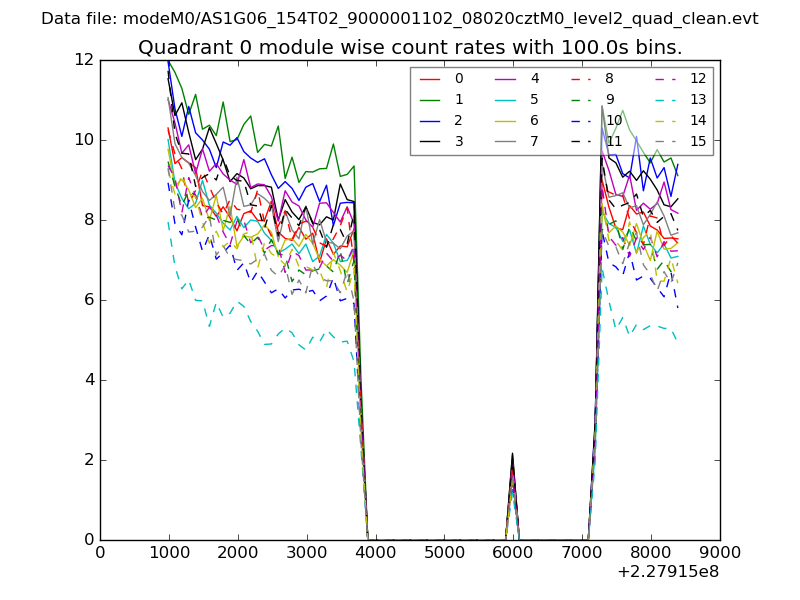 |
 |
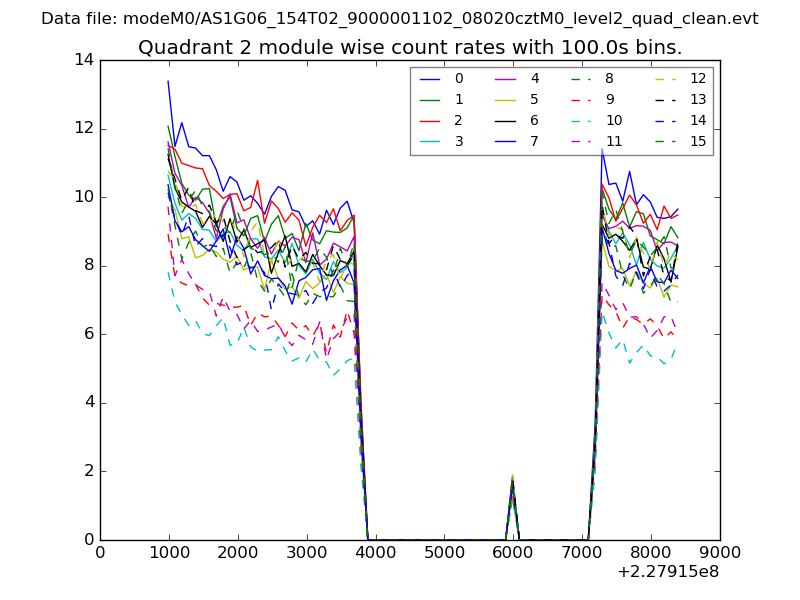
| Module-wise count rates for Quadrant B Data is divided into 100 sec bins |
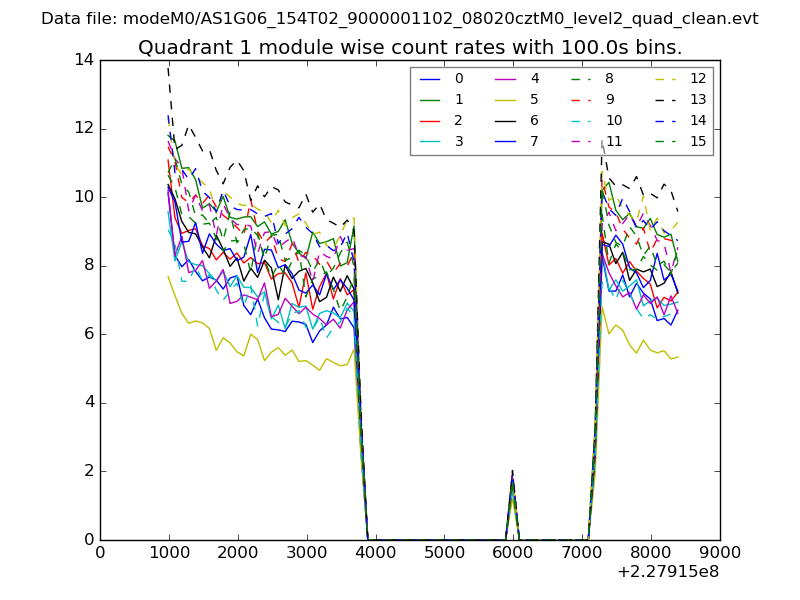 |
 |
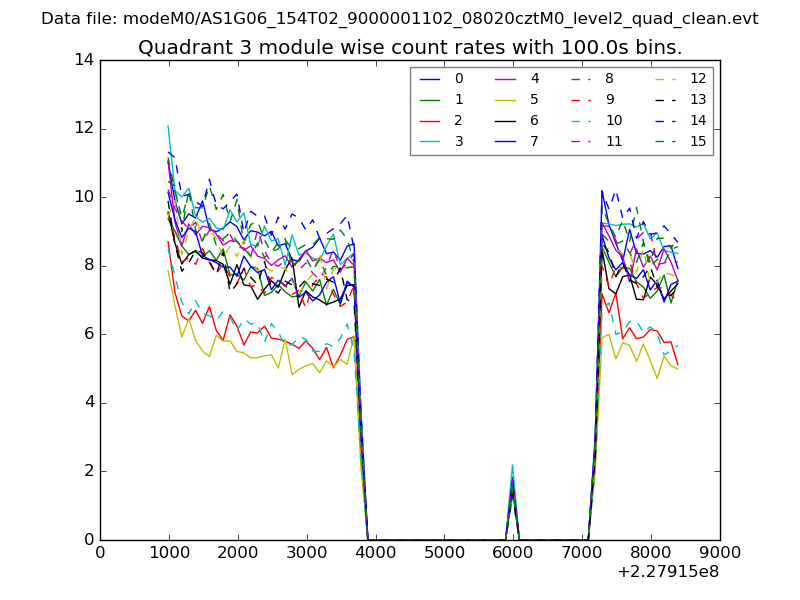
| Module-wise count rates for Quadrant C Data is divided into 100 sec bins |
 |
 |
| Module-wise count rates for Quadrant D Data is divided into 100 sec bins |
 |
 |
| Parameter | Plot |
|---|---|
| CZT HV Monitor | 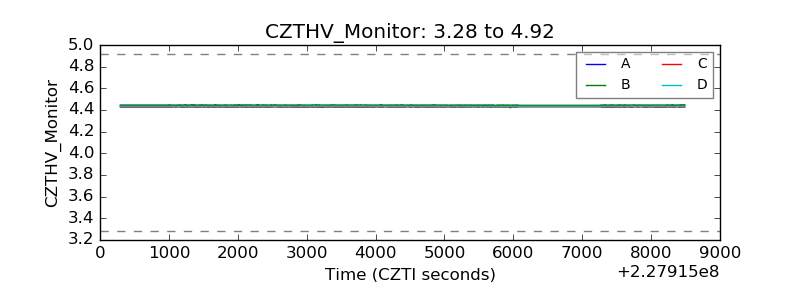 |
| D_VDD | 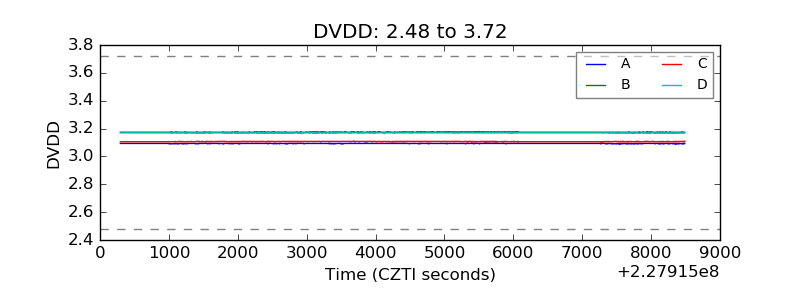 |
| Temperature 1 | 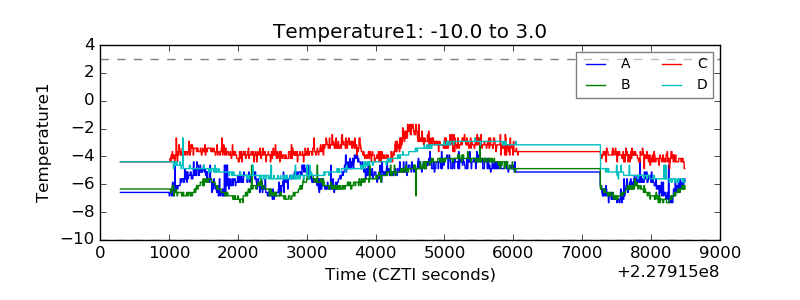 |
| Veto HV Monitor | 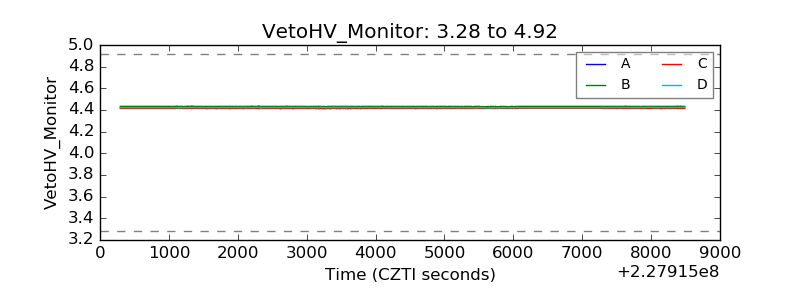 |
| Veto LLD | 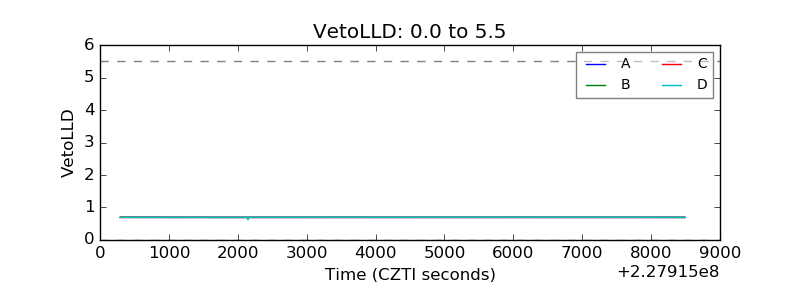 |
| Alpha Counter | 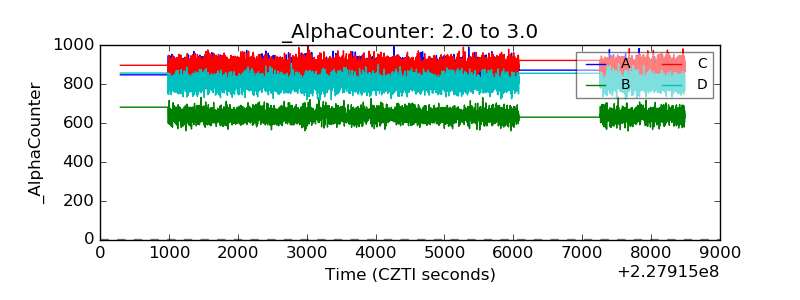 |
| _CPM_Rate | 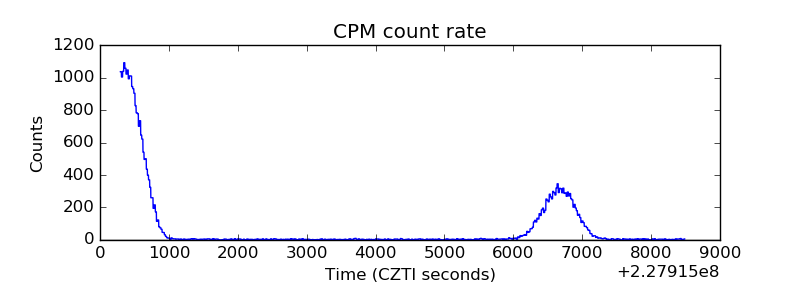 |
| CZT Counter | 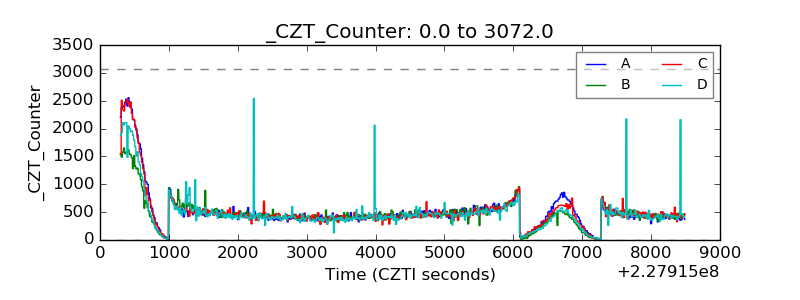 |
| +2.5 Volts monitor |  |
| +5 Volts monitor |  |
| _ROLL_ROT | 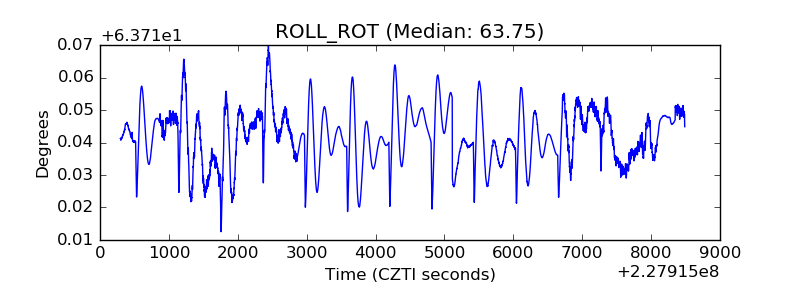 |
| _Roll_DEC | 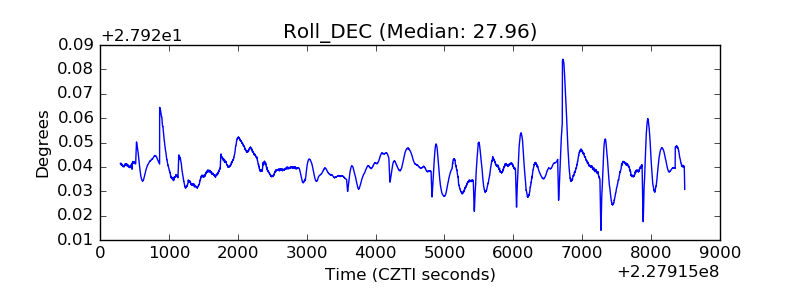 |
| _Roll_RA | 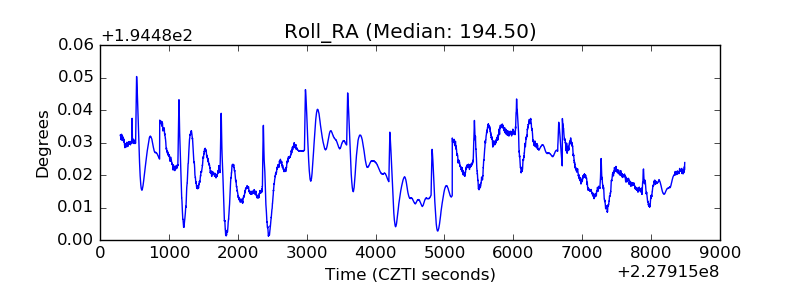 |
| Veto Counter | 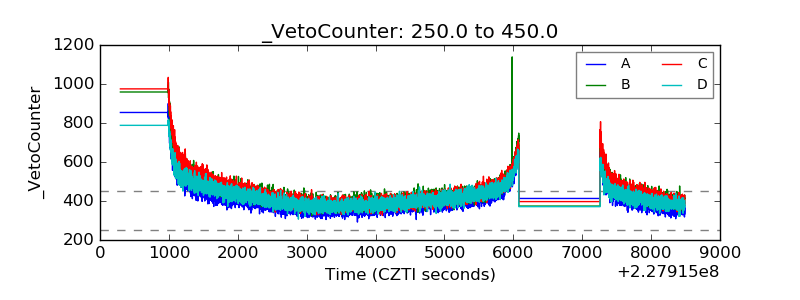 |