| Param | Original file | Final file |
|---|---|---|
| Filename | modeM0/AS1G06_154T02_9000001102_08023cztM0_level2.evt | modeM0/AS1G06_154T02_9000001102_08023cztM0_level2_quad_clean.evt |
| Size (bytes) | 492,624,000 | 99,527,040 |
| Size | 469.8 MB | 94.9 MB |
| Events in quadrant A | 3,472,331 | 613,407 |
| Events in quadrant B | 3,603,583 | 630,401 |
| Events in quadrant C | 3,445,107 | 631,138 |
| Events in quadrant D | 3,874,906 | 603,858 |
| Mode M0 | |||
|---|---|---|---|
| Quadrant | BADHDUFLAG | Total packets | Discarded packets |
| A | 0 | 15778 | 1 |
| B | 0 | 15917 | 0 |
| C | 0 | 15752 | 0 |
| D | 0 | 17226 | 0 |
| Mode SS | |||
|---|---|---|---|
| Quadrant | BADHDUFLAG | Total packets | Discarded packets |
| A | 0 | 154 | 0 |
| B | 0 | 154 | 0 |
| C | 0 | 154 | 0 |
| D | 0 | 154 | 0 |
| Quadrant | Total seconds | Saturated seconds | Saturation percentage |
|---|---|---|---|
| A | 7696 | 90 | 1.169439% |
| B | 7696 | 136 | 1.767152% |
| C | 7696 | 23 | 0.298857% |
| D | 7696 | 108 | 1.403326% |
Noise dominated data is calculated using 1-second bins in cleaned event files. If a bin has >2000 counts, and if more than 50% of those come from <1% of pixels, then it is considered to be noise-dominated and hence unusable.
| Quadrant | # 1 sec bins | Bins with >0 counts | Bins with >2000 counts | High rate bins dominated by noise | Noise dominated (total time) | Noise dominated (detector-on time) | Marked lightcurve |
|---|---|---|---|---|---|---|---|
| A | 7696 | 7696 | 0 | 0 | 0.00% | 0.00% | 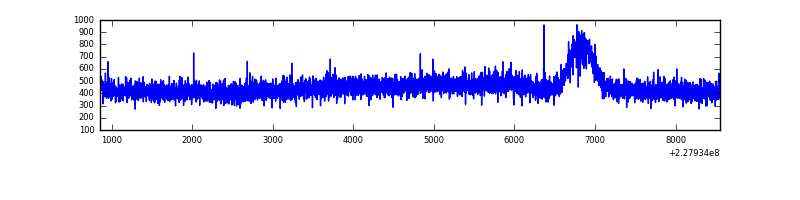 |
| B | 7696 | 7696 | 9 | 9 | 0.12% | 0.12% | 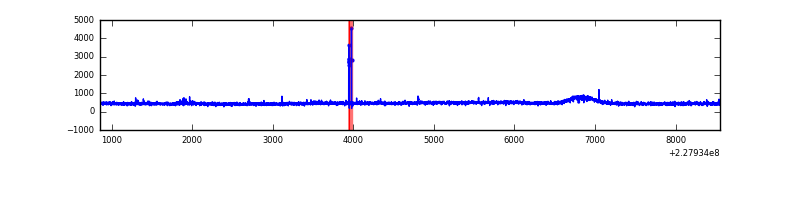 |
| C | 7696 | 7696 | 0 | 0 | 0.00% | 0.00% | 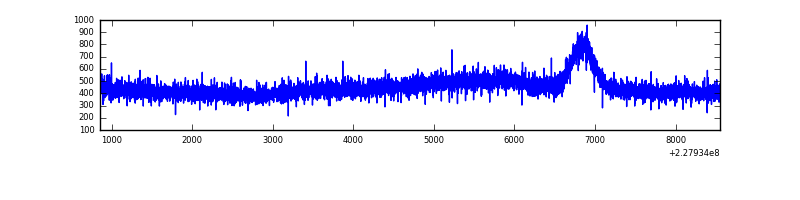 |
| D | 7696 | 7696 | 65 | 65 | 0.84% | 0.84% | 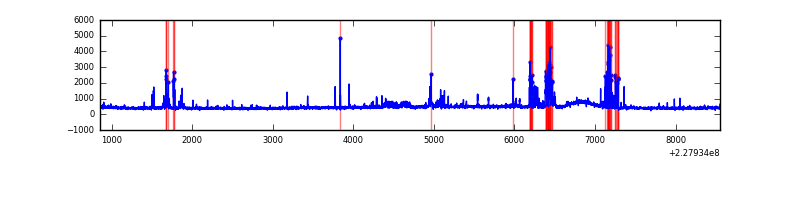 |
Top three noisy pixels from each quadrant. If the there are fewer than three noisy pixels in the level2.evt file, extra rows are filled as -1
| Pixel properties | Quadrant properties | ||||||
|---|---|---|---|---|---|---|---|
| Quadrant | DetID | PixID | Counts | Sigma | Mean | Median | Sigma |
| A | 13 | 14 | 14021 | 70.9 | 897 | 878 | 185.4 |
| A | 0 | 226 | 8419 | 40.68 | 897 | 878 | 185.4 |
| A | 12 | 194 | 8061 | 38.75 | 897 | 878 | 185.4 |
| B | 5 | 250 | 48662 | 270.79 | 905 | 880 | 176.5 |
| B | 5 | 255 | 20800 | 112.89 | 905 | 880 | 176.5 |
| B | 12 | 111 | 20357 | 110.38 | 905 | 880 | 176.5 |
| C | 13 | 61 | 6855 | 28.8 | 882 | 885 | 207.3 |
| C | 8 | 222 | 5296 | 21.28 | 882 | 885 | 207.3 |
| C | 3 | 202 | 2164 | 6.17 | 882 | 885 | 207.3 |
| D | 2 | 14 | 290331 | 1378.74 | 870 | 847 | 210.0 |
| D | 1 | 52 | 248676 | 1180.35 | 870 | 847 | 210.0 |
| D | 14 | 34 | 35605 | 165.54 | 870 | 847 | 210.0 |
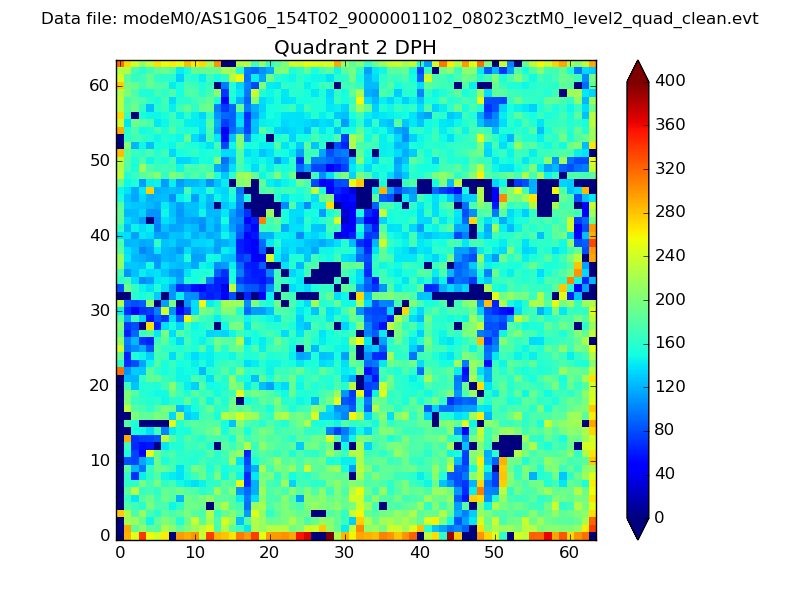
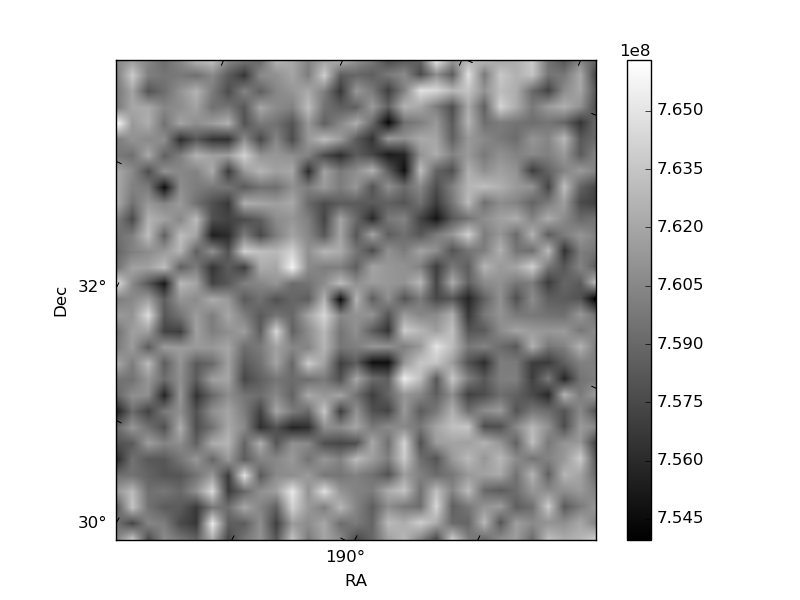
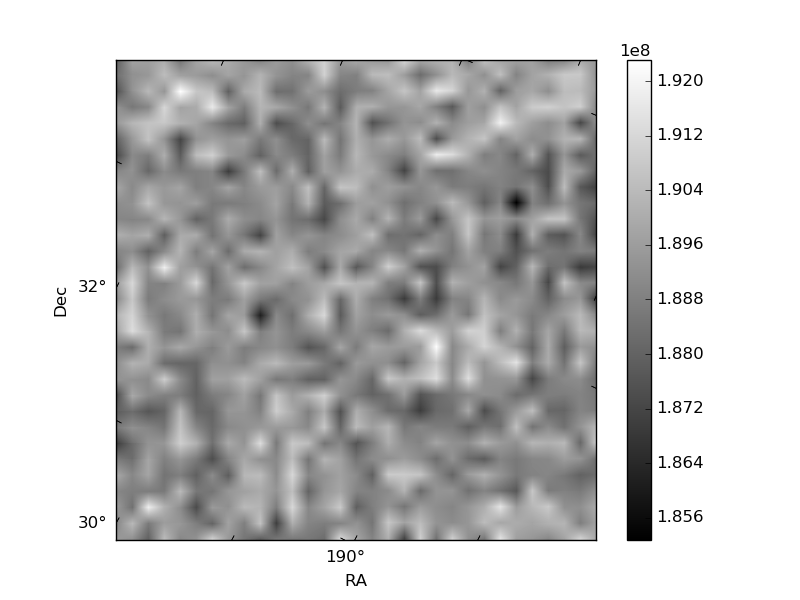
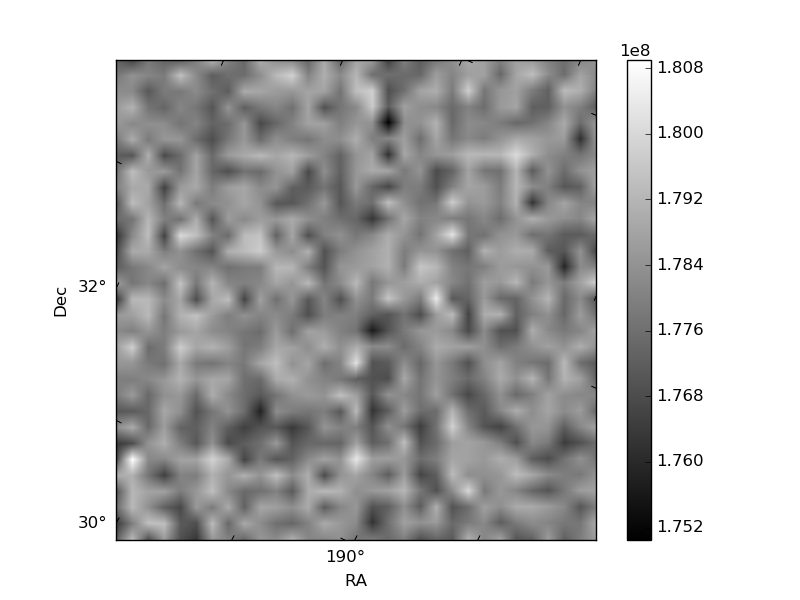
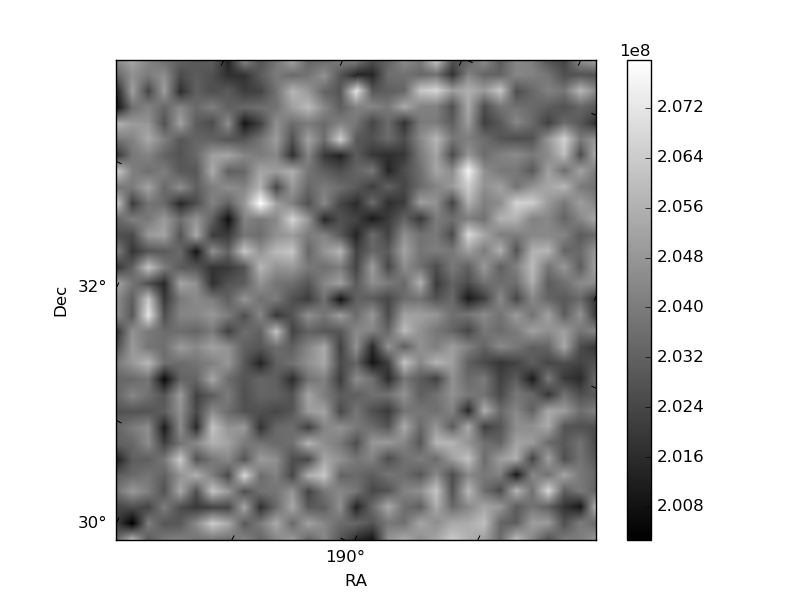
Histogram calculated using DETX and DETY for each event in the final _common_clean file
| Quadrant A | 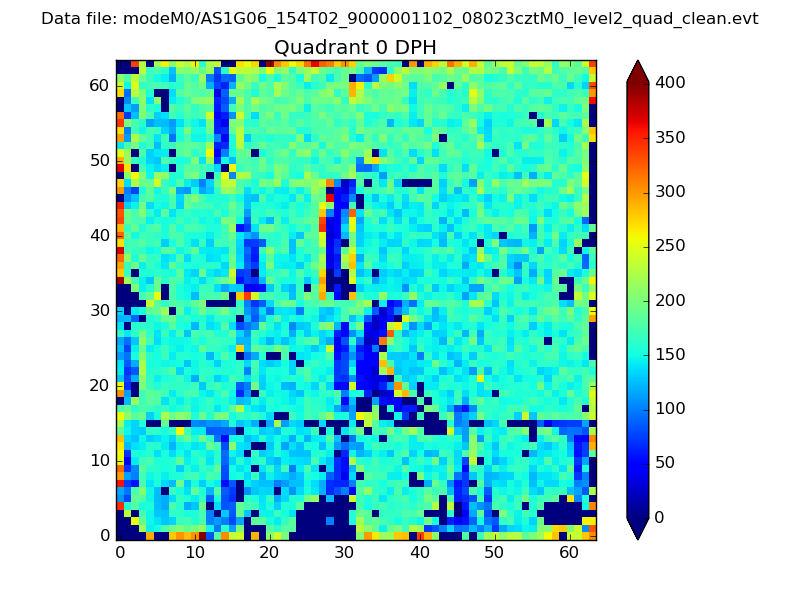 |
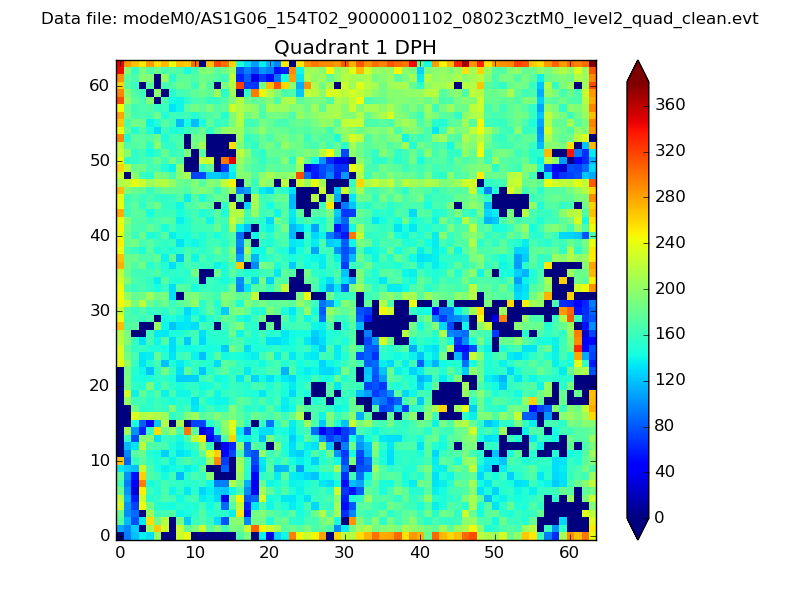 |
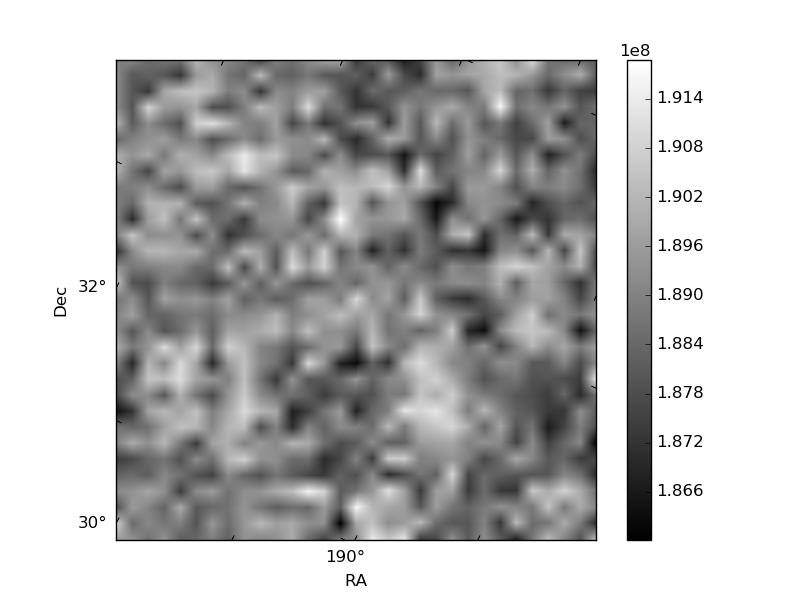
Quadrant B |
|---|---|---|---|
| Quadrant D | 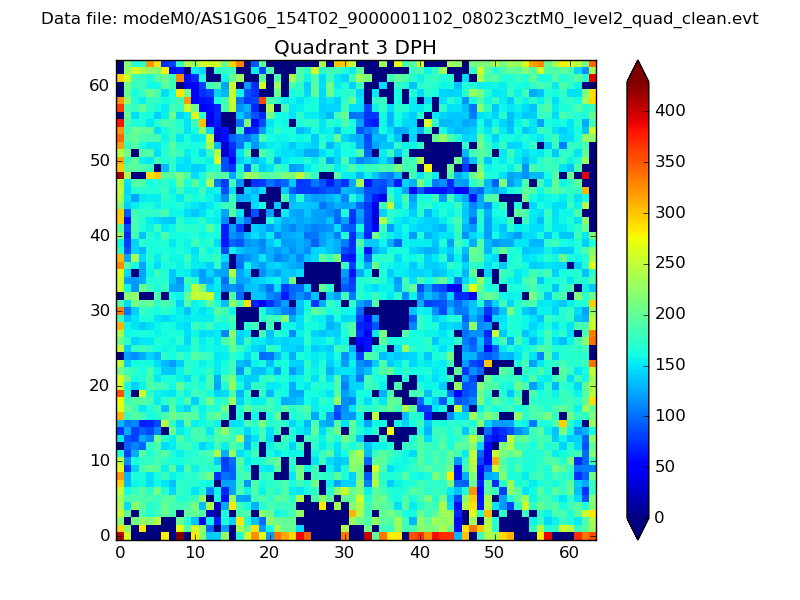 |
 |
Quadrant C |
| Plot type | Count rate plots | Images |
|---|---|---|
| Comparison with Poisson distribution Blue bars denote a histogram of data divided into 1 sec bins. Red curve is a Poisson curve with rate = median count rate of data. |
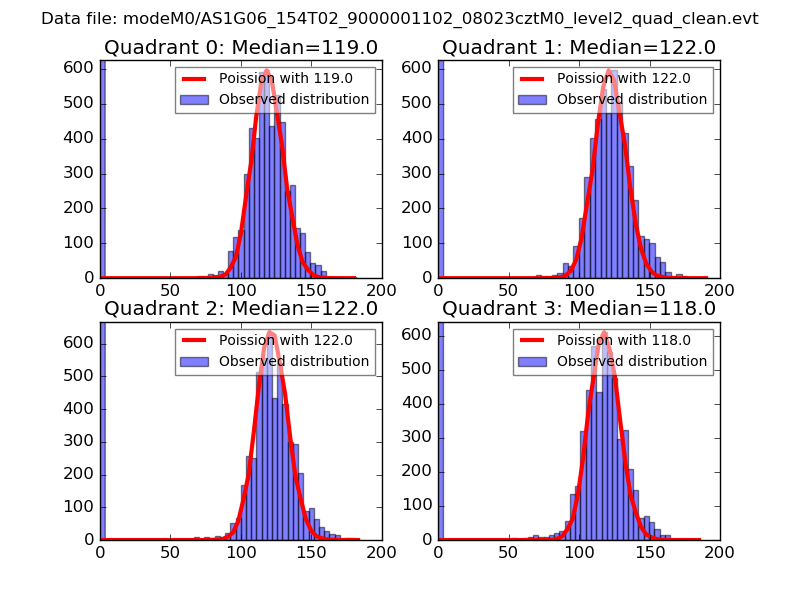 |
 |
| Quadrant-wise count rates Data is divided into 100 sec bins |
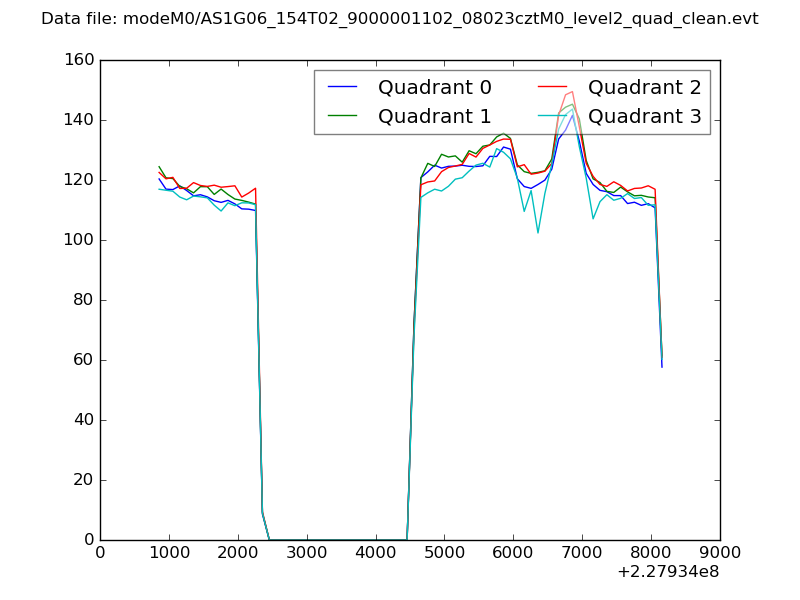 |
|
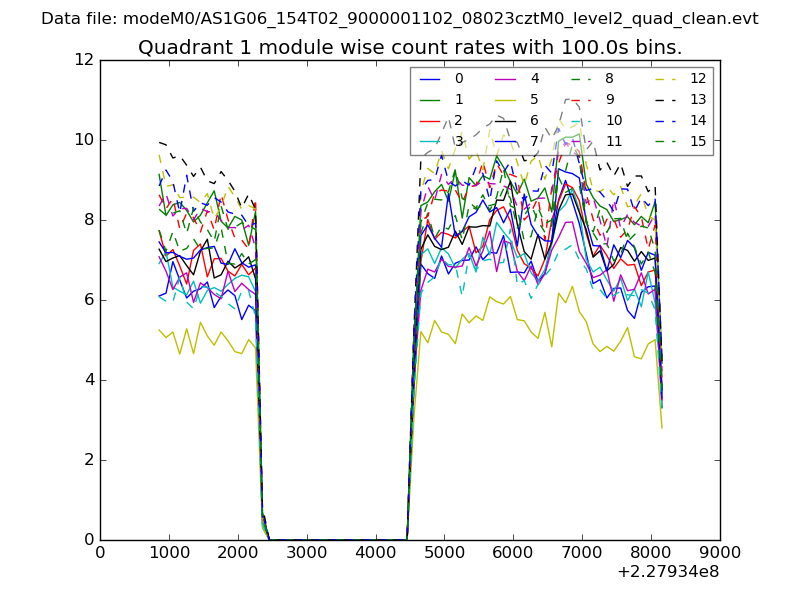
| Module-wise count rates for Quadrant A Data is divided into 100 sec bins |
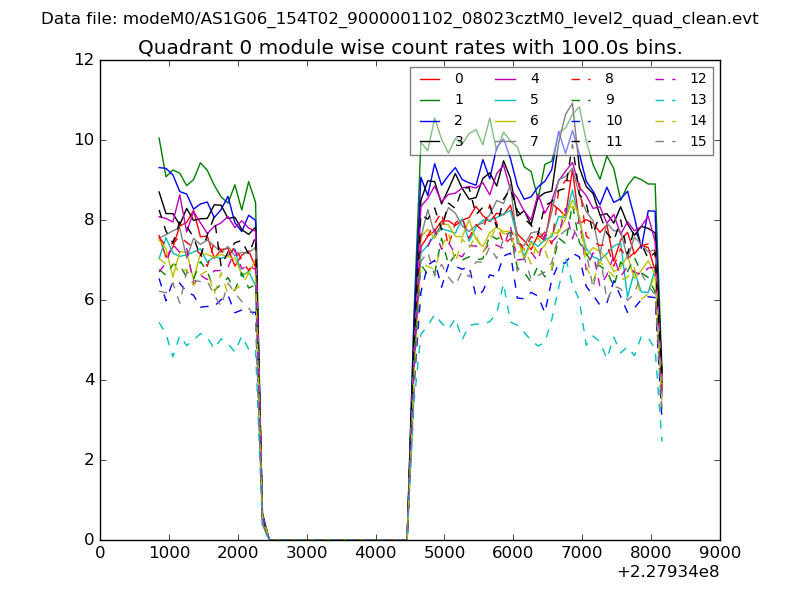 |
 |
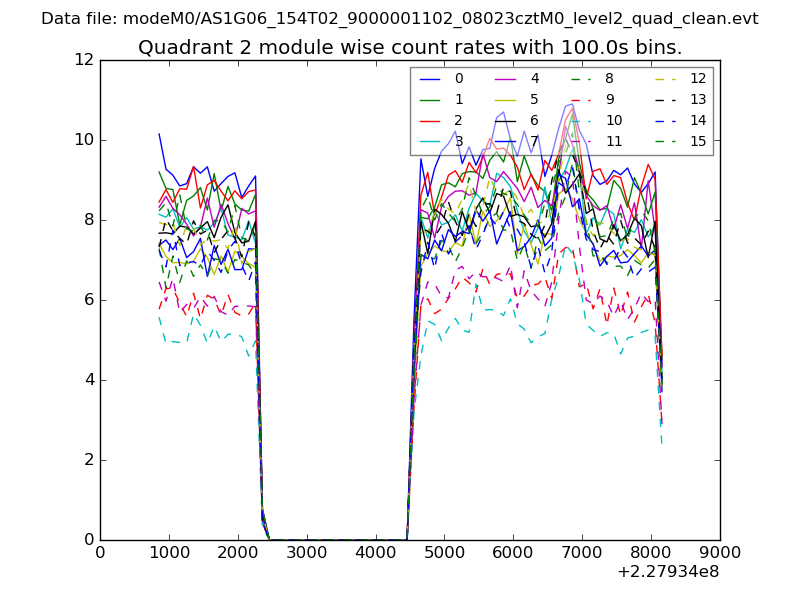
| Module-wise count rates for Quadrant B Data is divided into 100 sec bins |
 |
 |
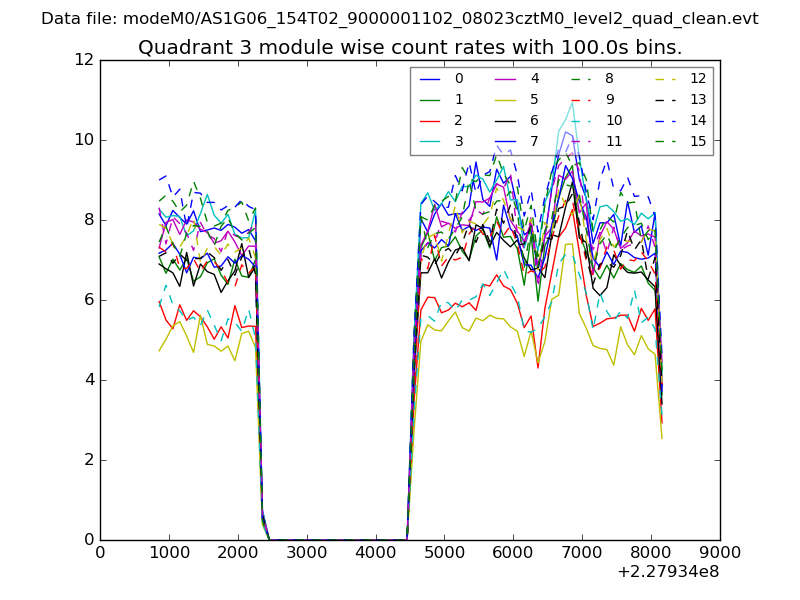
| Module-wise count rates for Quadrant C Data is divided into 100 sec bins |
 |
 |
| Module-wise count rates for Quadrant D Data is divided into 100 sec bins |
 |
 |
| Parameter | Plot |
|---|---|
| CZT HV Monitor | 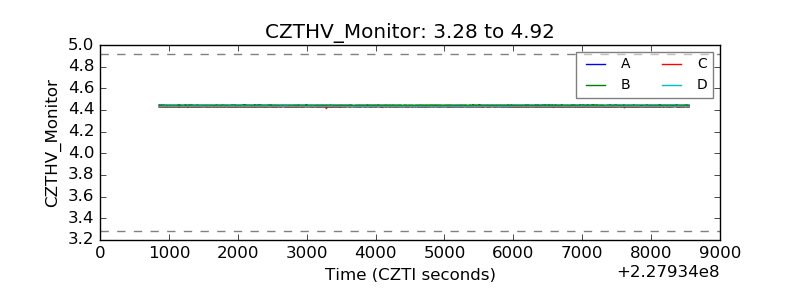 |
| D_VDD | 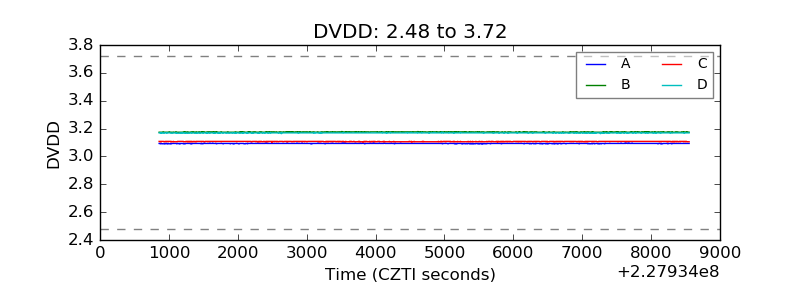 |
| Temperature 1 |  |
| Veto HV Monitor | 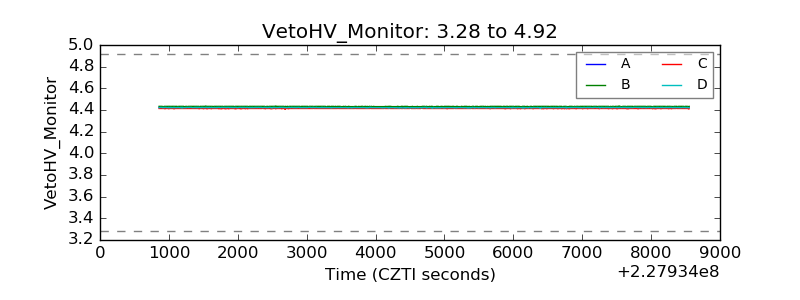 |
| Veto LLD | 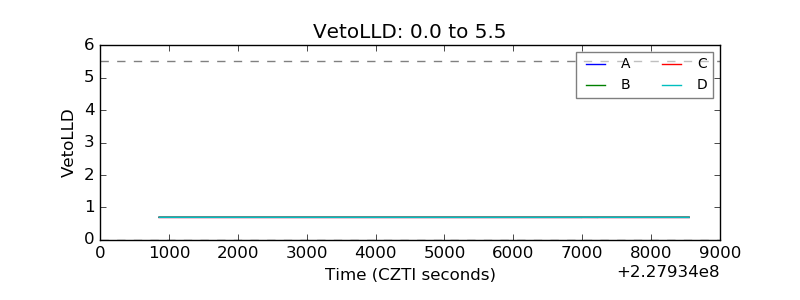 |
| Alpha Counter | 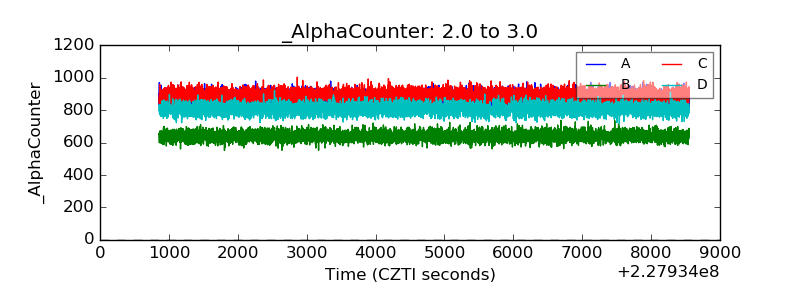 |
| _CPM_Rate |  |
| CZT Counter | 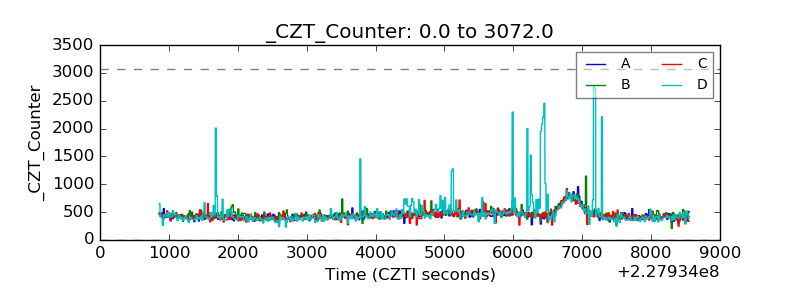 |
| +2.5 Volts monitor |  |
| +5 Volts monitor |  |
| _ROLL_ROT | 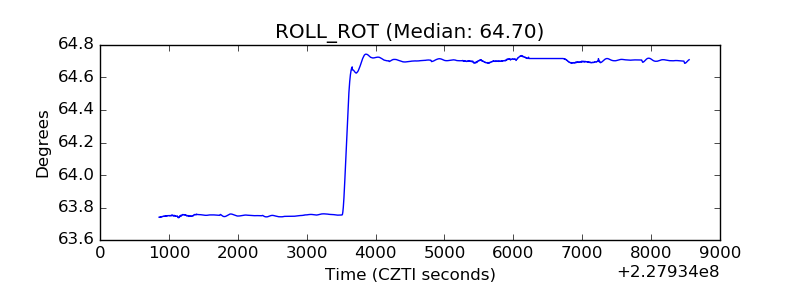 |
| _Roll_DEC | 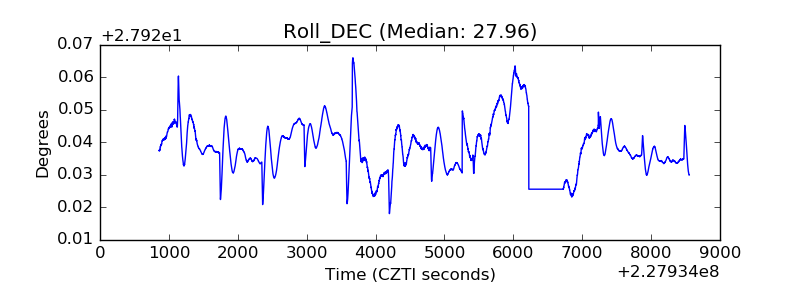 |
| _Roll_RA | 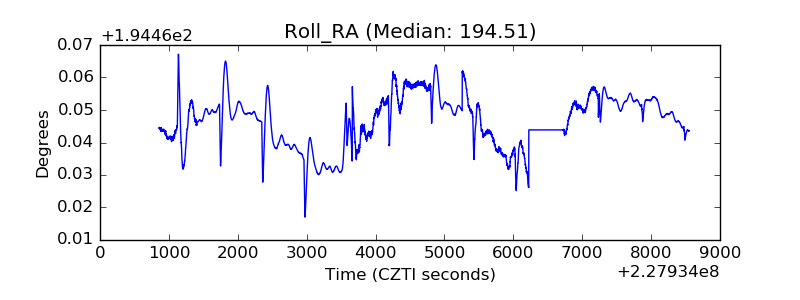 |
| Veto Counter | 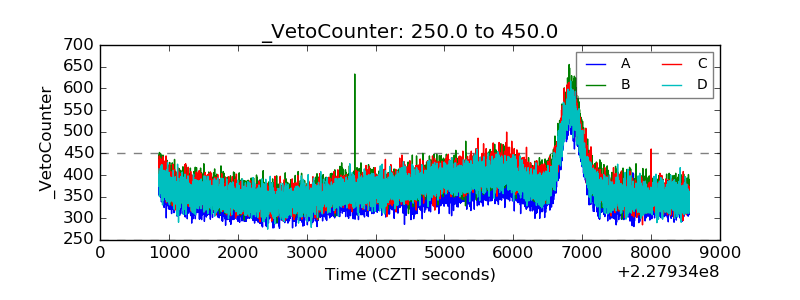 |