| Param | Original file | Final file |
|---|---|---|
| Filename | modeM0/AS1G06_154T02_9000001102_08027cztM0_level2.evt | modeM0/AS1G06_154T02_9000001102_08027cztM0_level2_quad_clean.evt |
| Size (bytes) | 389,436,480 | 64,987,200 |
| Size | 371.4 MB | 62.0 MB |
| Events in quadrant A | 2,538,281 | 396,325 |
| Events in quadrant B | 2,562,041 | 406,070 |
| Events in quadrant C | 2,535,152 | 404,274 |
| Events in quadrant D | 3,779,240 | 371,138 |
| Mode M0 | |||
|---|---|---|---|
| Quadrant | BADHDUFLAG | Total packets | Discarded packets |
| A | 0 | 11455 | 1 |
| B | 0 | 11421 | 1 |
| C | 0 | 11420 | 1 |
| D | 0 | 15219 | 4 |
| Mode SS | |||
|---|---|---|---|
| Quadrant | BADHDUFLAG | Total packets | Discarded packets |
| A | 0 | 114 | 0 |
| B | 0 | 114 | 0 |
| C | 0 | 114 | 0 |
| D | 0 | 114 | 0 |
| Mode M9 | |||
|---|---|---|---|
| Quadrant | BADHDUFLAG | Total packets | Discarded packets |
| A | 0 | 2 | 0 |
| B | 0 | 2 | 0 |
| C | 0 | 2 | 0 |
| D | 0 | 2 | 0 |
| Quadrant | Total seconds | Saturated seconds | Saturation percentage |
|---|---|---|---|
| A | 5566 | 143 | 2.569170% |
| B | 5566 | 159 | 2.856630% |
| C | 5566 | 112 | 2.012217% |
| D | 5564 | 468 | 8.411215% |
Noise dominated data is calculated using 1-second bins in cleaned event files. If a bin has >2000 counts, and if more than 50% of those come from <1% of pixels, then it is considered to be noise-dominated and hence unusable.
| Quadrant | # 1 sec bins | Bins with >0 counts | Bins with >2000 counts | High rate bins dominated by noise | Noise dominated (total time) | Noise dominated (detector-on time) | Marked lightcurve |
|---|---|---|---|---|---|---|---|
| A | 5771 | 5568 | 2 | 2 | 0.03% | 0.04% | 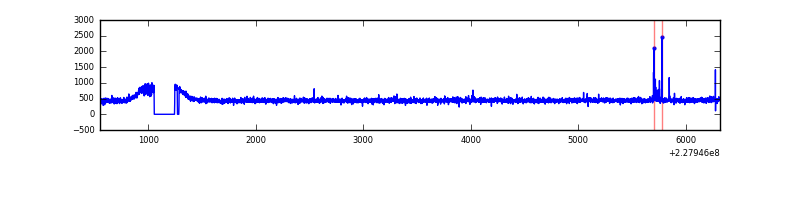 |
| B | 5771 | 5568 | 0 | 0 | 0.00% | 0.00% | 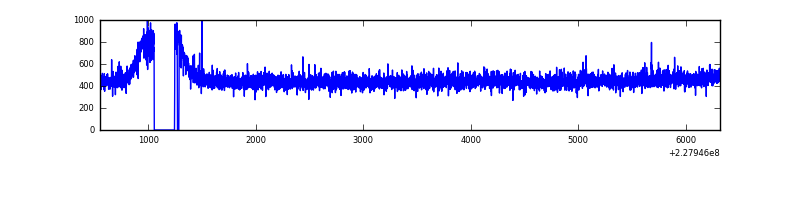 |
| C | 5771 | 5568 | 0 | 0 | 0.00% | 0.00% | 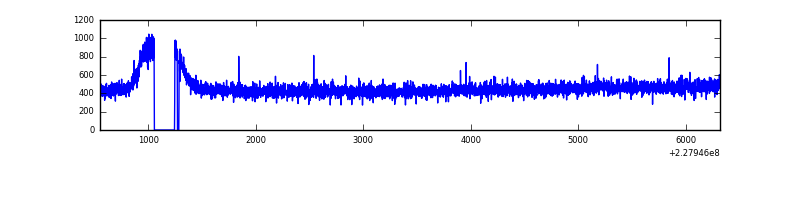 |
| D | 5771 | 5567 | 310 | 310 | 5.37% | 5.57% | 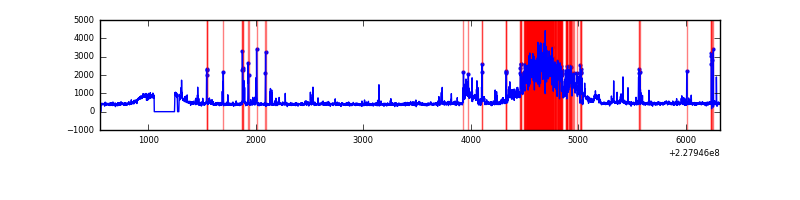 |
Top three noisy pixels from each quadrant. If the there are fewer than three noisy pixels in the level2.evt file, extra rows are filled as -1
| Pixel properties | Quadrant properties | ||||||
|---|---|---|---|---|---|---|---|
| Quadrant | DetID | PixID | Counts | Sigma | Mean | Median | Sigma |
| A | 13 | 251 | 16329 | 114.69 | 654 | 638 | 136.8 |
| A | 0 | 226 | 6191 | 40.59 | 654 | 638 | 136.8 |
| A | 12 | 194 | 5950 | 38.83 | 654 | 638 | 136.8 |
| B | 12 | 111 | 14740 | 108.43 | 657 | 638 | 130.1 |
| B | 11 | 111 | 11985 | 87.25 | 657 | 638 | 130.1 |
| B | 14 | 111 | 9218 | 65.97 | 657 | 638 | 130.1 |
| C | 8 | 128 | 14990 | 94.89 | 642 | 645 | 151.2 |
| C | 8 | 112 | 6064 | 35.84 | 642 | 645 | 151.2 |
| C | 8 | 144 | 5687 | 33.35 | 642 | 645 | 151.2 |
| D | 13 | 169 | 1222443 | 8069.18 | 626 | 610 | 151.4 |
| D | 1 | 52 | 148173 | 974.53 | 626 | 610 | 151.4 |
| D | 2 | 14 | 24137 | 155.38 | 626 | 610 | 151.4 |
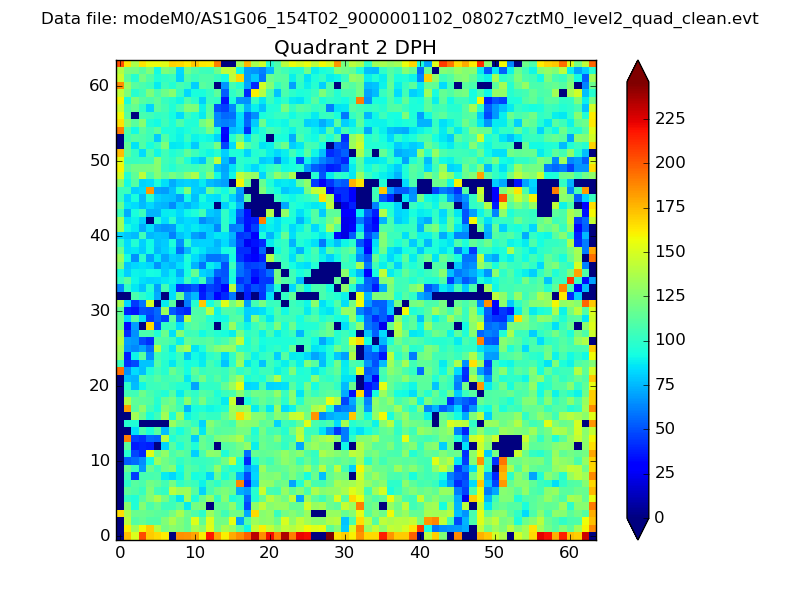
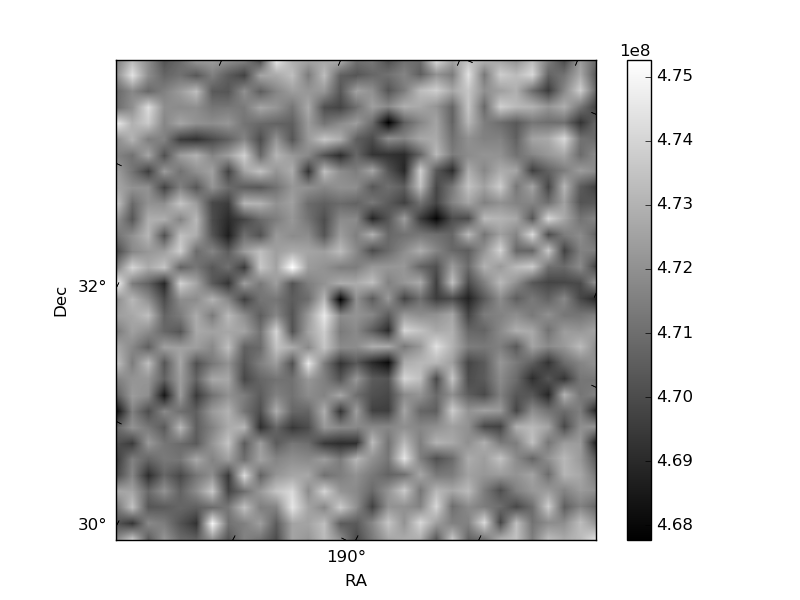
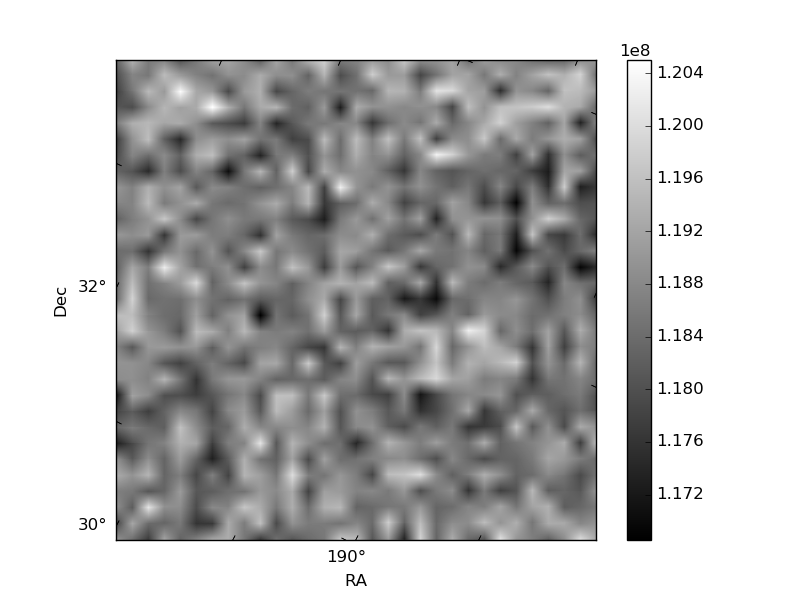
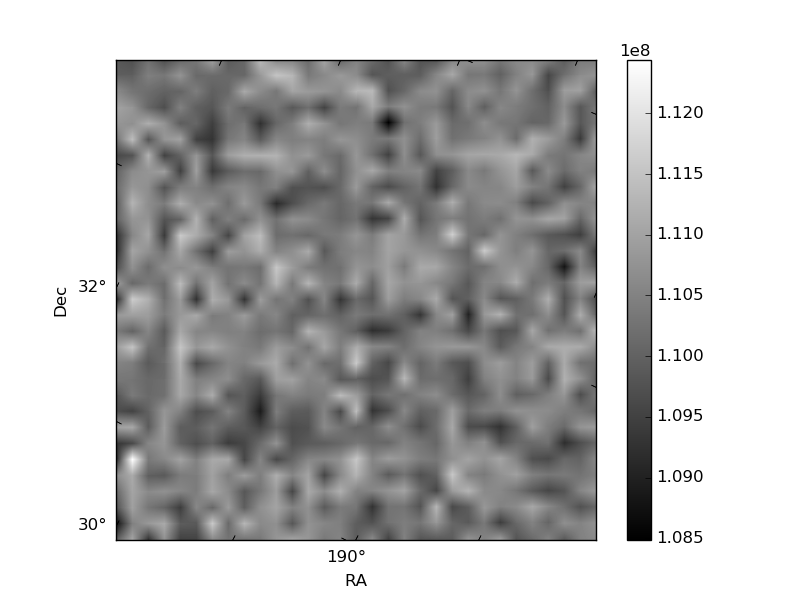
Histogram calculated using DETX and DETY for each event in the final _common_clean file
| Quadrant A | 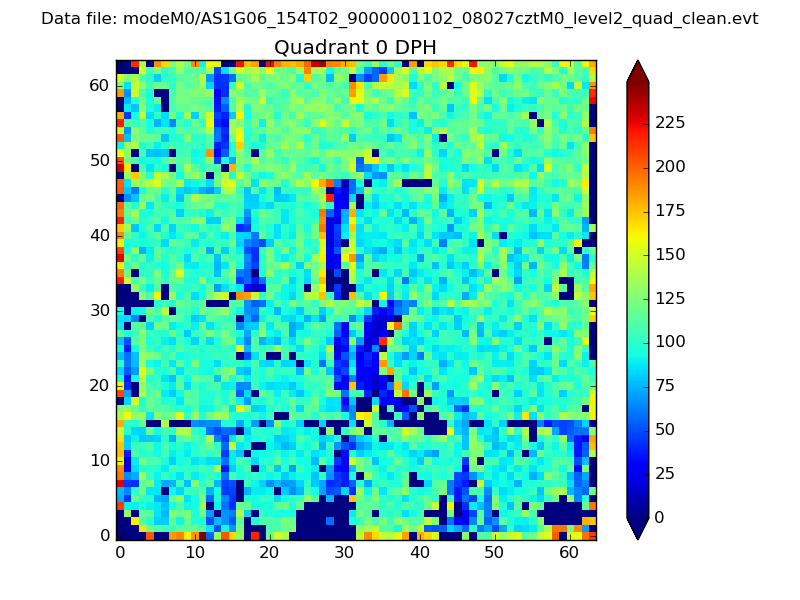 |
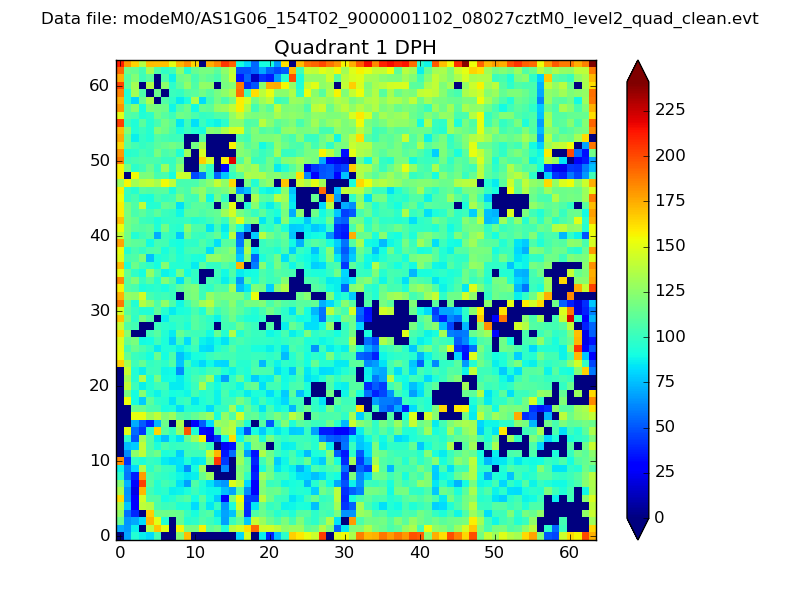 |
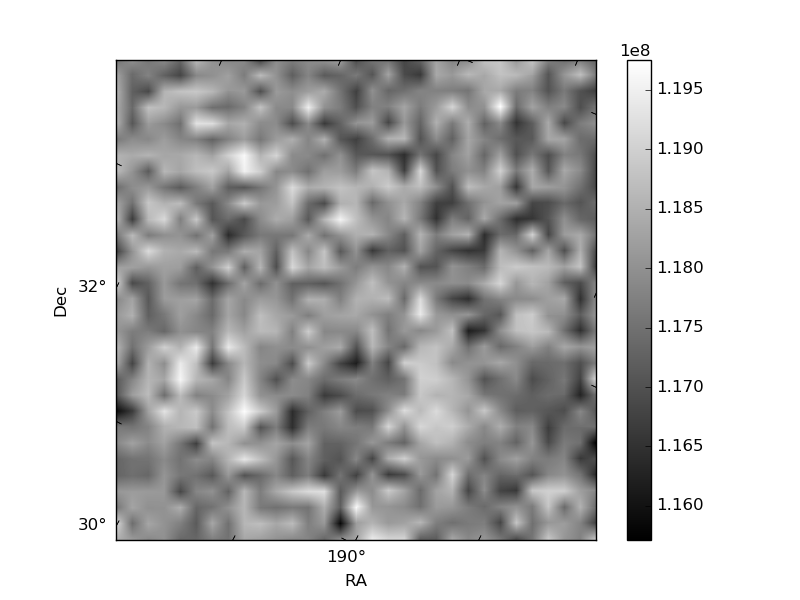
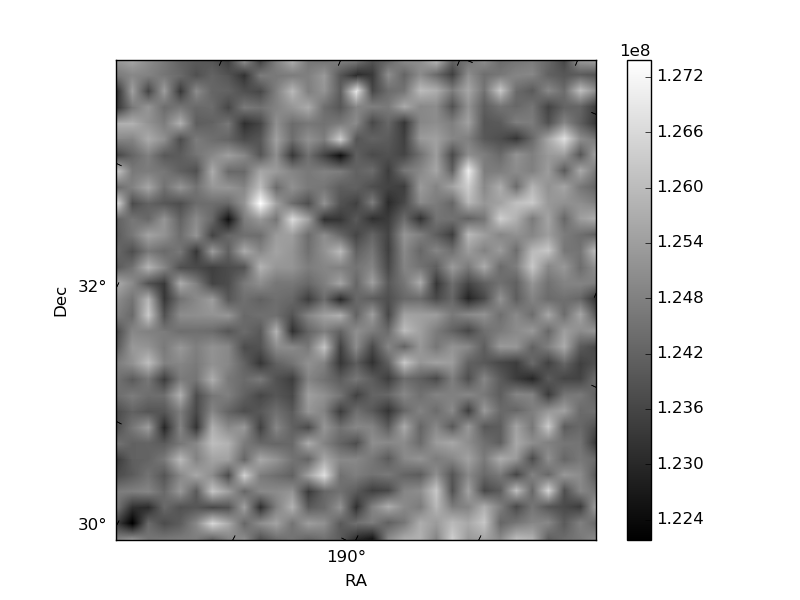
Quadrant B |
|---|---|---|---|
| Quadrant D | 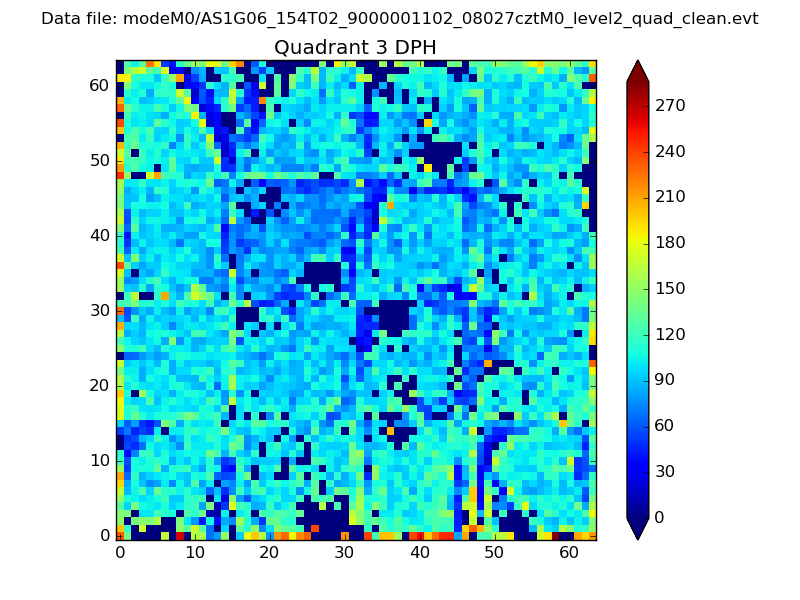 |
 |
Quadrant C |
| Plot type | Count rate plots | Images |
|---|---|---|
| Comparison with Poisson distribution Blue bars denote a histogram of data divided into 1 sec bins. Red curve is a Poisson curve with rate = median count rate of data. |
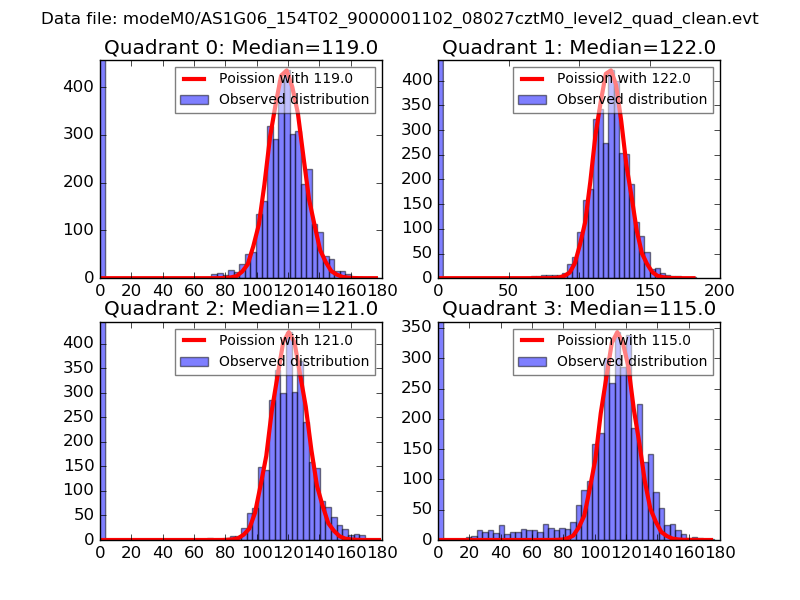 |
 |
| Quadrant-wise count rates Data is divided into 100 sec bins |
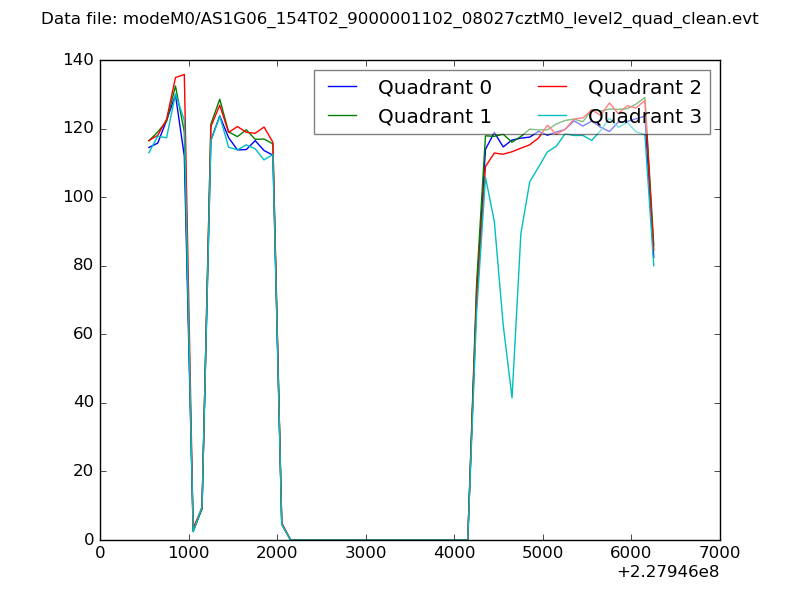 |
|
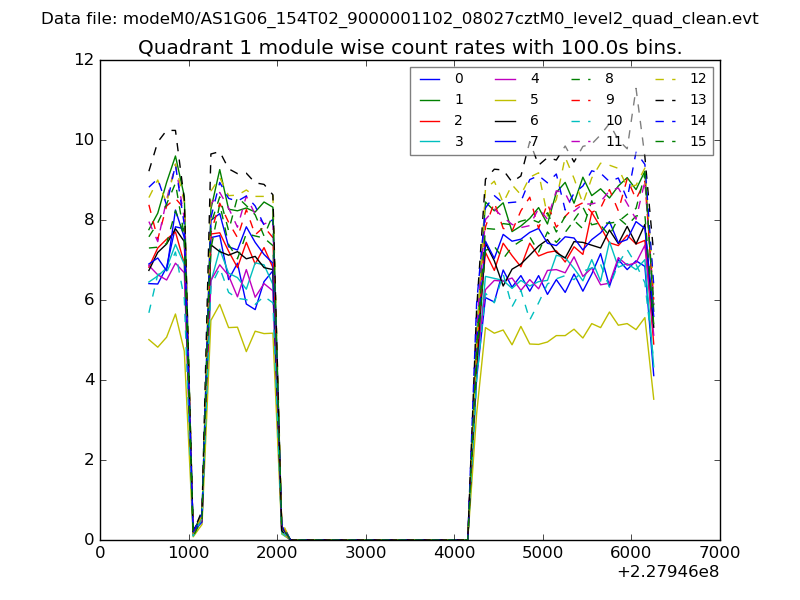
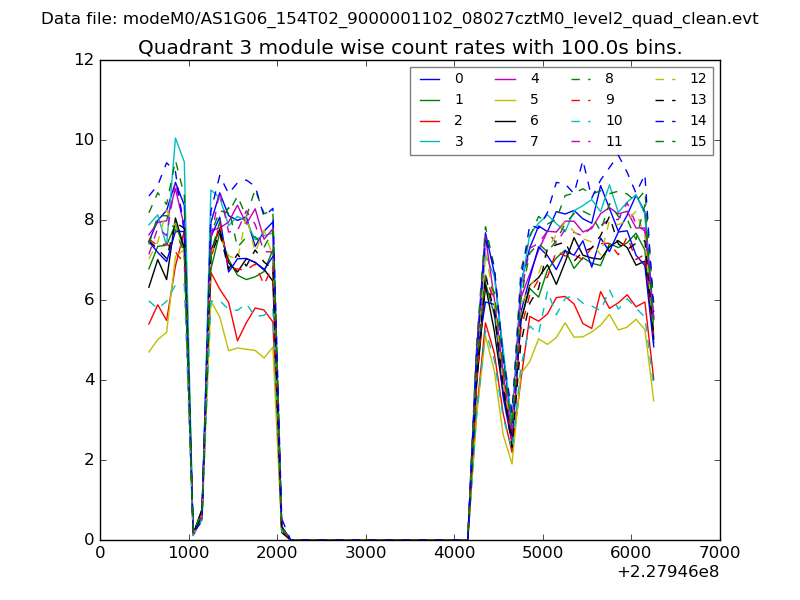
| Module-wise count rates for Quadrant A Data is divided into 100 sec bins |
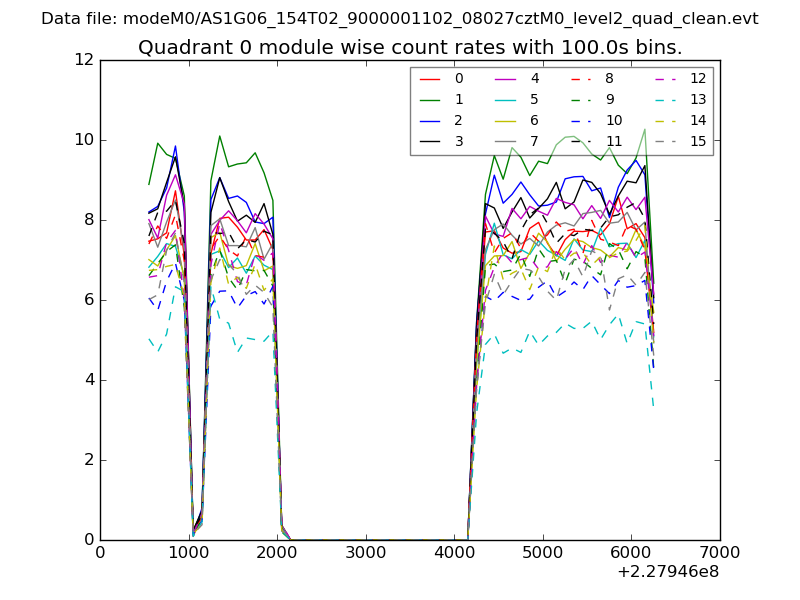 |
 |
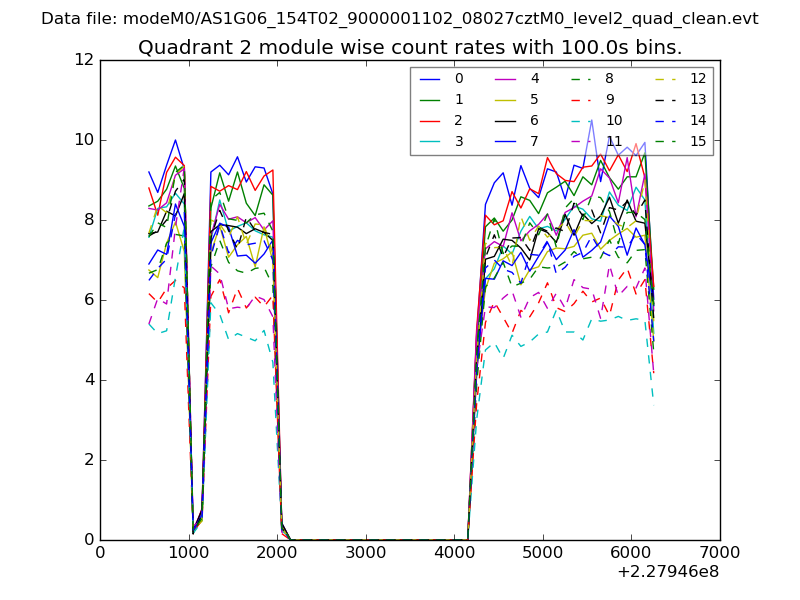
| Module-wise count rates for Quadrant B Data is divided into 100 sec bins |
 |
 |
| Module-wise count rates for Quadrant C Data is divided into 100 sec bins |
 |
 |
| Module-wise count rates for Quadrant D Data is divided into 100 sec bins |
 |
 |
| Parameter | Plot |
|---|---|
| CZT HV Monitor | 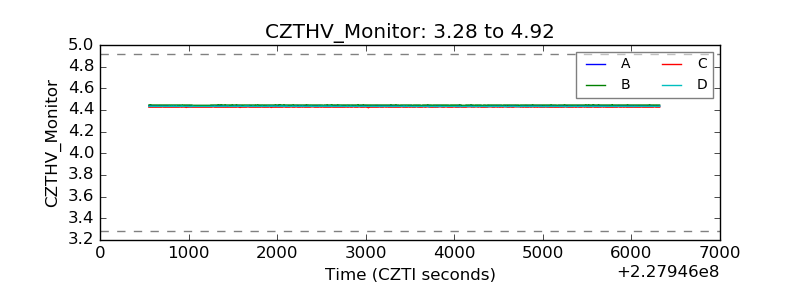 |
| D_VDD | 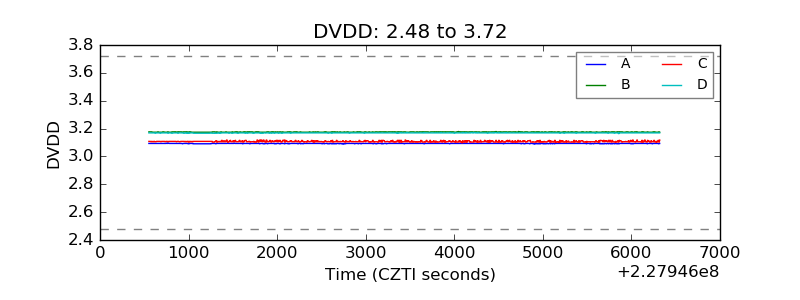 |
| Temperature 1 | 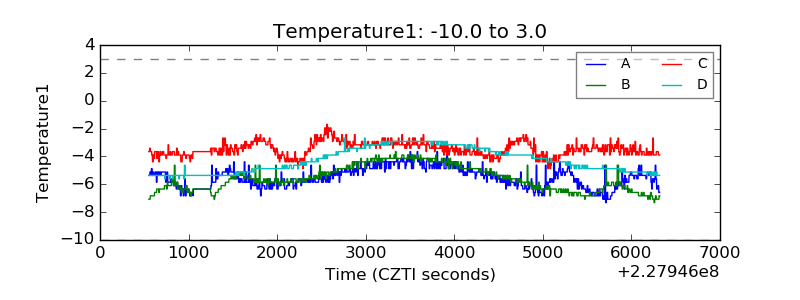 |
| Veto HV Monitor | 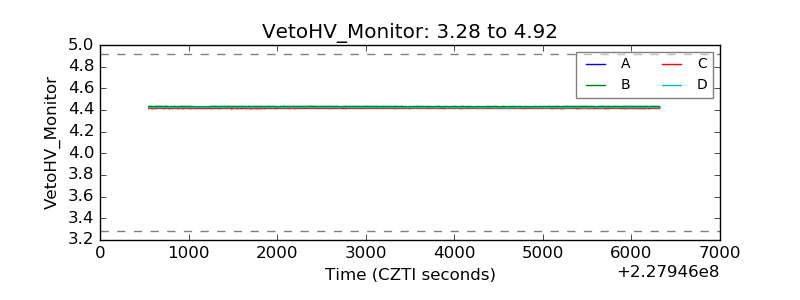 |
| Veto LLD | 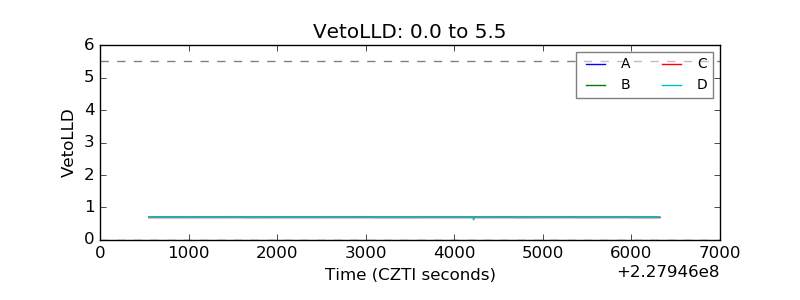 |
| Alpha Counter | 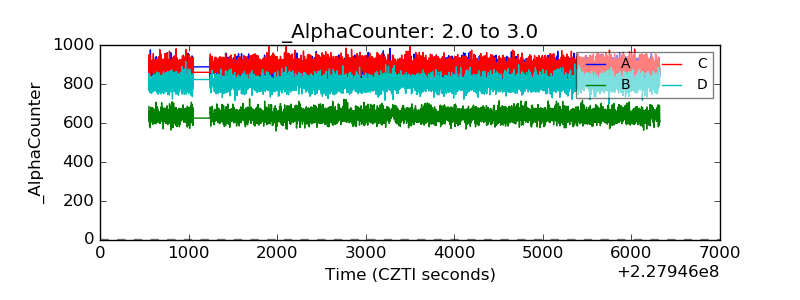 |
| _CPM_Rate | 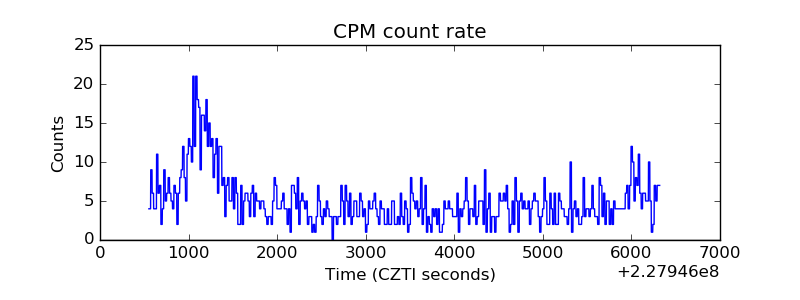 |
| CZT Counter | 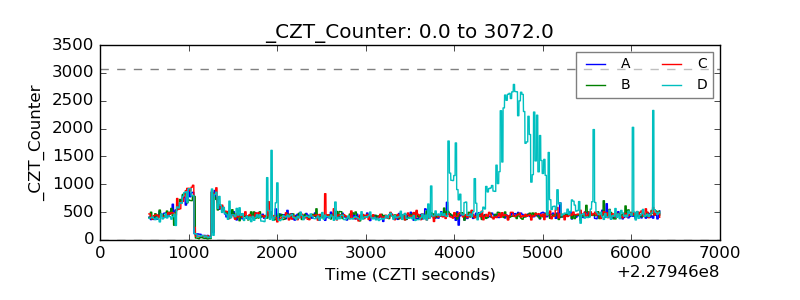 |
| +2.5 Volts monitor |  |
| +5 Volts monitor |  |
| _ROLL_ROT | 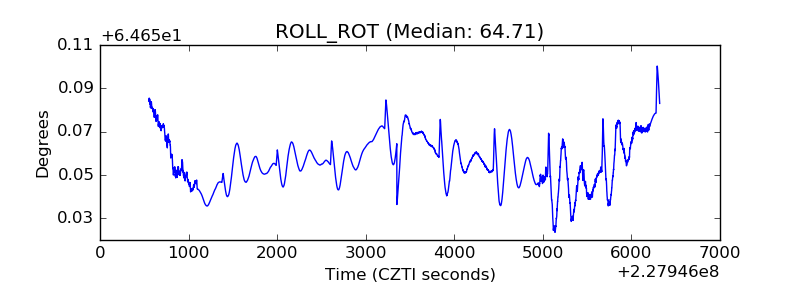 |
| _Roll_DEC | 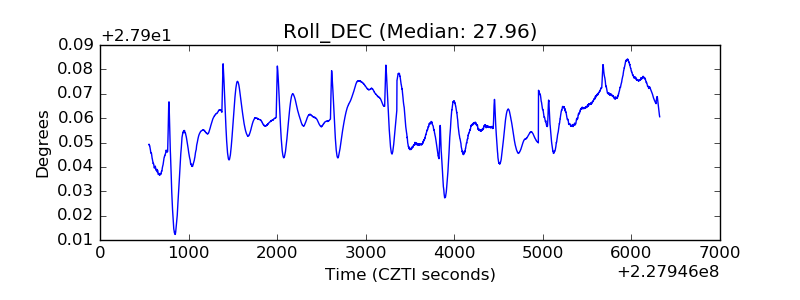 |
| _Roll_RA | 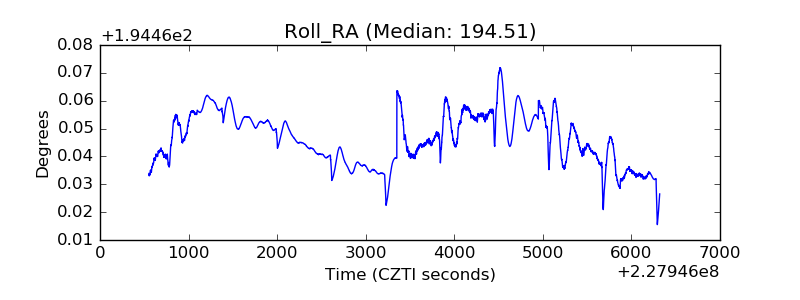 |
| Veto Counter | 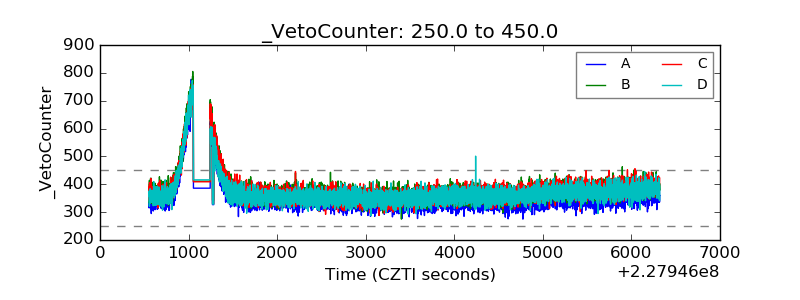 |