| Param | Original file | Final file |
|---|---|---|
| Filename | modeM0/AS1A02_080T01_9000001104cztM0_level2.fits | modeM0/AS1A02_080T01_9000001104cztM0_level2_quad_clean.evt |
| Size (bytes) | 394,585,920 | 409,322,880 |
| Size | 376.3 MB | 390.4 MB |
| Events in quadrant A | 2,434,480 | 2,580,893 |
| Events in quadrant B | 2,342,330 | 2,577,983 |
| Events in quadrant C | 2,379,632 | 2,399,213 |
| Events in quadrant D | 1,916,644 | 1,963,409 |
| Mode SS | |||
|---|---|---|---|
| Quadrant | BADHDUFLAG | Total packets | Discarded packets |
| A | 0 | 852 | 0 |
| B | 0 | 852 | 0 |
| C | 0 | 852 | 0 |
| D | 0 | 852 | 0 |
| Mode M0 | |||
|---|---|---|---|
| Quadrant | BADHDUFLAG | Total packets | Discarded packets |
| A | 0 | 88267 | 0 |
| B | 0 | 94459 | 0 |
| C | 0 | 86034 | 0 |
| D | 0 | 130440 | 0 |
| Mode M9 | |||
|---|---|---|---|
| Quadrant | BADHDUFLAG | Total packets | Discarded packets |
| A | 0 | 87 | 0 |
| B | 0 | 87 | 0 |
| C | 0 | 87 | 0 |
| D | 0 | 87 | 0 |
| Quadrant | Total seconds | Saturated seconds | Saturation percentage |
|---|---|---|---|
| A | 41865 | 561 | 1.340021% |
| B | 41862 | 1084 | 2.589461% |
| C | 41864 | 314 | 0.750048% |
| D | 41864 | 4636 | 11.073954% |
Noise dominated data is calculated using 1-second bins in cleaned event files. If a bin has >2000 counts, and if more than 50% of those come from <1% of pixels, then it is considered to be noise-dominated and hence unusable.
| Quadrant | # 1 sec bins | Bins with >0 counts | Bins with >2000 counts | High rate bins dominated by noise | Noise dominated (total time) | Noise dominated (detector-on time) | Marked lightcurve |
|---|---|---|---|---|---|---|---|
| A | 50667 | 41867 | 0 | 0 | 0.00% | 0.00% |  |
| B | 50667 | 41864 | 0 | 0 | 0.00% | 0.00% |  |
| C | 50667 | 41867 | 0 | 0 | 0.00% | 0.00% | 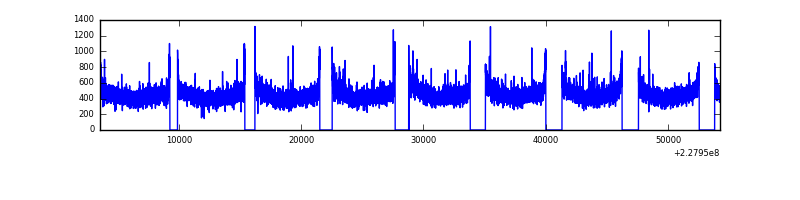 |
| D | 50667 | 41714 | 0 | 0 | 0.00% | 0.00% |  |
Top three noisy pixels from each quadrant. If the there are fewer than three noisy pixels in the level2.evt file, extra rows are filled as -1
| Pixel properties | Quadrant properties | ||||||
|---|---|---|---|---|---|---|---|
| Quadrant | DetID | PixID | Counts | Sigma | Mean | Median | Sigma |
| A | 14 | 188 | 2422 | 11.57 | 631 | 593 | 158.0 |
| A | 0 | 29 | 2420 | 11.56 | 631 | 593 | 158.0 |
| A | 14 | 204 | 2130 | 9.73 | 631 | 593 | 158.0 |
| B | 2 | 9 | 2002 | 11.57 | 619 | 592 | 121.9 |
| B | 12 | 226 | 1621 | 8.44 | 619 | 592 | 121.9 |
| B | 3 | 17 | 1580 | 8.1 | 619 | 592 | 121.9 |
| C | 1 | 80 | 1765 | 7.16 | 628 | 586 | 164.7 |
| C | 1 | 81 | 1754 | 7.09 | 628 | 586 | 164.7 |
| C | 12 | 241 | 1701 | 6.77 | 628 | 586 | 164.7 |
| D | 6 | 231 | 1405 | 6.18 | 547 | 498 | 146.7 |
| D | 10 | 189 | 1394 | 6.1 | 547 | 498 | 146.7 |
| D | 7 | 5 | 1388 | 6.06 | 547 | 498 | 146.7 |
Histogram calculated using DETX and DETY for each event in the final _common_clean file
| Quadrant A |  |
 |
Quadrant B |
|---|---|---|---|
| Quadrant D |  |
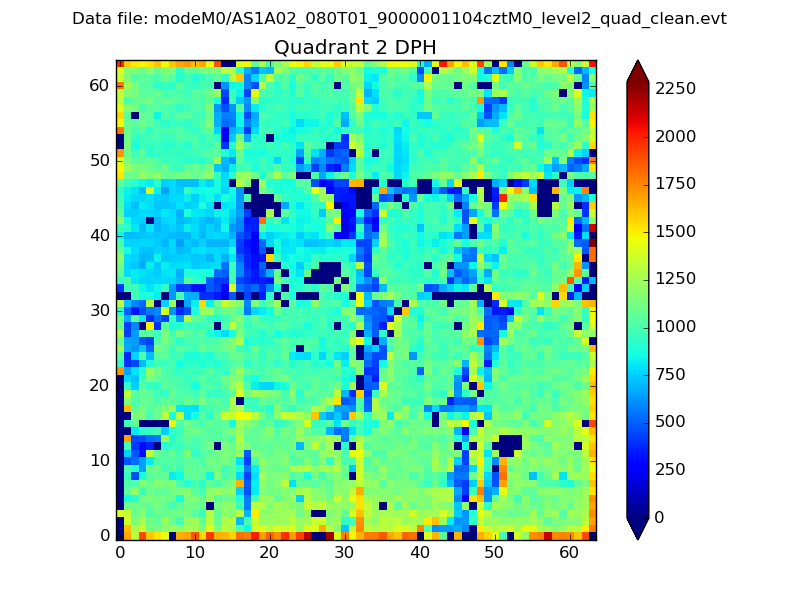 |
Quadrant C |
| Plot type | Count rate plots | Images |
|---|---|---|
| Comparison with Poisson distribution Blue bars denote a histogram of data divided into 1 sec bins. Red curve is a Poisson curve with rate = median count rate of data. |
 |
 |
| Quadrant-wise count rates Data is divided into 100 sec bins |
 |
|
| Module-wise count rates for Quadrant A Data is divided into 100 sec bins |
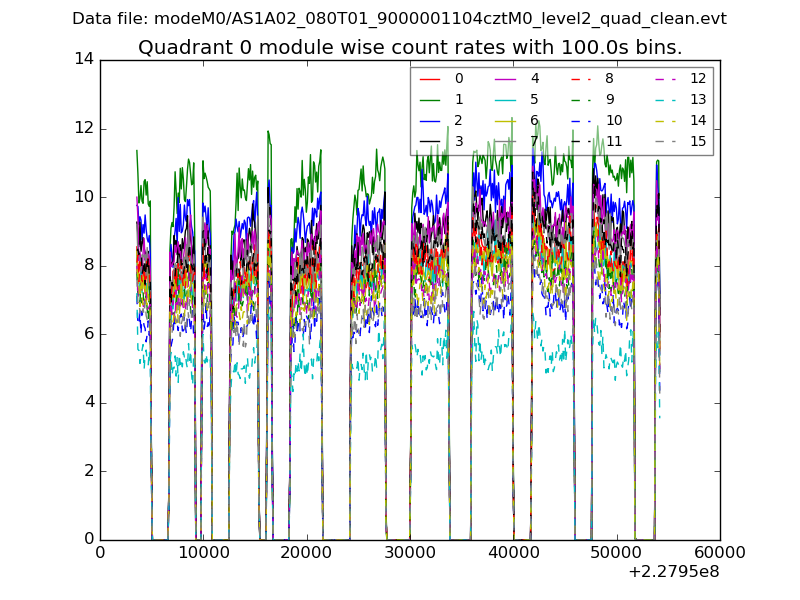 |
 |
| Module-wise count rates for Quadrant B Data is divided into 100 sec bins |
 |
 |
| Module-wise count rates for Quadrant C Data is divided into 100 sec bins |
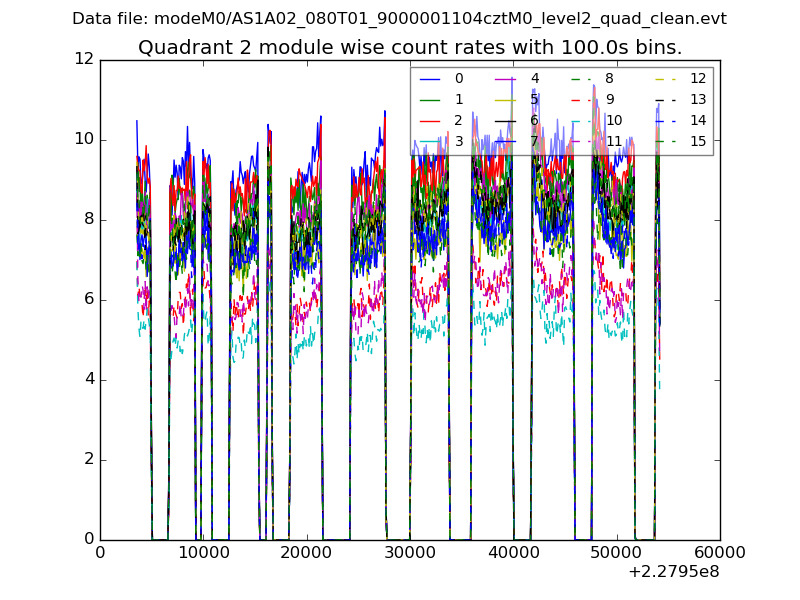 |
 |
| Module-wise count rates for Quadrant D Data is divided into 100 sec bins |
 |
 |
| Parameter | Plot |
|---|---|
| CZT HV Monitor |  |
| D_VDD |  |
| Temperature 1 |  |
| Veto HV Monitor |  |
| Veto LLD |  |
| Alpha Counter |  |
| _CPM_Rate |  |
| CZT Counter |  |
| +2.5 Volts monitor |  |
| +5 Volts monitor |  |
| _ROLL_ROT | 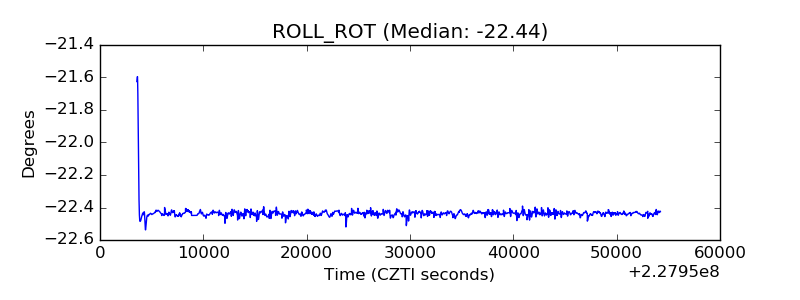 |
| _Roll_DEC |  |
| _Roll_RA |  |
| Veto Counter |  |