| Param | Original file | Final file |
|---|---|---|
| Filename | modeM0/AS1A02_080T01_9000001104_08027cztM0_level2.evt | modeM0/AS1A02_080T01_9000001104_08027cztM0_level2_quad_clean.evt |
| Size (bytes) | 768,628,800 | 155,424,960 |
| Size | 733.0 MB | 148.2 MB |
| Events in quadrant A | 5,297,636 | 987,458 |
| Events in quadrant B | 5,906,012 | 1,002,169 |
| Events in quadrant C | 5,149,118 | 979,048 |
| Events in quadrant D | 6,141,207 | 938,258 |
| Mode SS | |||
|---|---|---|---|
| Quadrant | BADHDUFLAG | Total packets | Discarded packets |
| A | 0 | 234 | 0 |
| B | 0 | 234 | 0 |
| C | 0 | 234 | 0 |
| D | 0 | 234 | 0 |
| Mode M0 | |||
|---|---|---|---|
| Quadrant | BADHDUFLAG | Total packets | Discarded packets |
| A | 0 | 23805 | 10 |
| B | 0 | 25010 | 15 |
| C | 0 | 23596 | 11 |
| D | 0 | 26379 | 11 |
| Mode M9 | |||
|---|---|---|---|
| Quadrant | BADHDUFLAG | Total packets | Discarded packets |
| A | 0 | 15 | 0 |
| B | 0 | 15 | 0 |
| C | 0 | 15 | 0 |
| D | 0 | 15 | 0 |
| Quadrant | Total seconds | Saturated seconds | Saturation percentage |
|---|---|---|---|
| A | 11564 | 162 | 1.400899% |
| B | 11561 | 255 | 2.205692% |
| C | 11563 | 132 | 1.141572% |
| D | 11563 | 231 | 1.997751% |
Noise dominated data is calculated using 1-second bins in cleaned event files. If a bin has >2000 counts, and if more than 50% of those come from <1% of pixels, then it is considered to be noise-dominated and hence unusable.
| Quadrant | # 1 sec bins | Bins with >0 counts | Bins with >2000 counts | High rate bins dominated by noise | Noise dominated (total time) | Noise dominated (detector-on time) | Marked lightcurve |
|---|---|---|---|---|---|---|---|
| A | 13032 | 11569 | 1 | 1 | 0.01% | 0.01% | 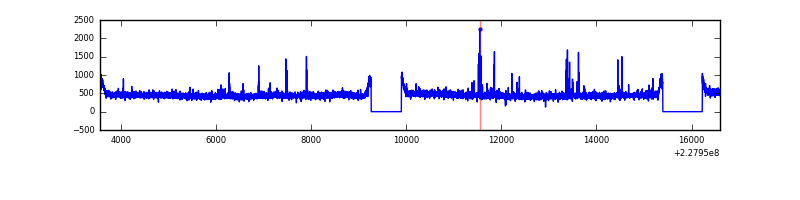 |
| B | 13032 | 11569 | 60 | 60 | 0.46% | 0.52% | 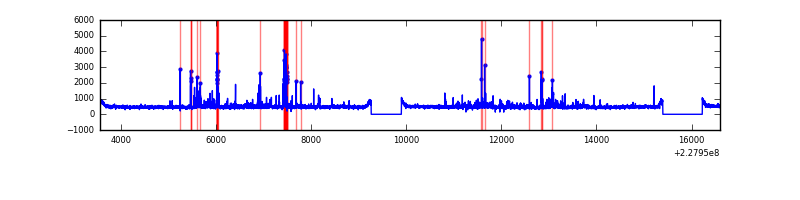 |
| C | 13032 | 11569 | 0 | 0 | 0.00% | 0.00% | 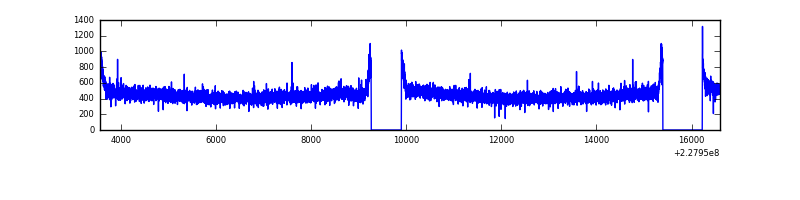 |
| D | 13032 | 11569 | 70 | 70 | 0.54% | 0.61% | 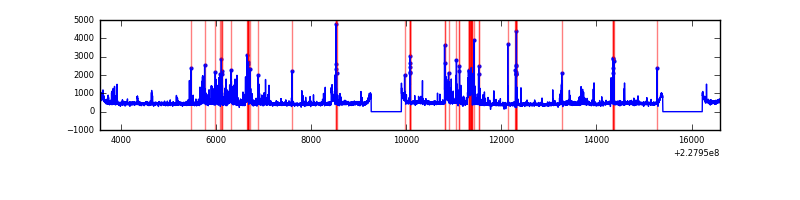 |
Top three noisy pixels from each quadrant. If the there are fewer than three noisy pixels in the level2.evt file, extra rows are filled as -1
| Pixel properties | Quadrant properties | ||||||
|---|---|---|---|---|---|---|---|
| Quadrant | DetID | PixID | Counts | Sigma | Mean | Median | Sigma |
| A | 4 | 2 | 80346 | 290.4 | 1342 | 1309 | 272.2 |
| A | 15 | 234 | 14469 | 48.35 | 1342 | 1309 | 272.2 |
| A | 15 | 223 | 13371 | 44.32 | 1342 | 1309 | 272.2 |
| B | 4 | 239 | 292928 | 1136.54 | 1349 | 1316 | 256.6 |
| B | 11 | 51 | 180520 | 698.43 | 1349 | 1316 | 256.6 |
| B | 10 | 16 | 43557 | 164.63 | 1349 | 1316 | 256.6 |
| C | 13 | 61 | 10021 | 28.58 | 1316 | 1320 | 304.4 |
| C | 8 | 222 | 7271 | 19.55 | 1316 | 1320 | 304.4 |
| C | 12 | 4 | 6466 | 16.9 | 1316 | 1320 | 304.4 |
| D | 1 | 83 | 380137 | 1114.34 | 1301 | 1266 | 340.0 |
| D | 13 | 169 | 369306 | 1082.49 | 1301 | 1266 | 340.0 |
| D | 1 | 52 | 209275 | 611.8 | 1301 | 1266 | 340.0 |
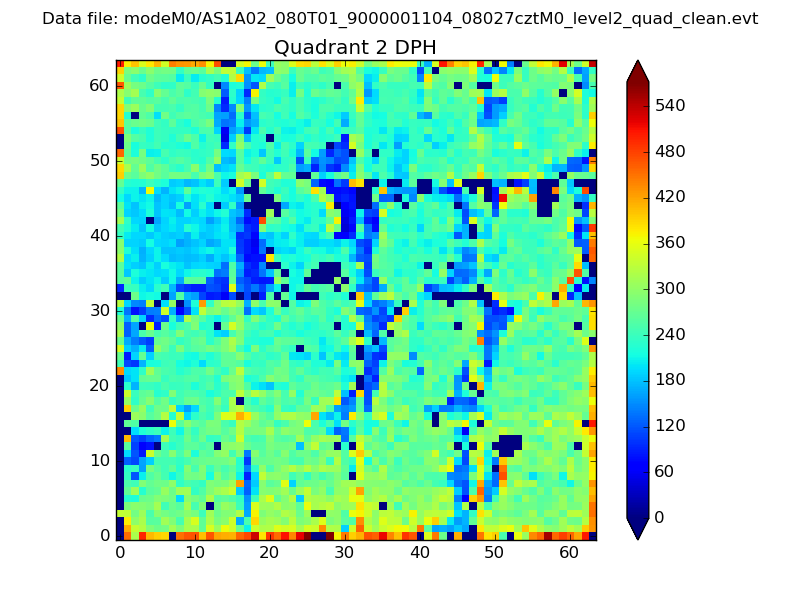
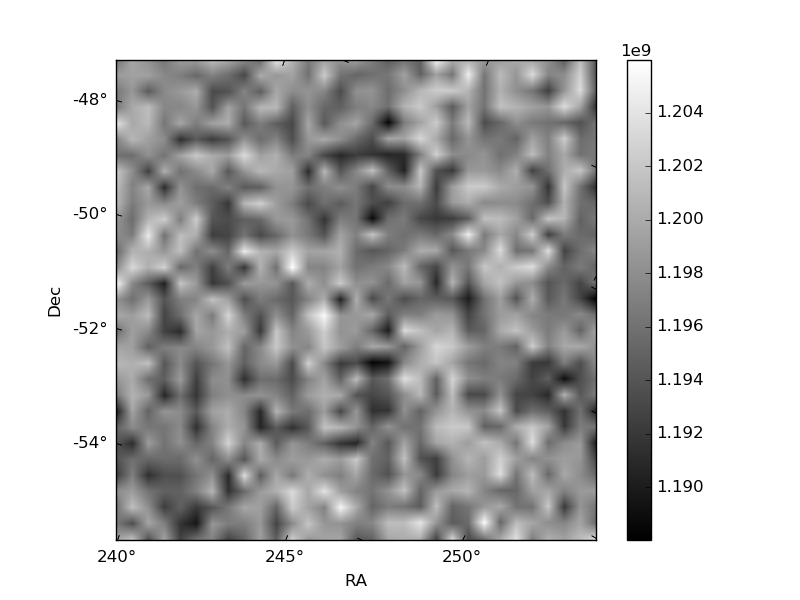
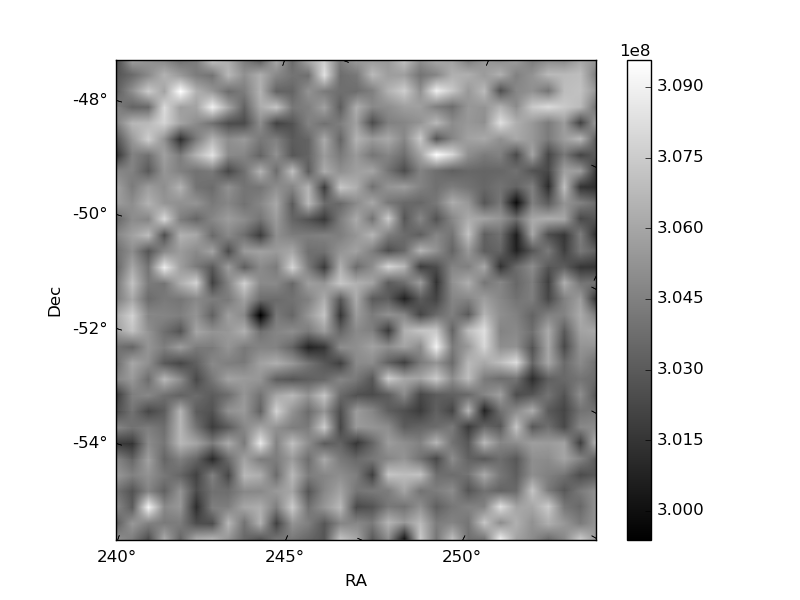
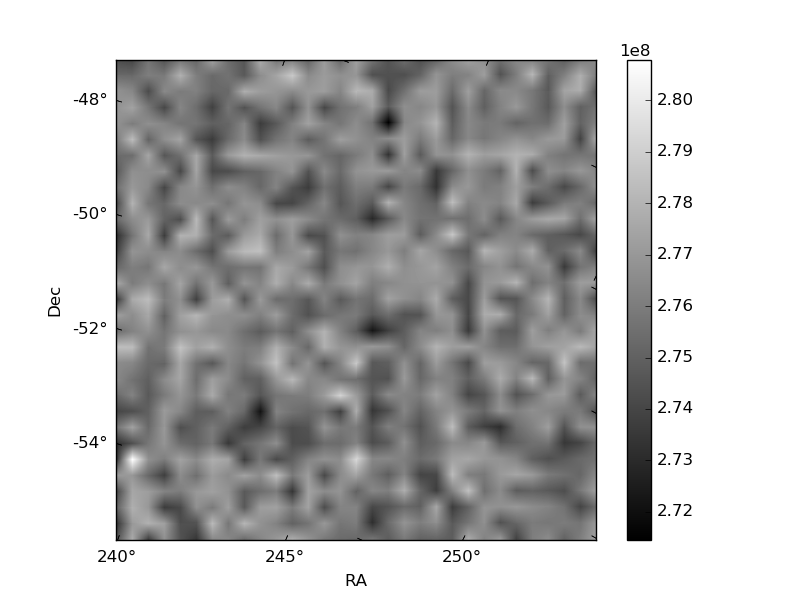
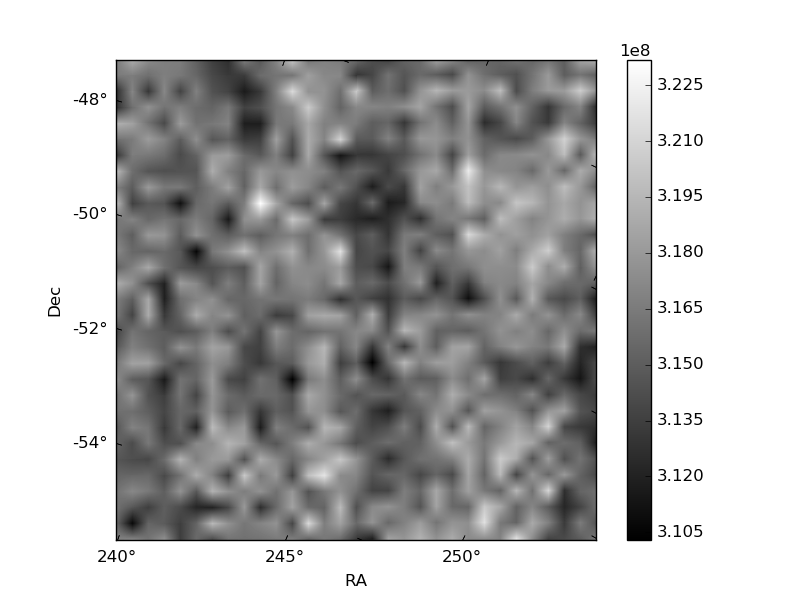
Histogram calculated using DETX and DETY for each event in the final _common_clean file
| Quadrant A | 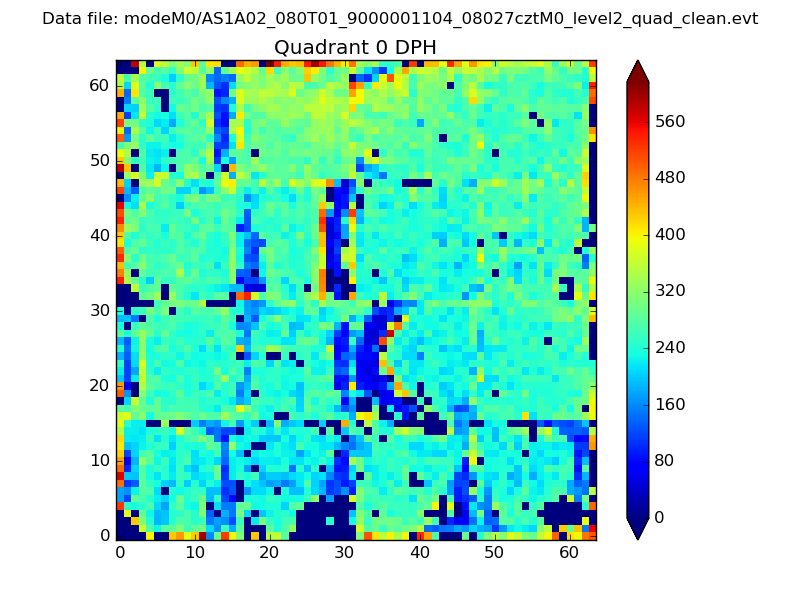 |
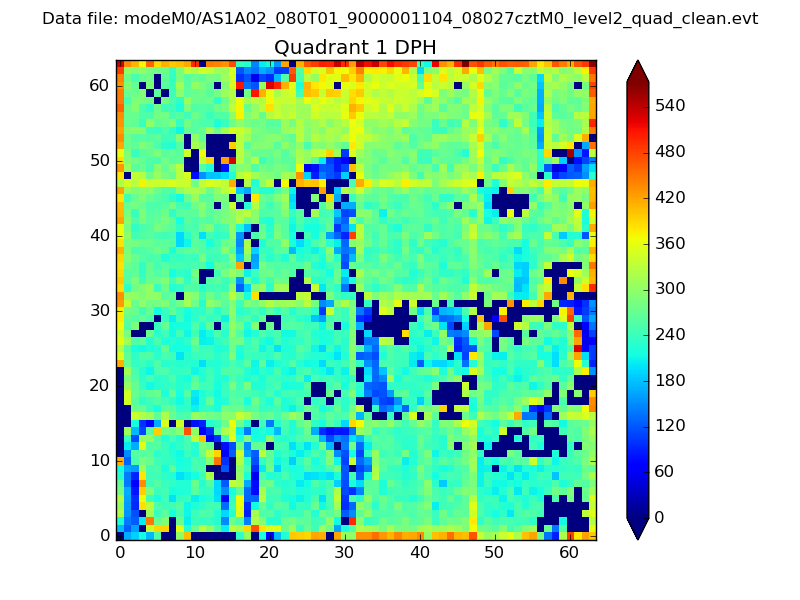 |
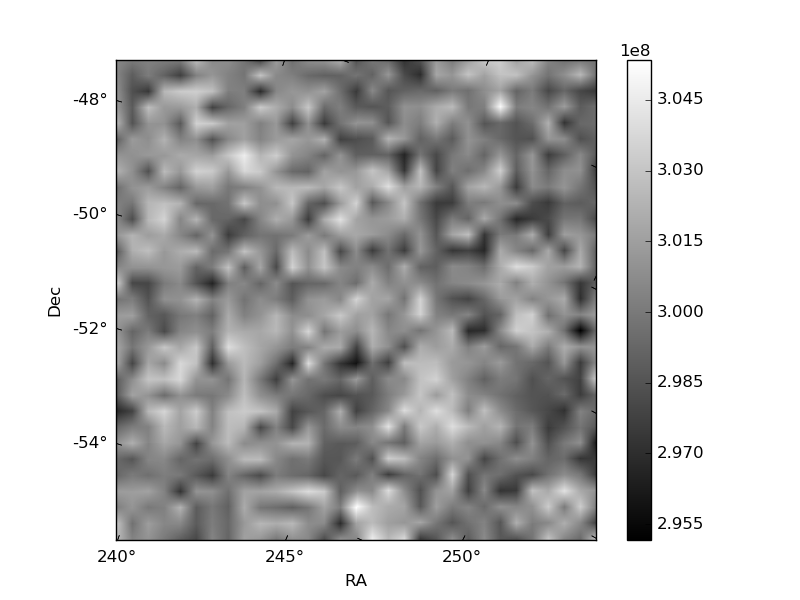
Quadrant B |
|---|---|---|---|
| Quadrant D | 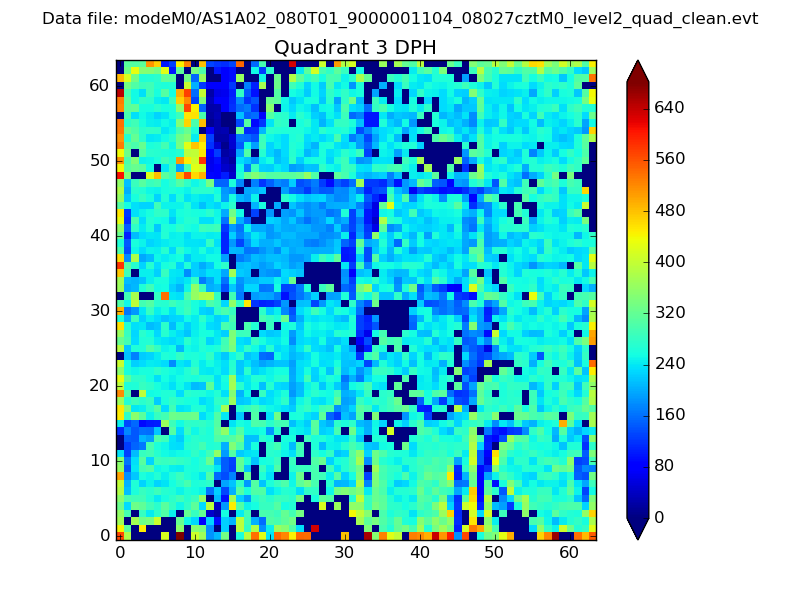 |
 |
Quadrant C |
| Plot type | Count rate plots | Images |
|---|---|---|
| Comparison with Poisson distribution Blue bars denote a histogram of data divided into 1 sec bins. Red curve is a Poisson curve with rate = median count rate of data. |
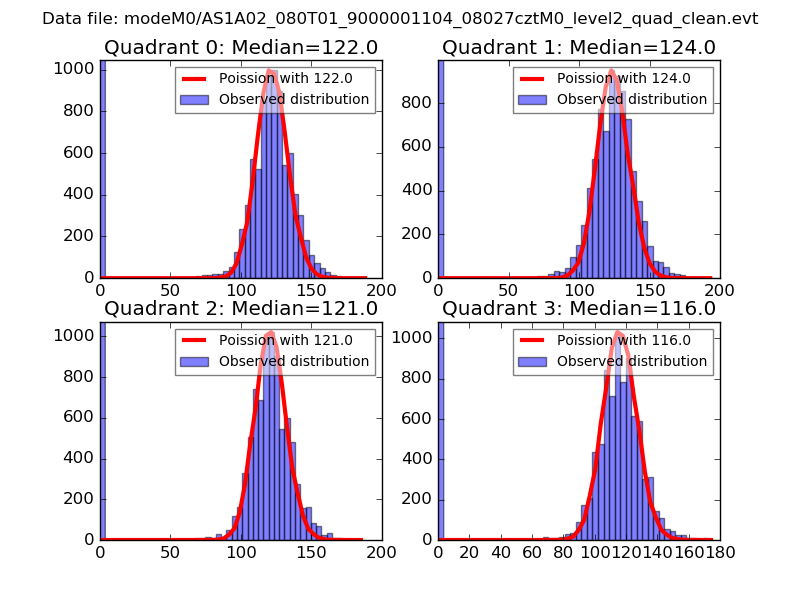 |
 |
| Quadrant-wise count rates Data is divided into 100 sec bins |
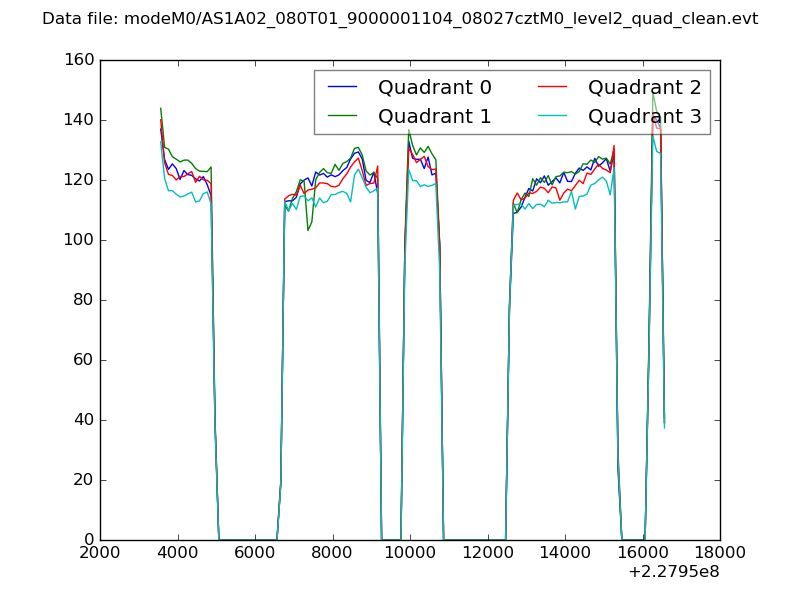 |
|
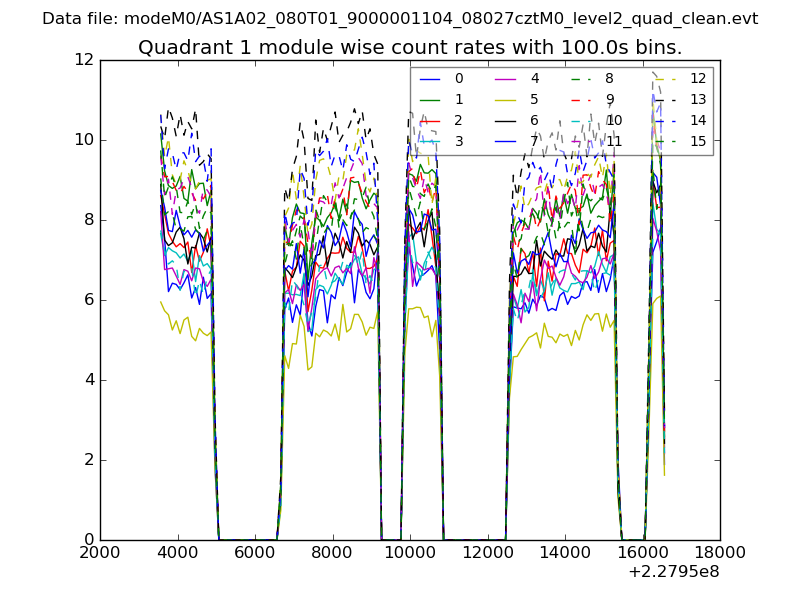
| Module-wise count rates for Quadrant A Data is divided into 100 sec bins |
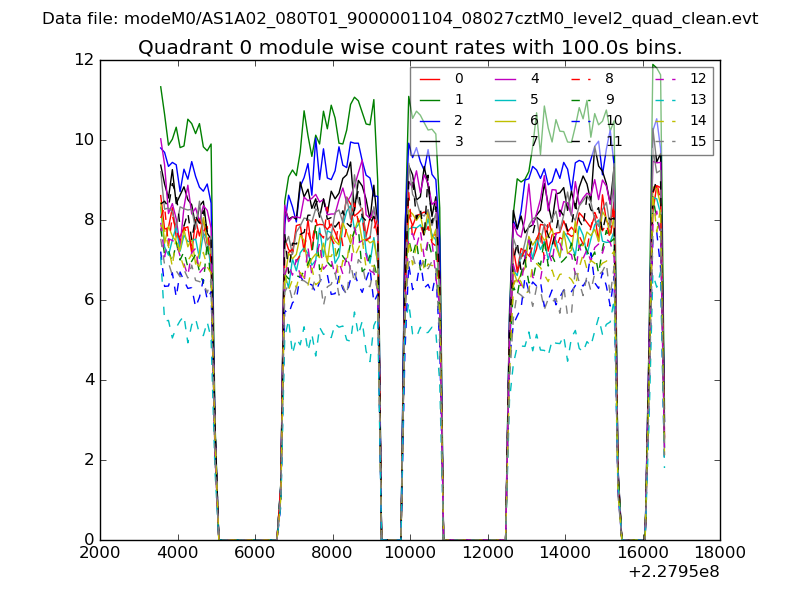 |
 |
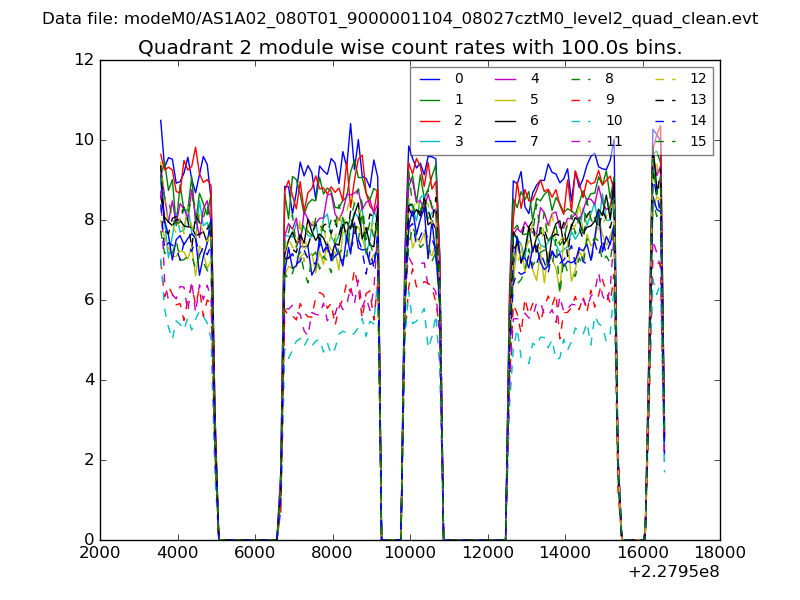
| Module-wise count rates for Quadrant B Data is divided into 100 sec bins |
 |
 |
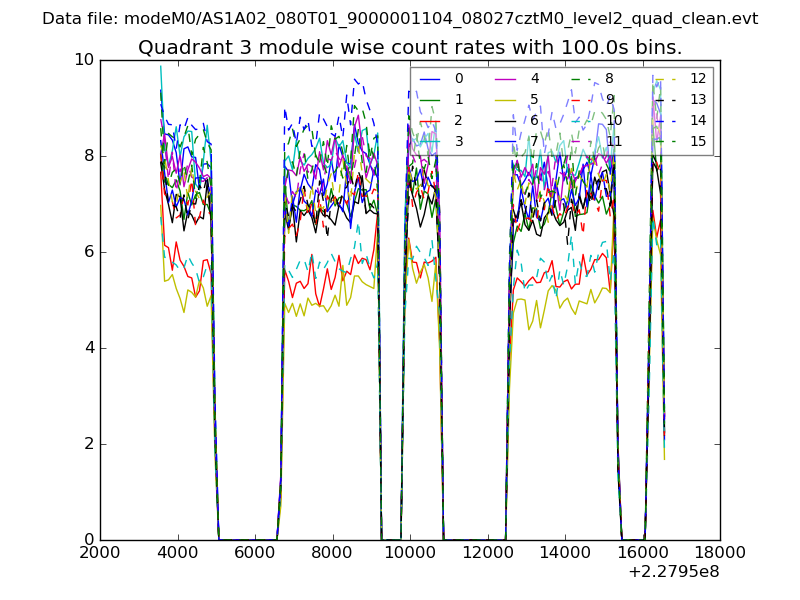
| Module-wise count rates for Quadrant C Data is divided into 100 sec bins |
 |
 |
| Module-wise count rates for Quadrant D Data is divided into 100 sec bins |
 |
 |
| Parameter | Plot |
|---|---|
| CZT HV Monitor | 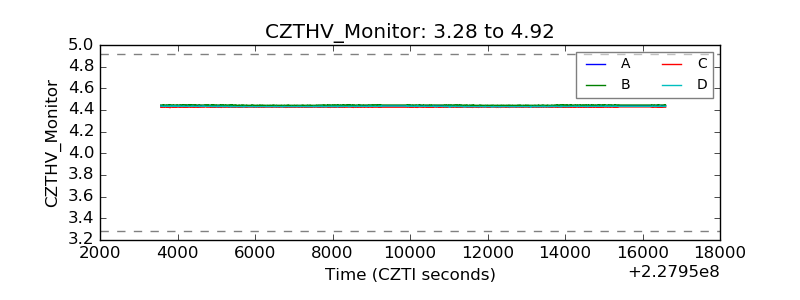 |
| D_VDD | 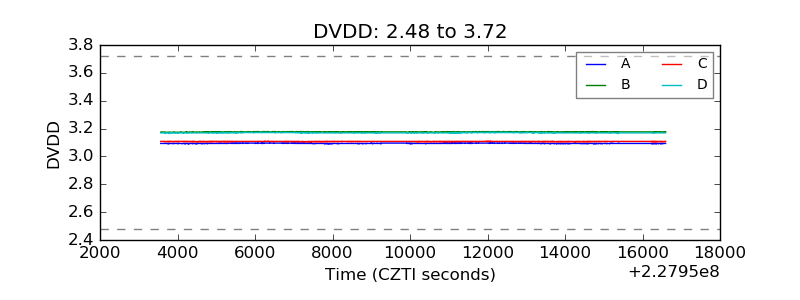 |
| Temperature 1 | 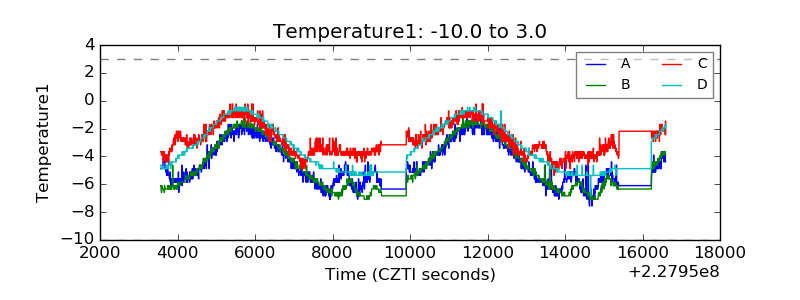 |
| Veto HV Monitor | 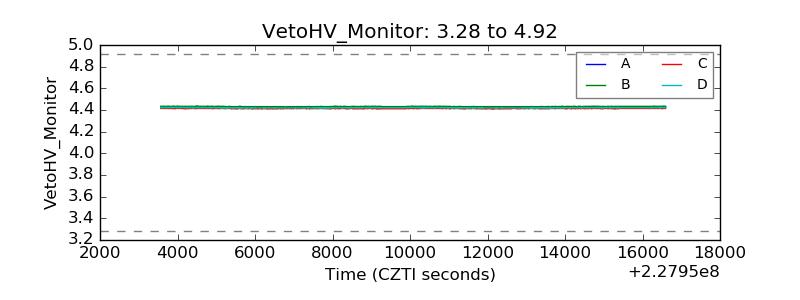 |
| Veto LLD | 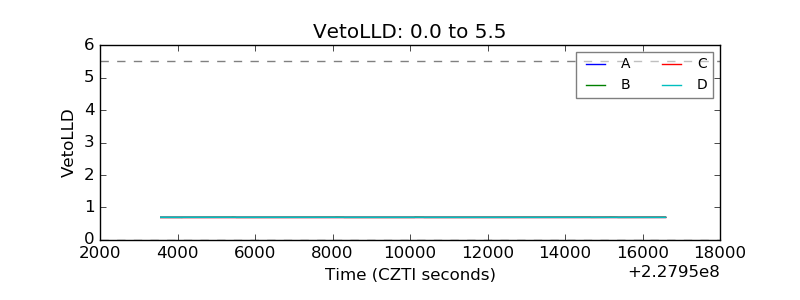 |
| Alpha Counter | 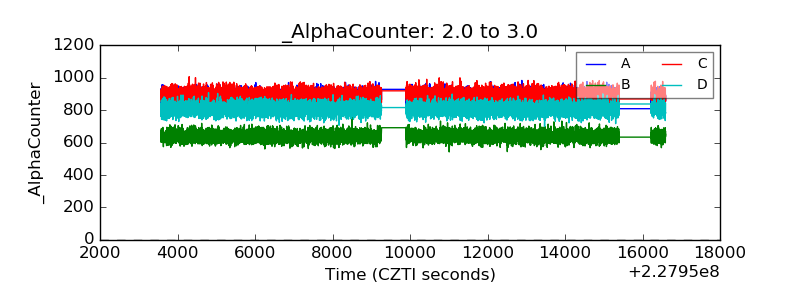 |
| _CPM_Rate | 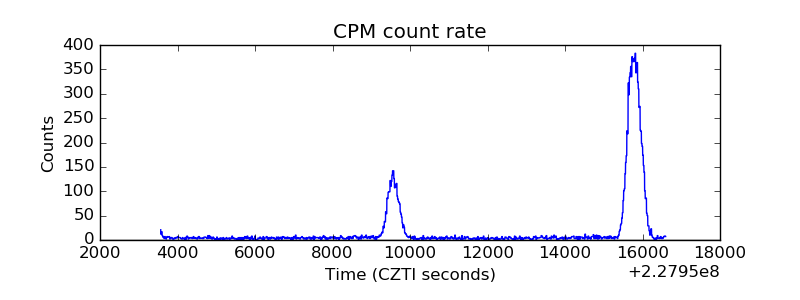 |
| CZT Counter | 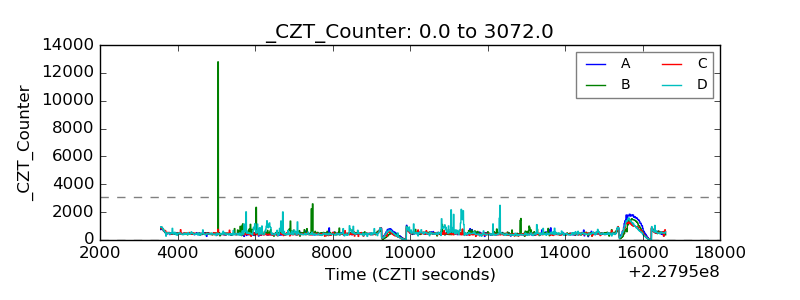 |
| +2.5 Volts monitor | 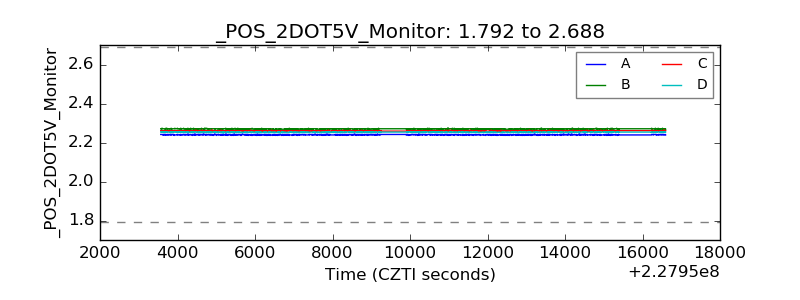 |
| +5 Volts monitor |  |
| _ROLL_ROT | 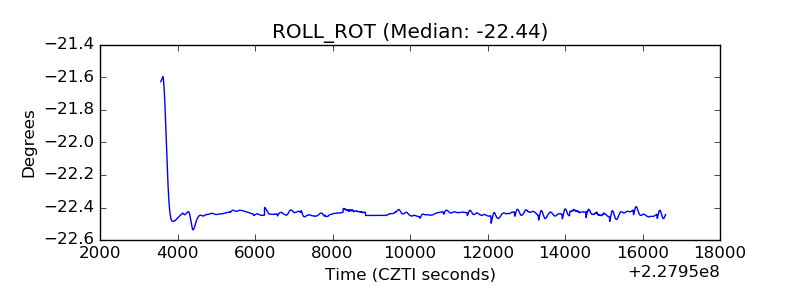 |
| _Roll_DEC | 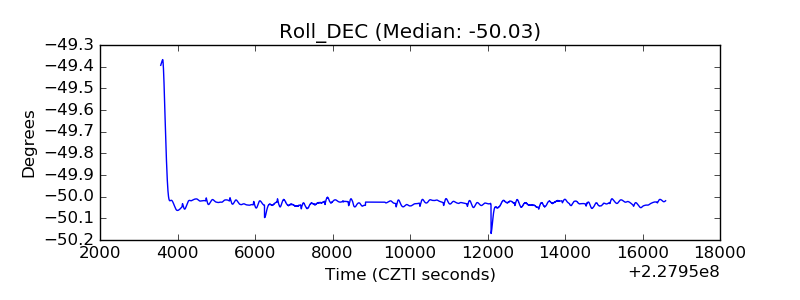 |
| _Roll_RA | 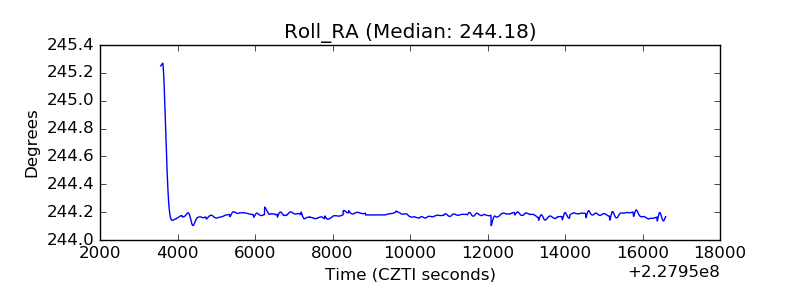 |
| Veto Counter | 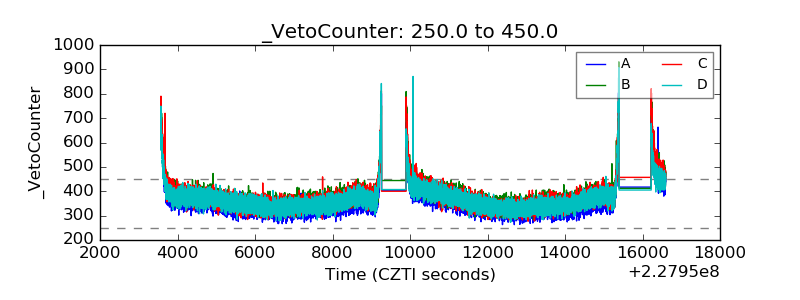 |