| Param | Original file | Final file |
|---|---|---|
| Filename | modeM0/AS1A02_080T01_9000001104_08028cztM0_level2.evt | modeM0/AS1A02_080T01_9000001104_08028cztM0_level2_quad_clean.evt |
| Size (bytes) | 498,968,640 | 67,872,960 |
| Size | 475.9 MB | 64.7 MB |
| Events in quadrant A | 3,103,758 | 409,787 |
| Events in quadrant B | 3,711,438 | 406,709 |
| Events in quadrant C | 2,970,761 | 402,329 |
| Events in quadrant D | 4,878,177 | 376,652 |
| Mode SS | |||
|---|---|---|---|
| Quadrant | BADHDUFLAG | Total packets | Discarded packets |
| A | 0 | 134 | 0 |
| B | 0 | 134 | 0 |
| C | 0 | 134 | 0 |
| D | 0 | 134 | 0 |
| Mode M0 | |||
|---|---|---|---|
| Quadrant | BADHDUFLAG | Total packets | Discarded packets |
| A | 0 | 13614 | 2 |
| B | 0 | 15276 | 1 |
| C | 0 | 13434 | 1 |
| D | 0 | 18915 | 1 |
| Mode M9 | |||
|---|---|---|---|
| Quadrant | BADHDUFLAG | Total packets | Discarded packets |
| A | 0 | 10 | 0 |
| B | 0 | 10 | 0 |
| C | 0 | 10 | 0 |
| D | 0 | 10 | 0 |
| Quadrant | Total seconds | Saturated seconds | Saturation percentage |
|---|---|---|---|
| A | 6587 | 48 | 0.728708% |
| B | 6587 | 221 | 3.355093% |
| C | 6587 | 31 | 0.470624% |
| D | 6587 | 347 | 5.267952% |
Noise dominated data is calculated using 1-second bins in cleaned event files. If a bin has >2000 counts, and if more than 50% of those come from <1% of pixels, then it is considered to be noise-dominated and hence unusable.
| Quadrant | # 1 sec bins | Bins with >0 counts | Bins with >2000 counts | High rate bins dominated by noise | Noise dominated (total time) | Noise dominated (detector-on time) | Marked lightcurve |
|---|---|---|---|---|---|---|---|
| A | 7607 | 6588 | 2 | 2 | 0.03% | 0.03% | 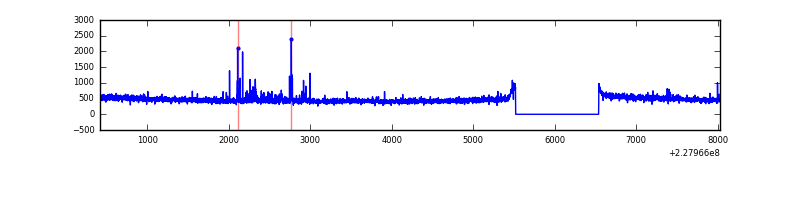 |
| B | 7607 | 6588 | 122 | 122 | 1.60% | 1.85% | 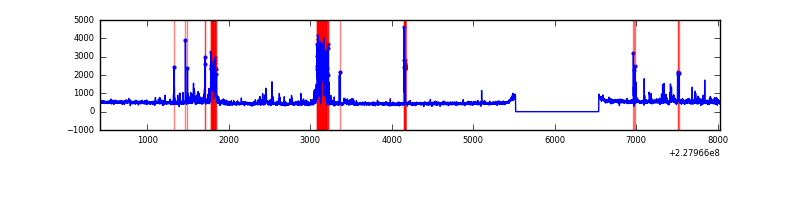 |
| C | 7607 | 6588 | 0 | 0 | 0.00% | 0.00% | 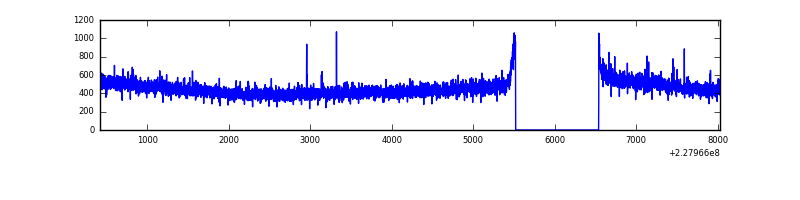 |
| D | 7607 | 6588 | 272 | 272 | 3.58% | 4.13% | 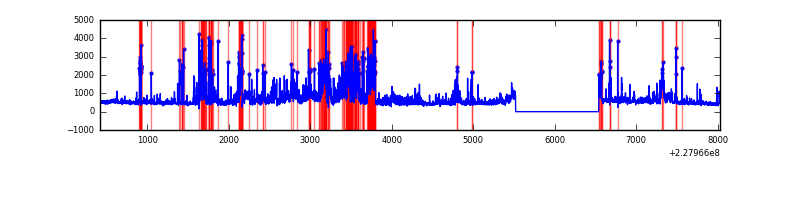 |
Top three noisy pixels from each quadrant. If the there are fewer than three noisy pixels in the level2.evt file, extra rows are filled as -1
| Pixel properties | Quadrant properties | ||||||
|---|---|---|---|---|---|---|---|
| Quadrant | DetID | PixID | Counts | Sigma | Mean | Median | Sigma |
| A | 4 | 2 | 67865 | 422.93 | 781 | 764 | 158.7 |
| A | 13 | 248 | 8711 | 50.09 | 781 | 764 | 158.7 |
| A | 0 | 226 | 7345 | 41.48 | 781 | 764 | 158.7 |
| B | 4 | 239 | 422781 | 2882.28 | 775 | 757 | 146.4 |
| B | 11 | 51 | 90587 | 613.51 | 775 | 757 | 146.4 |
| B | 10 | 16 | 63214 | 426.56 | 775 | 757 | 146.4 |
| C | 1 | 16 | 19196 | 105.43 | 755 | 757 | 174.9 |
| C | 13 | 61 | 5749 | 28.54 | 755 | 757 | 174.9 |
| C | 12 | 4 | 3905 | 18.0 | 755 | 757 | 174.9 |
| D | 2 | 250 | 1374464 | 6972.7 | 738 | 719 | 197.0 |
| D | 13 | 169 | 328815 | 1665.31 | 738 | 719 | 197.0 |
| D | 1 | 52 | 208390 | 1054.07 | 738 | 719 | 197.0 |
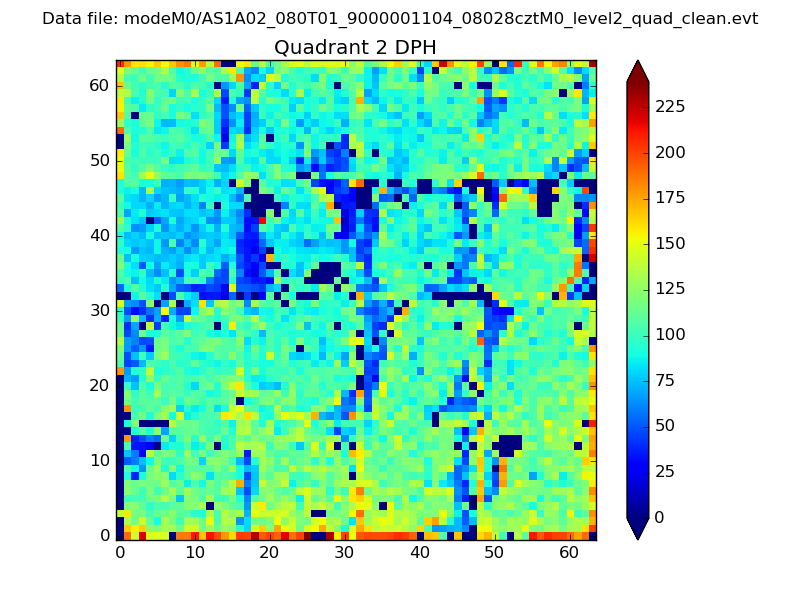
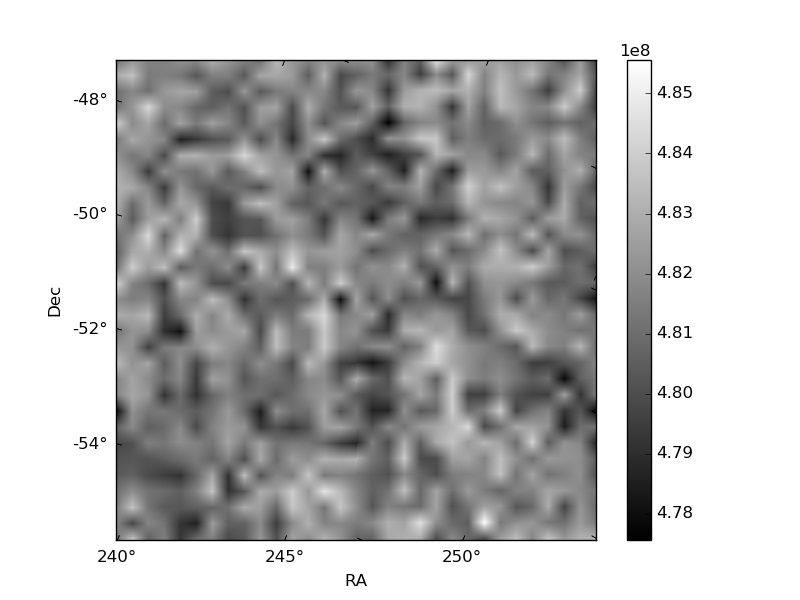
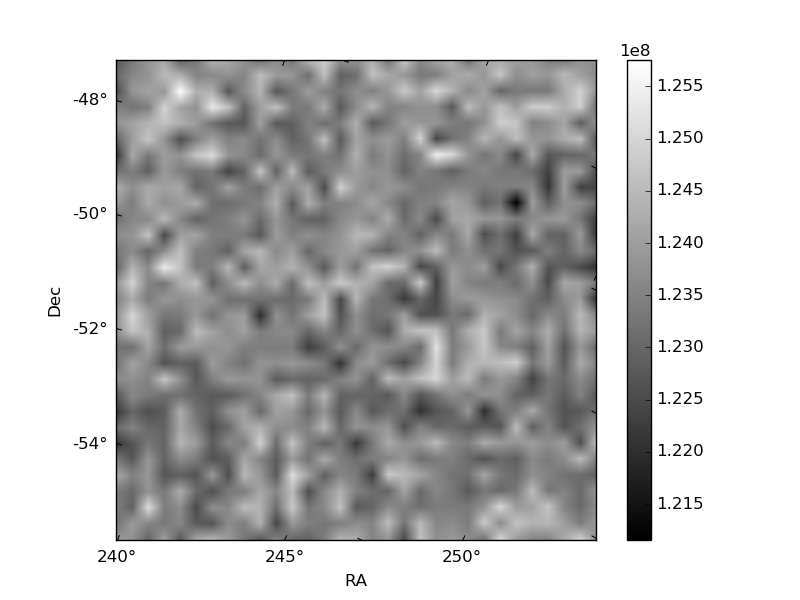
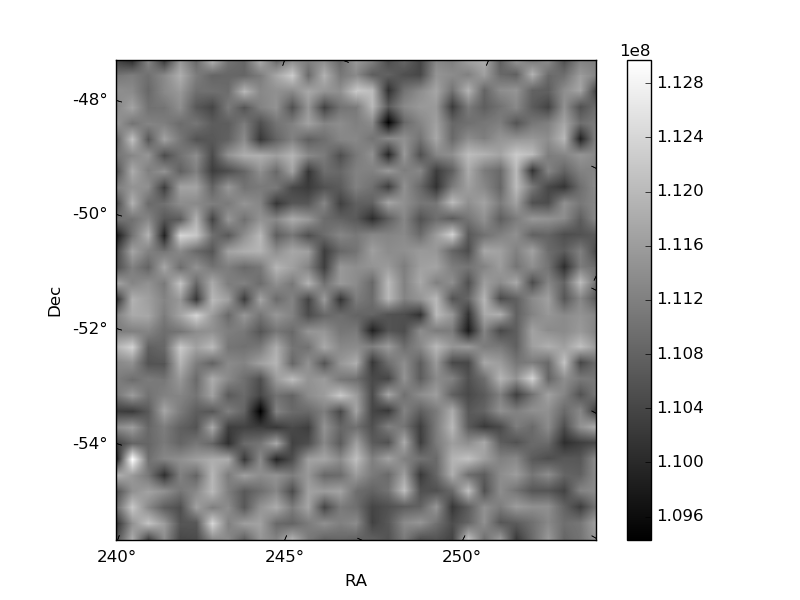
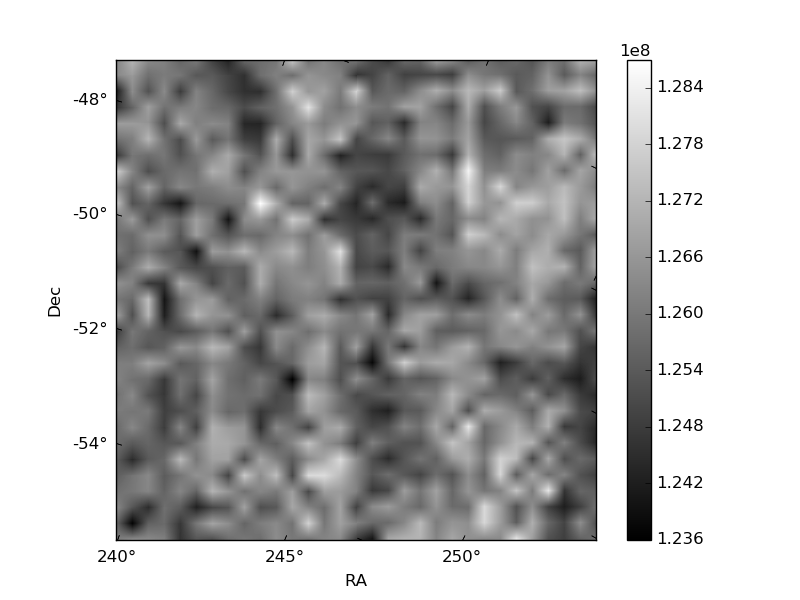
Histogram calculated using DETX and DETY for each event in the final _common_clean file
| Quadrant A | 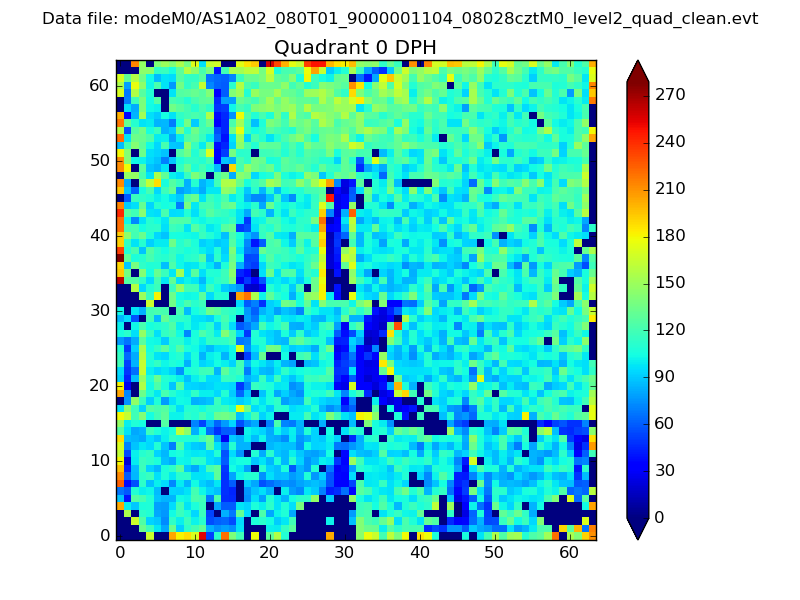 |
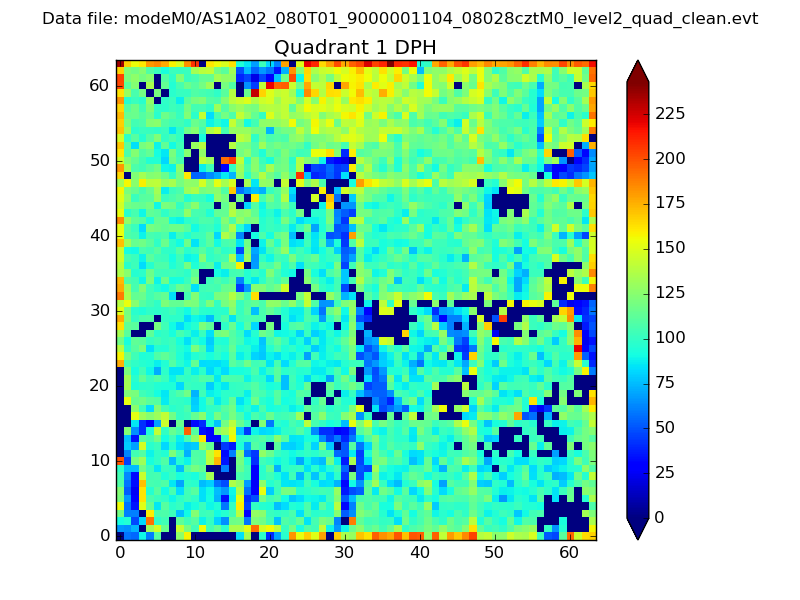 |
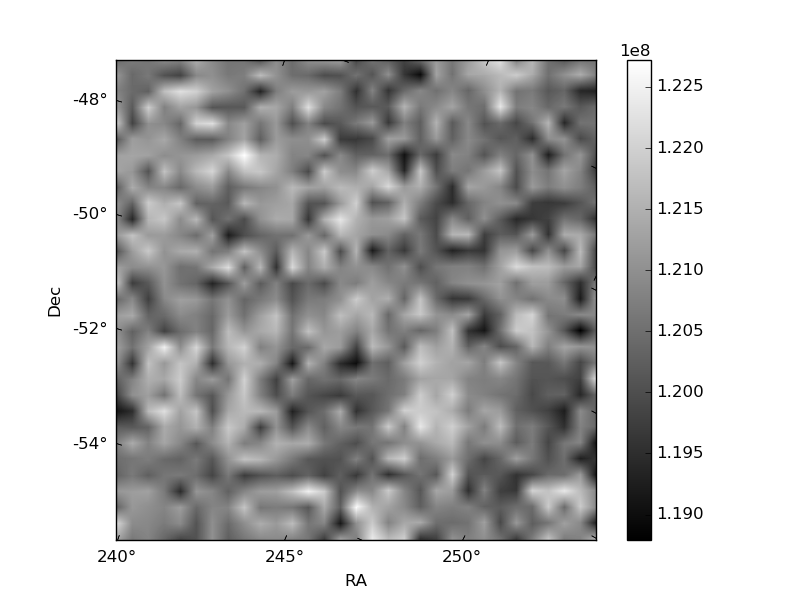
Quadrant B |
|---|---|---|---|
| Quadrant D | 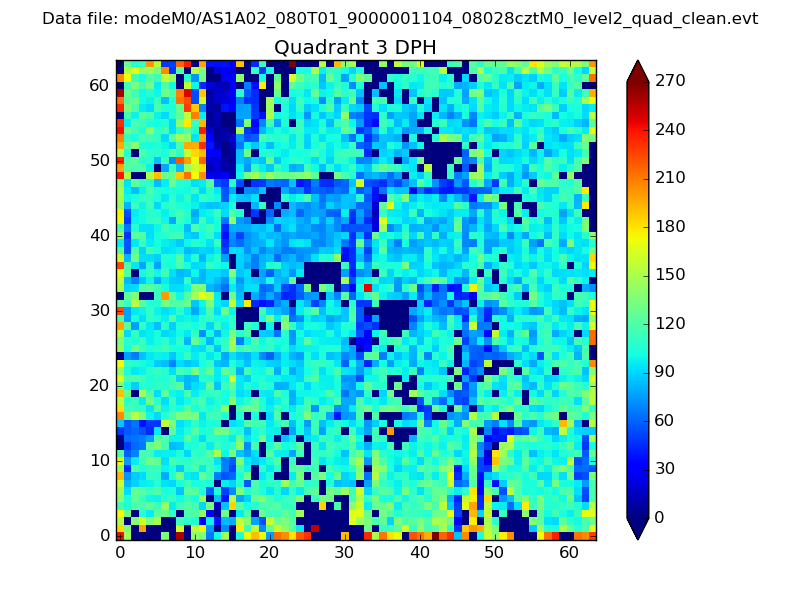 |
 |
Quadrant C |
| Plot type | Count rate plots | Images |
|---|---|---|
| Comparison with Poisson distribution Blue bars denote a histogram of data divided into 1 sec bins. Red curve is a Poisson curve with rate = median count rate of data. |
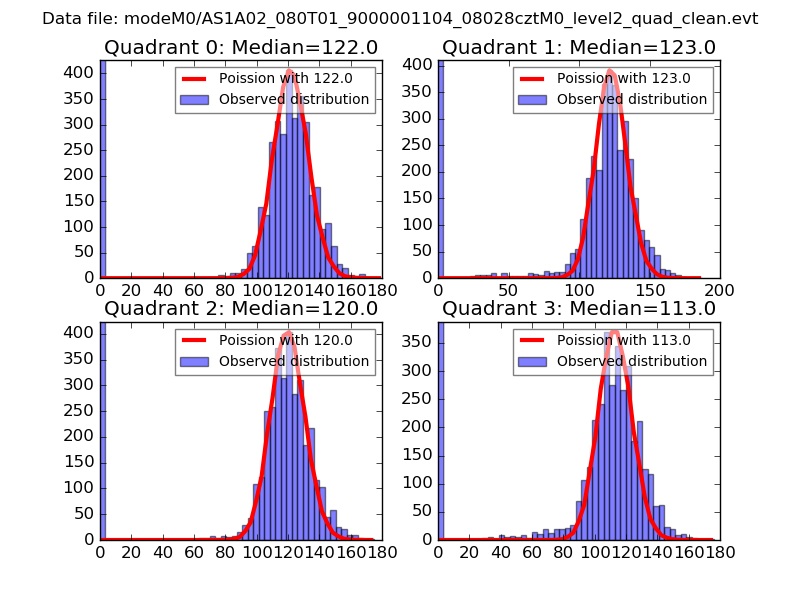 |
 |
| Quadrant-wise count rates Data is divided into 100 sec bins |
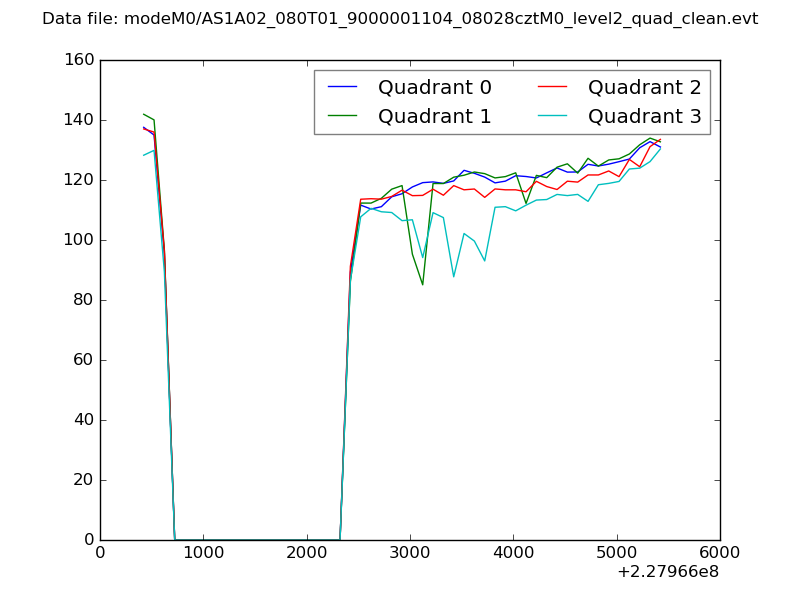 |
|
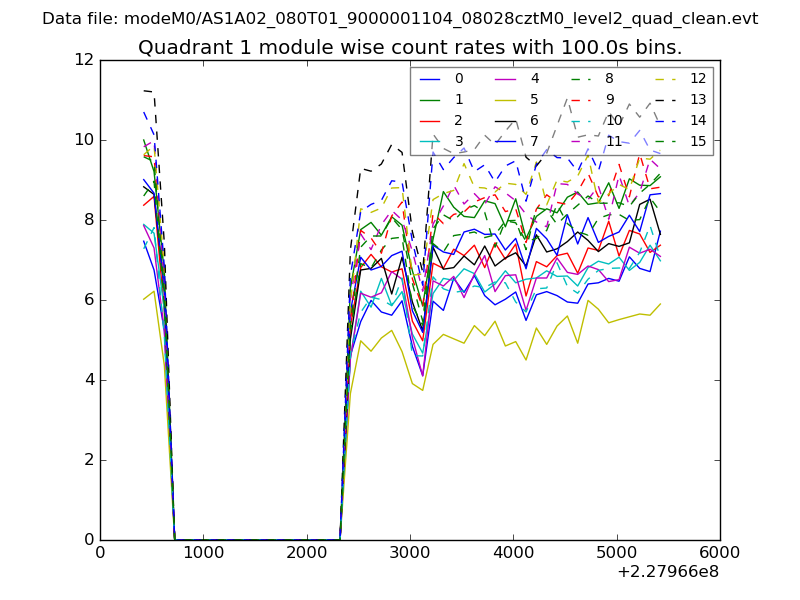
| Module-wise count rates for Quadrant A Data is divided into 100 sec bins |
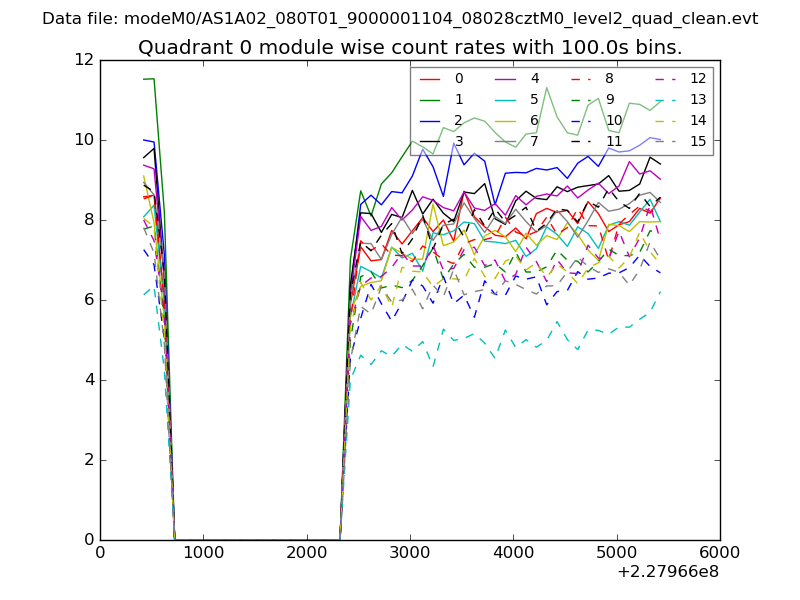 |
 |
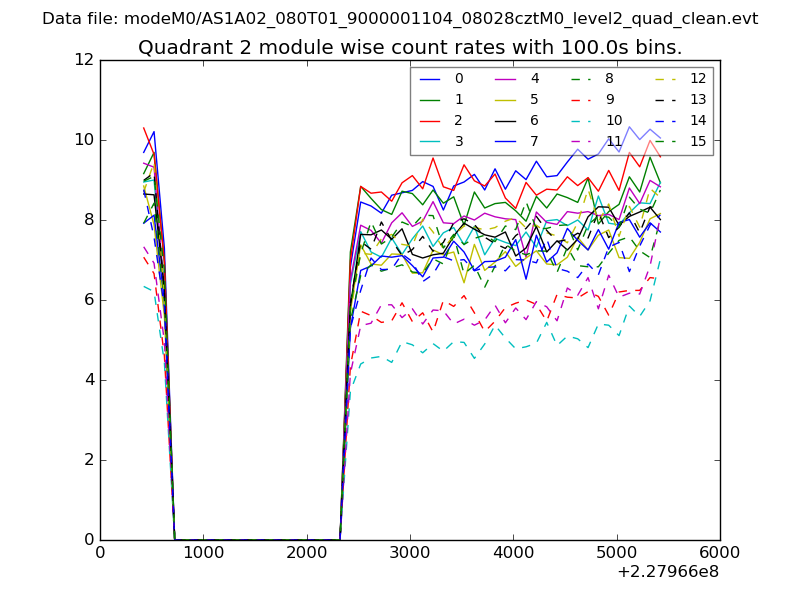
| Module-wise count rates for Quadrant B Data is divided into 100 sec bins |
 |
 |
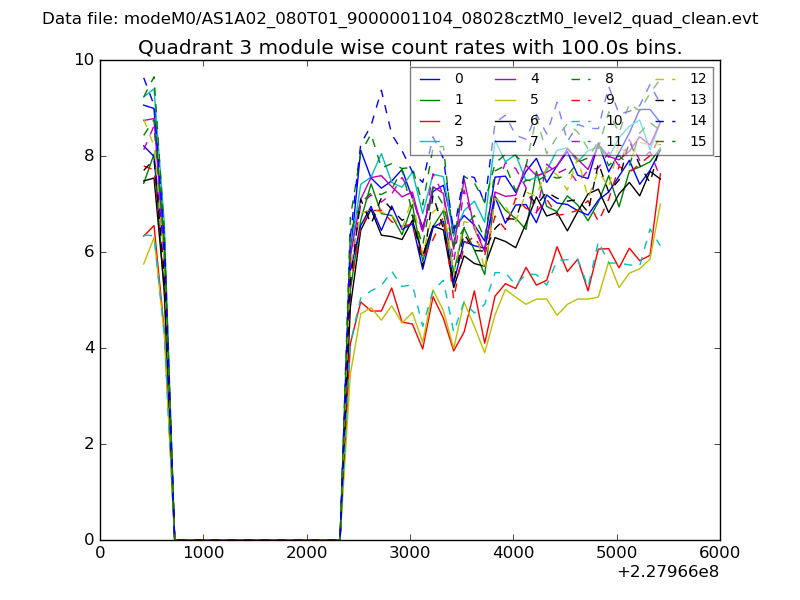
| Module-wise count rates for Quadrant C Data is divided into 100 sec bins |
 |
 |
| Module-wise count rates for Quadrant D Data is divided into 100 sec bins |
 |
 |
| Parameter | Plot |
|---|---|
| CZT HV Monitor | 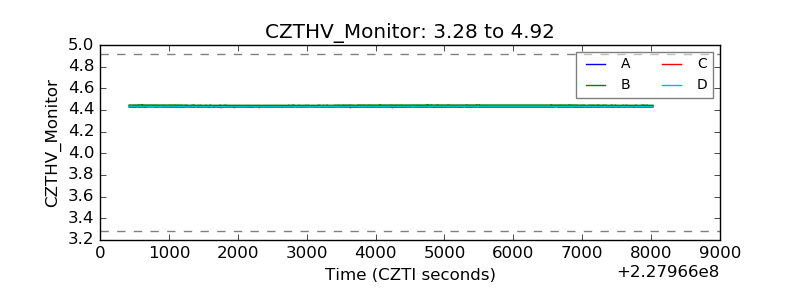 |
| D_VDD | 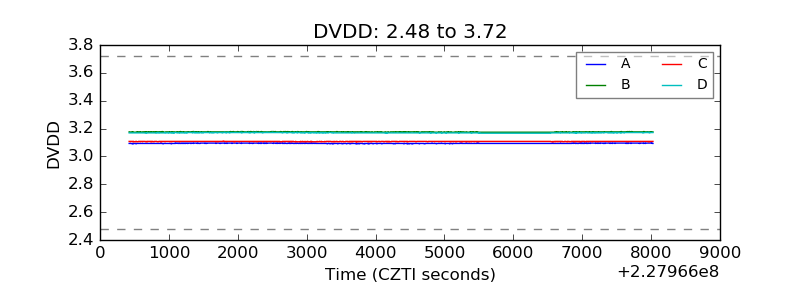 |
| Temperature 1 | 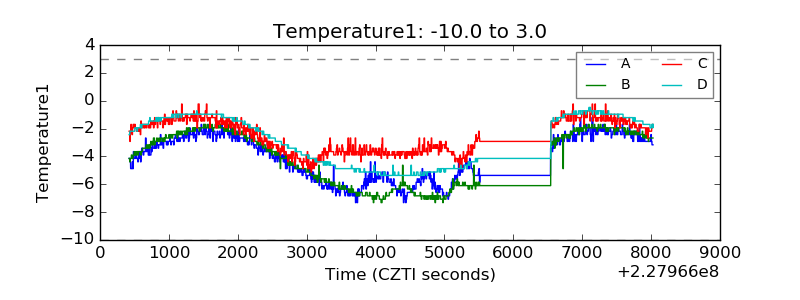 |
| Veto HV Monitor | 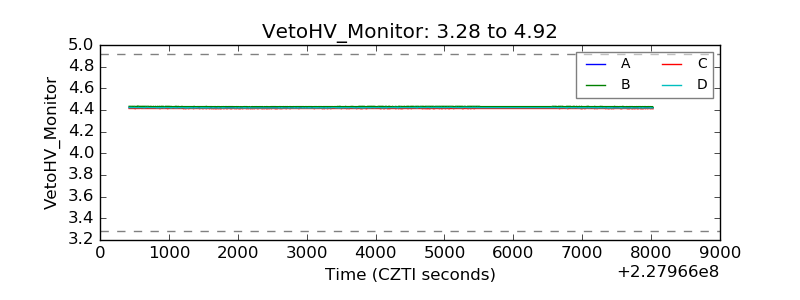 |
| Veto LLD | 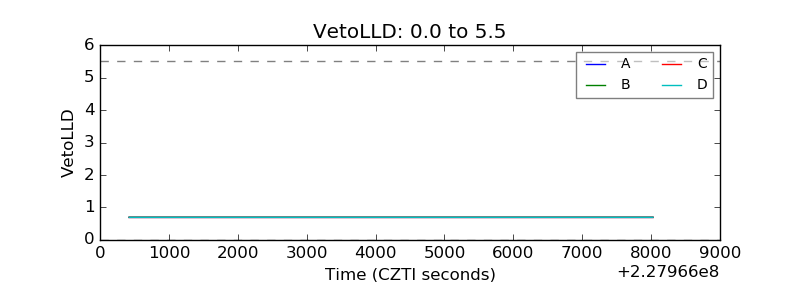 |
| Alpha Counter | 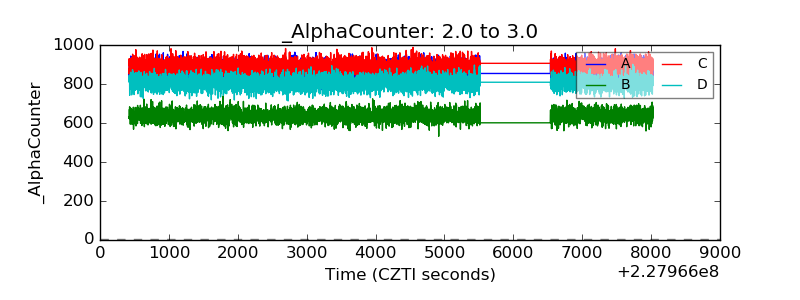 |
| _CPM_Rate | 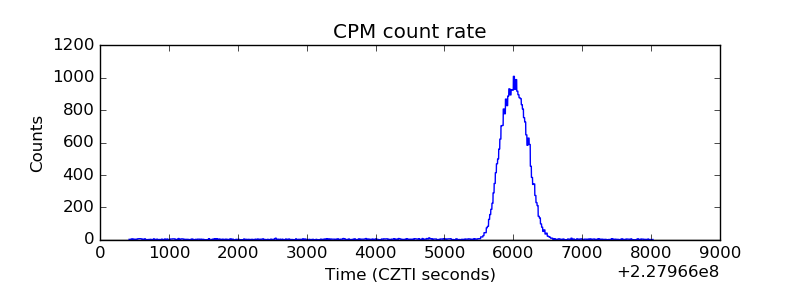 |
| CZT Counter | 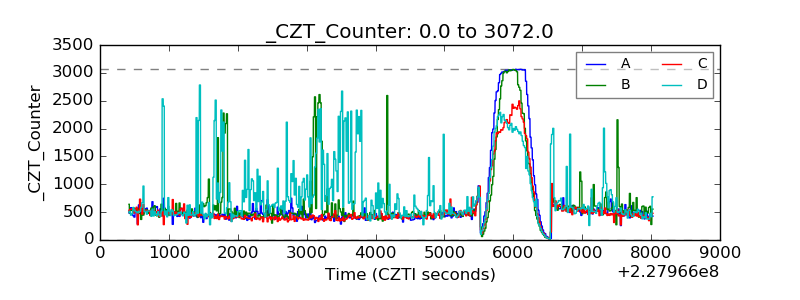 |
| +2.5 Volts monitor |  |
| +5 Volts monitor |  |
| _ROLL_ROT | 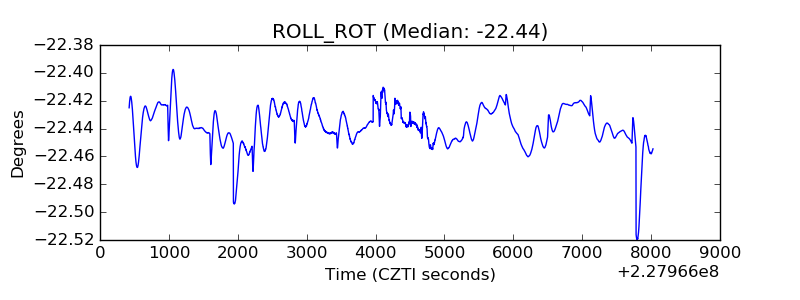 |
| _Roll_DEC | 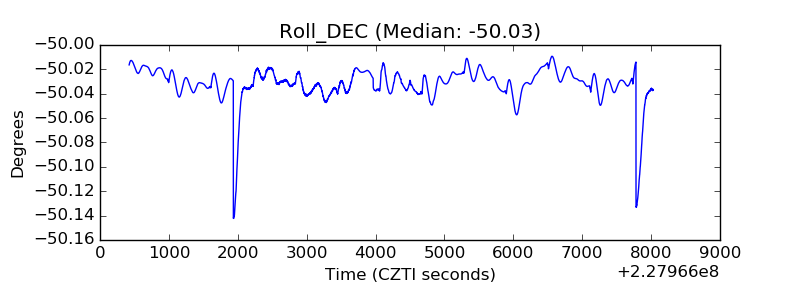 |
| _Roll_RA | 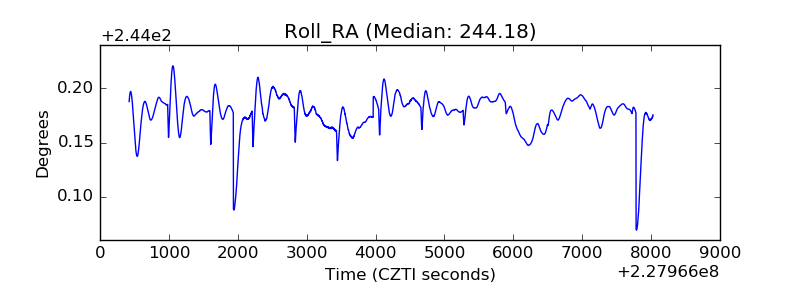 |
| Veto Counter | 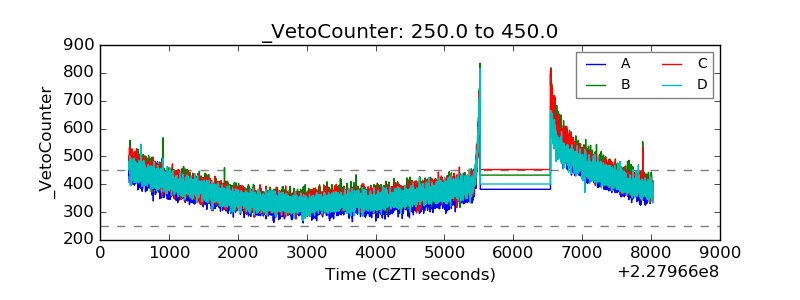 |