| Param | Original file | Final file |
|---|---|---|
| Filename | modeM0/AS1A02_080T01_9000001104_08030cztM0_level2.evt | modeM0/AS1A02_080T01_9000001104_08030cztM0_level2_quad_clean.evt |
| Size (bytes) | 496,998,720 | 68,751,360 |
| Size | 474.0 MB | 65.6 MB |
| Events in quadrant A | 3,137,595 | 419,970 |
| Events in quadrant B | 3,573,885 | 420,760 |
| Events in quadrant C | 3,037,179 | 409,222 |
| Events in quadrant D | 4,866,353 | 382,915 |
| Mode SS | |||
|---|---|---|---|
| Quadrant | BADHDUFLAG | Total packets | Discarded packets |
| A | 0 | 132 | 0 |
| B | 0 | 132 | 0 |
| C | 0 | 132 | 0 |
| D | 0 | 132 | 0 |
| Mode M0 | |||
|---|---|---|---|
| Quadrant | BADHDUFLAG | Total packets | Discarded packets |
| A | 0 | 13647 | 4 |
| B | 0 | 14876 | 3 |
| C | 0 | 13422 | 3 |
| D | 0 | 19105 | 3 |
| Mode M9 | |||
|---|---|---|---|
| Quadrant | BADHDUFLAG | Total packets | Discarded packets |
| A | 0 | 12 | 0 |
| B | 0 | 12 | 0 |
| C | 0 | 12 | 0 |
| D | 0 | 13 | 0 |
| Quadrant | Total seconds | Saturated seconds | Saturation percentage |
|---|---|---|---|
| A | 6425 | 92 | 1.431907% |
| B | 6425 | 151 | 2.350195% |
| C | 6425 | 57 | 0.887160% |
| D | 6425 | 482 | 7.501946% |
Noise dominated data is calculated using 1-second bins in cleaned event files. If a bin has >2000 counts, and if more than 50% of those come from <1% of pixels, then it is considered to be noise-dominated and hence unusable.
| Quadrant | # 1 sec bins | Bins with >0 counts | Bins with >2000 counts | High rate bins dominated by noise | Noise dominated (total time) | Noise dominated (detector-on time) | Marked lightcurve |
|---|---|---|---|---|---|---|---|
| A | 7560 | 6427 | 4 | 4 | 0.05% | 0.06% | 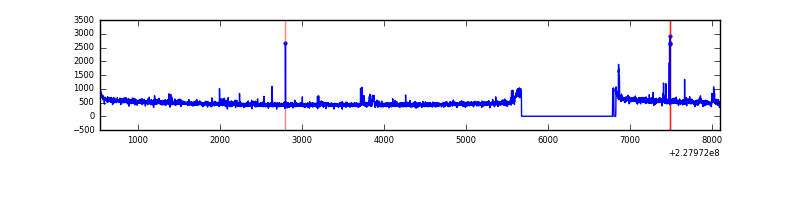 |
| B | 7560 | 6427 | 50 | 50 | 0.66% | 0.78% | 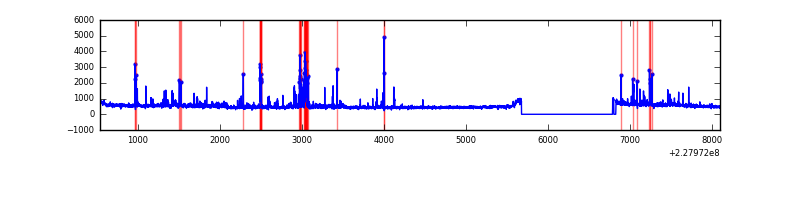 |
| C | 7560 | 6427 | 0 | 0 | 0.00% | 0.00% | 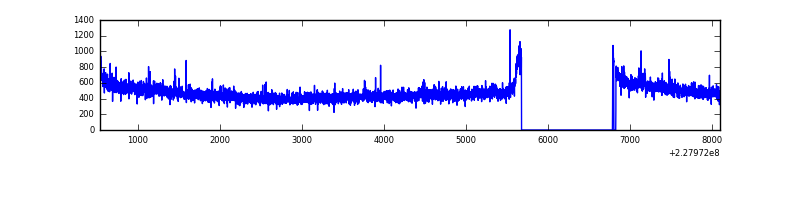 |
| D | 7560 | 6427 | 282 | 282 | 3.73% | 4.39% |  |
Top three noisy pixels from each quadrant. If the there are fewer than three noisy pixels in the level2.evt file, extra rows are filled as -1
| Pixel properties | Quadrant properties | ||||||
|---|---|---|---|---|---|---|---|
| Quadrant | DetID | PixID | Counts | Sigma | Mean | Median | Sigma |
| A | 15 | 234 | 47217 | 290.08 | 789 | 771 | 160.1 |
| A | 4 | 2 | 30782 | 187.44 | 789 | 771 | 160.1 |
| A | 0 | 226 | 7586 | 42.56 | 789 | 771 | 160.1 |
| B | 4 | 239 | 256038 | 1727.52 | 791 | 772 | 147.8 |
| B | 11 | 51 | 66170 | 442.58 | 791 | 772 | 147.8 |
| B | 10 | 16 | 42766 | 284.2 | 791 | 772 | 147.8 |
| C | 1 | 16 | 56957 | 320.13 | 761 | 766 | 175.5 |
| C | 13 | 61 | 5931 | 29.43 | 761 | 766 | 175.5 |
| C | 8 | 128 | 4322 | 20.26 | 761 | 766 | 175.5 |
| D | 2 | 250 | 1442252 | 7484.24 | 736 | 720 | 192.6 |
| D | 1 | 52 | 315739 | 1635.54 | 736 | 720 | 192.6 |
| D | 13 | 169 | 135761 | 701.11 | 736 | 720 | 192.6 |
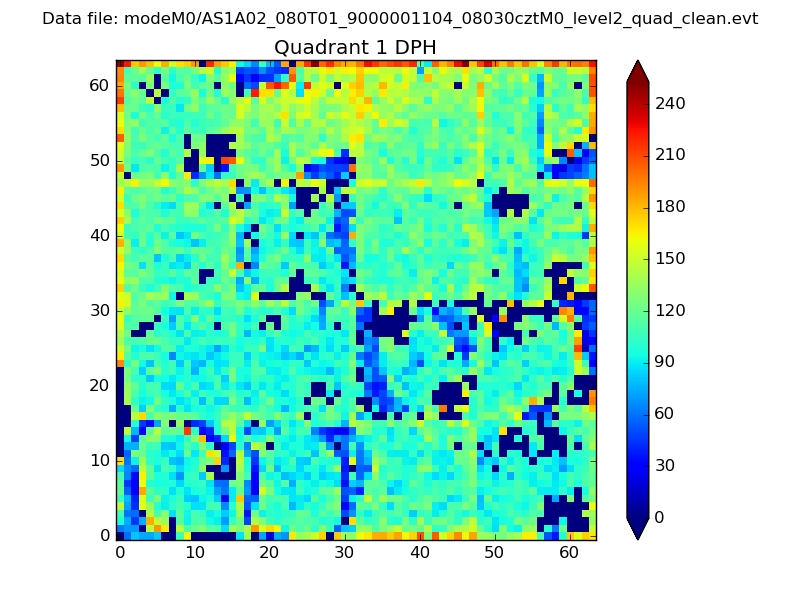
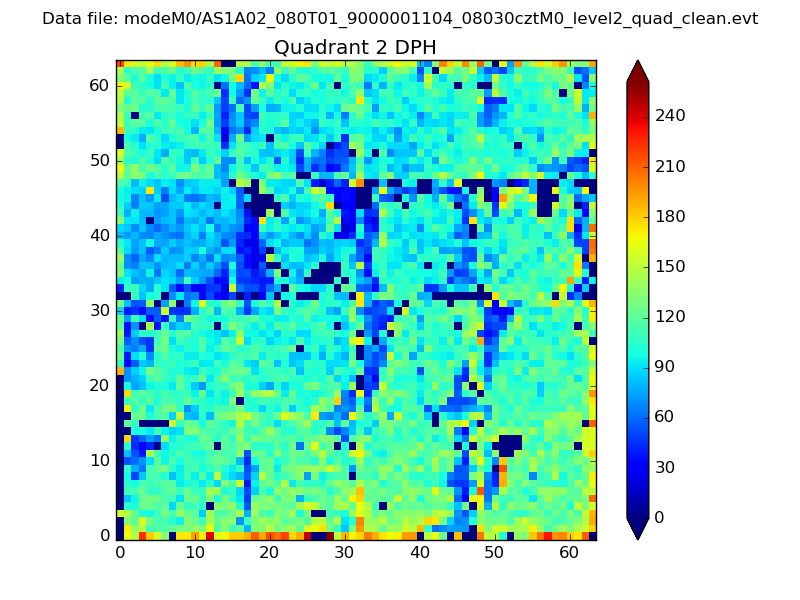
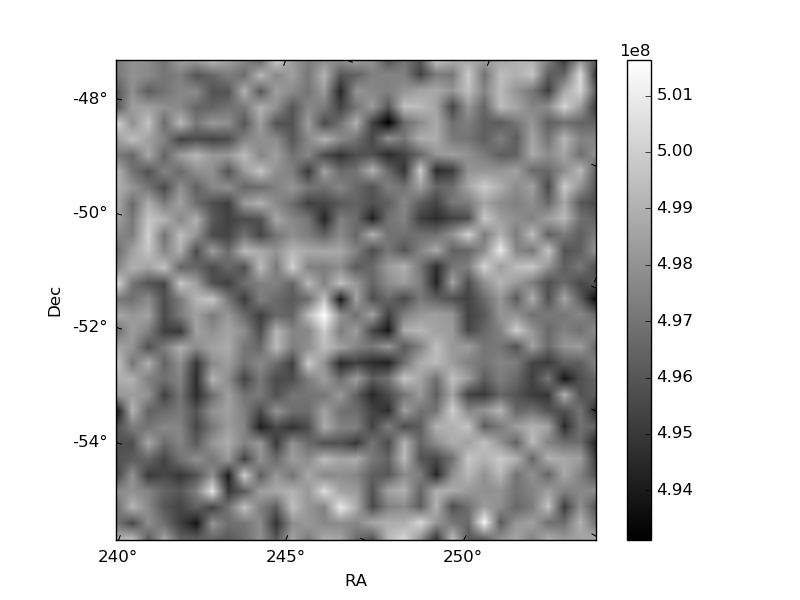
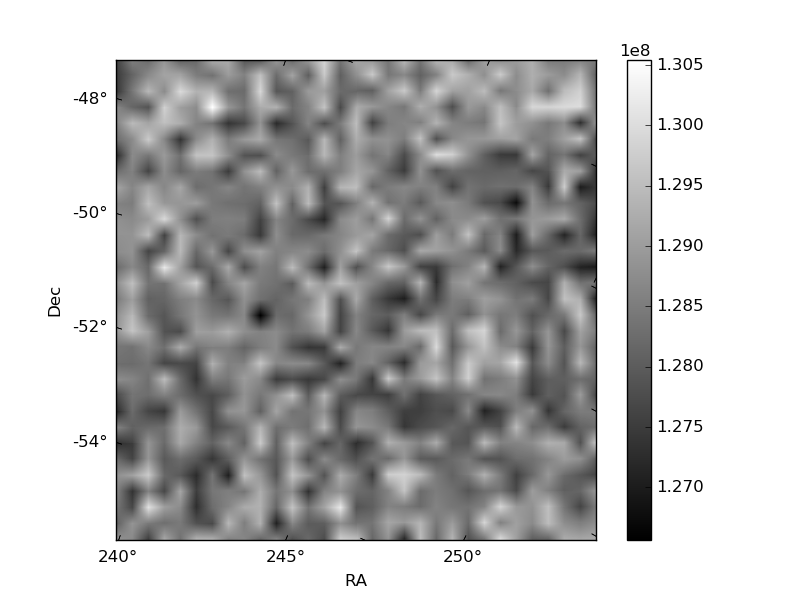
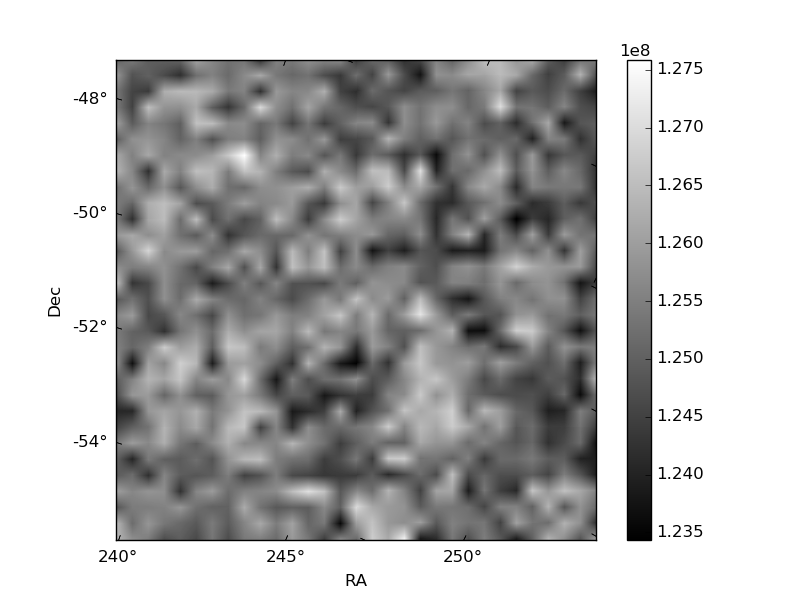
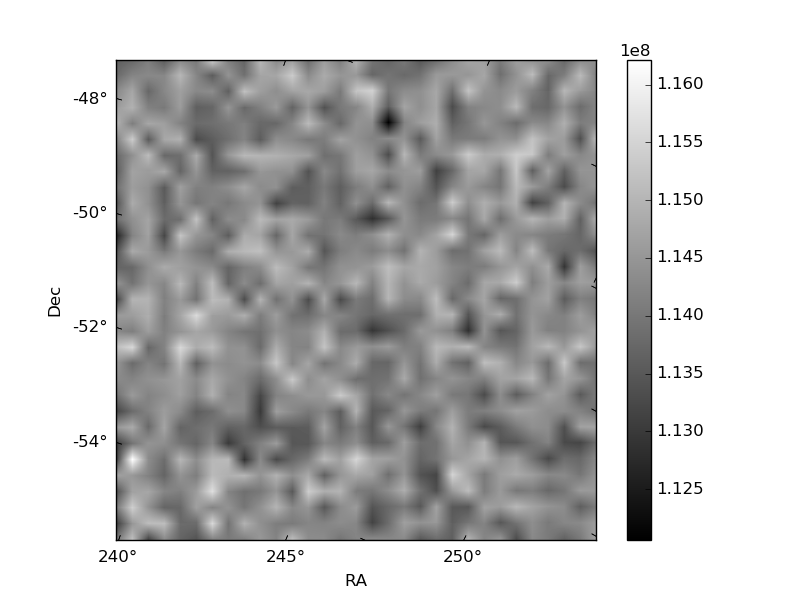
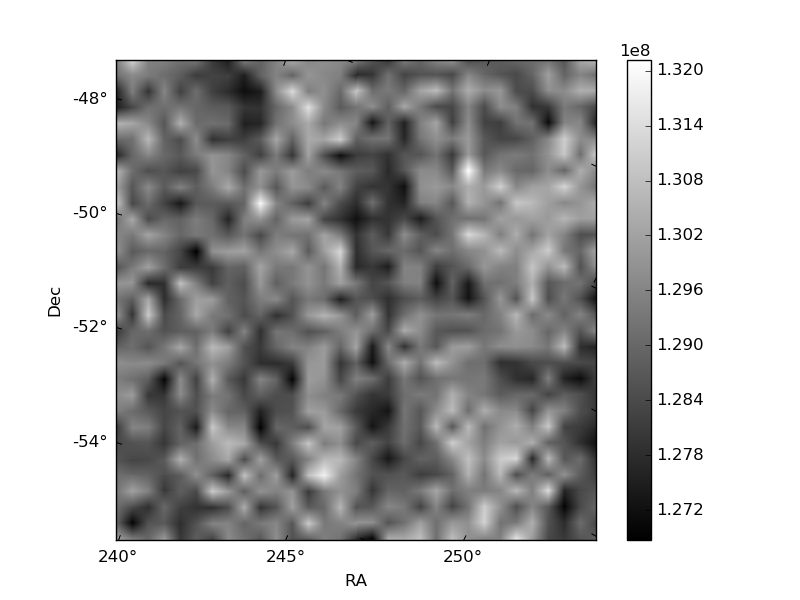
Histogram calculated using DETX and DETY for each event in the final _common_clean file
| Quadrant A | 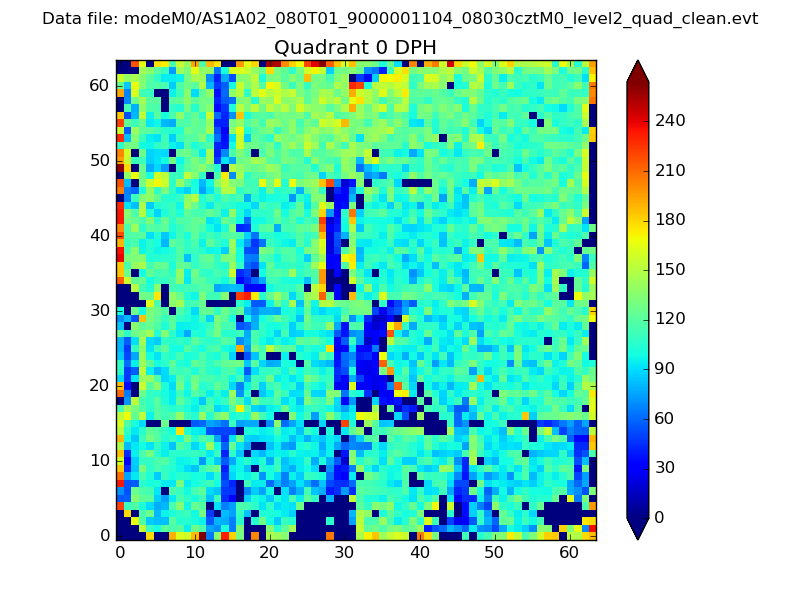 |
 |
Quadrant B |
|---|---|---|---|
| Quadrant D | 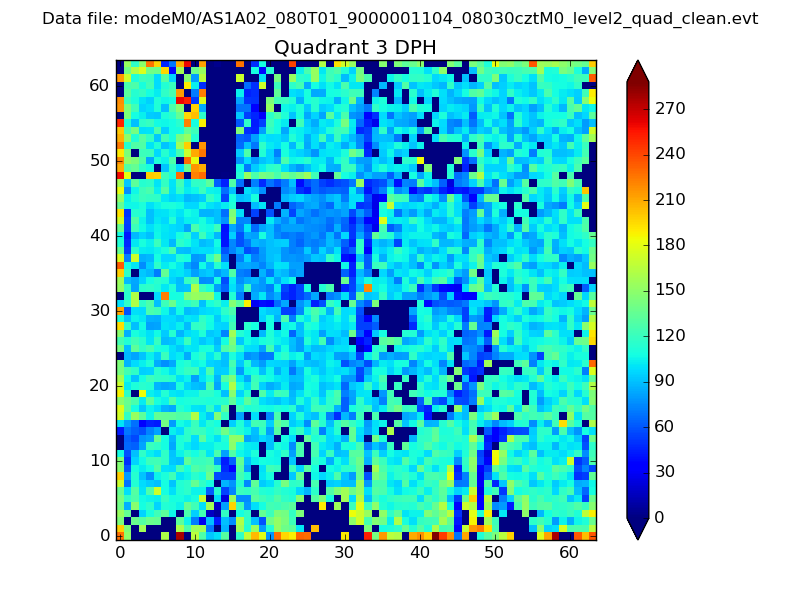 |
 |
Quadrant C |
| Plot type | Count rate plots | Images |
|---|---|---|
| Comparison with Poisson distribution Blue bars denote a histogram of data divided into 1 sec bins. Red curve is a Poisson curve with rate = median count rate of data. |
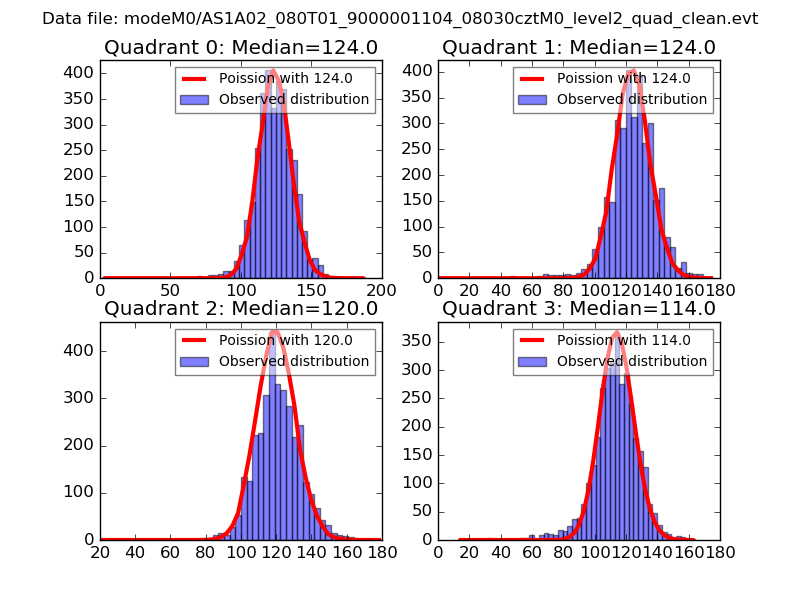 |
 |
| Quadrant-wise count rates Data is divided into 100 sec bins |
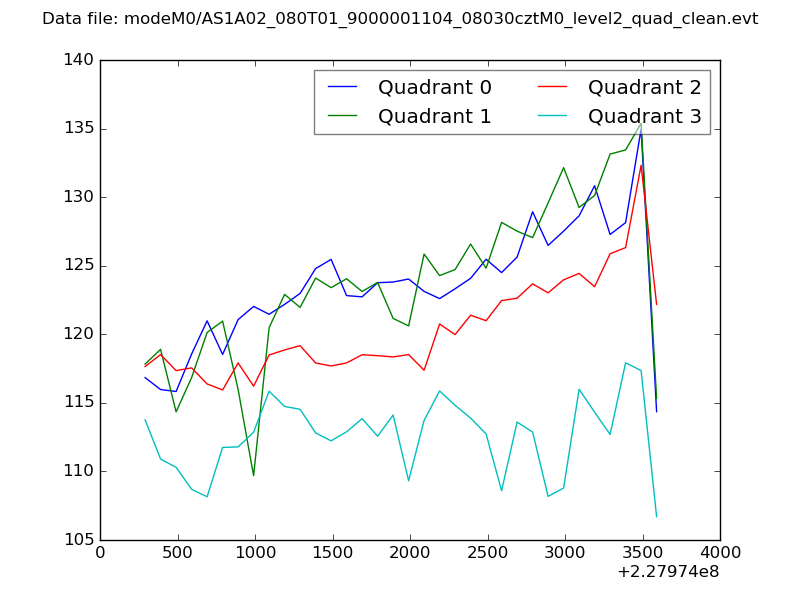 |
|
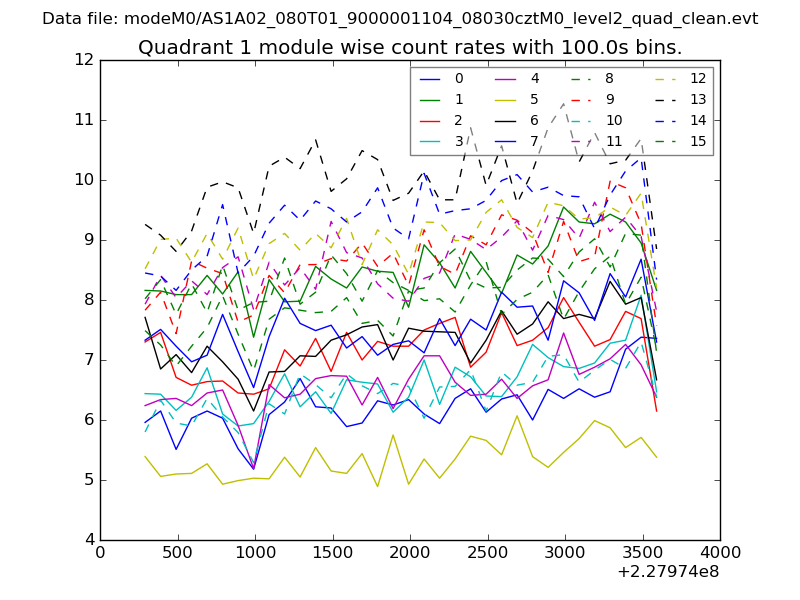
| Module-wise count rates for Quadrant A Data is divided into 100 sec bins |
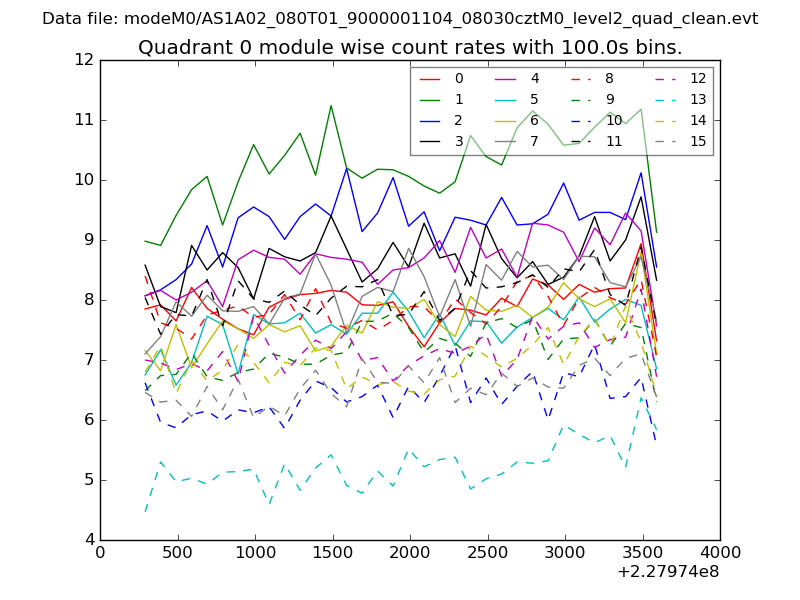 |
 |
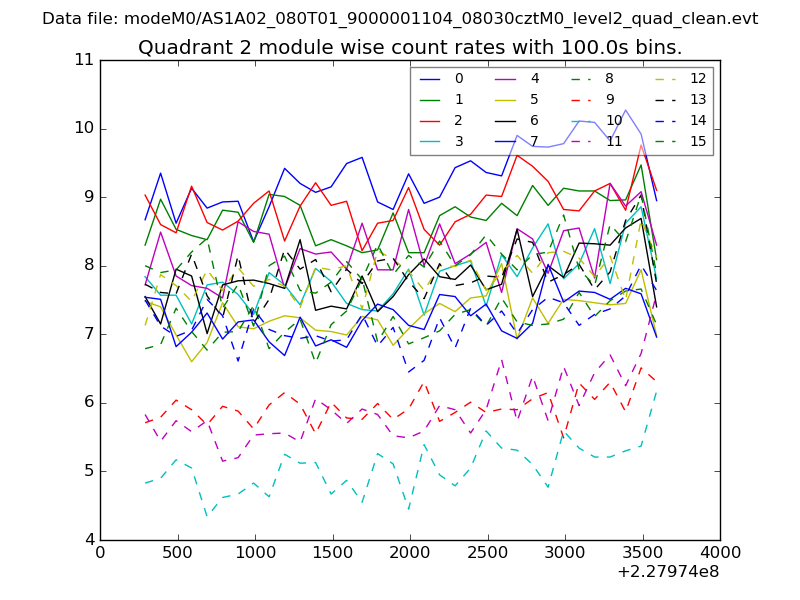
| Module-wise count rates for Quadrant B Data is divided into 100 sec bins |
 |
 |
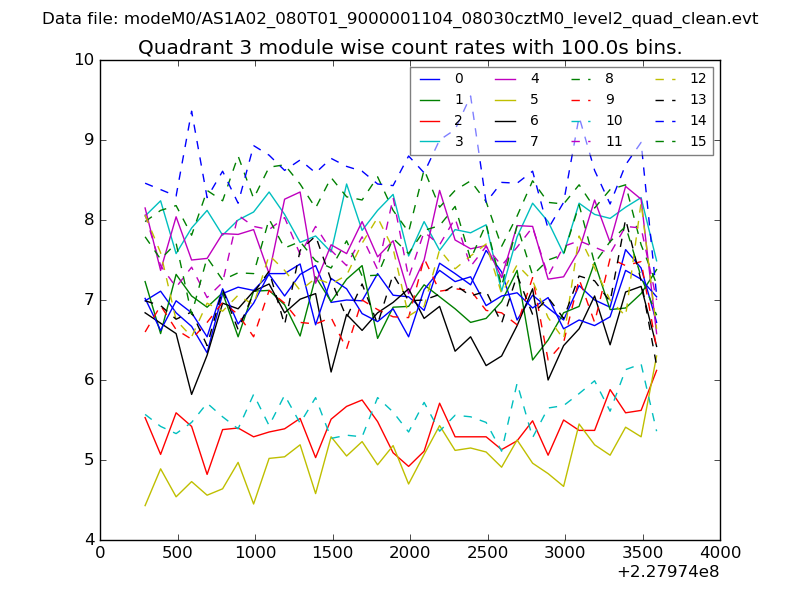
| Module-wise count rates for Quadrant C Data is divided into 100 sec bins |
 |
 |
| Module-wise count rates for Quadrant D Data is divided into 100 sec bins |
 |
 |
| Parameter | Plot |
|---|---|
| CZT HV Monitor | 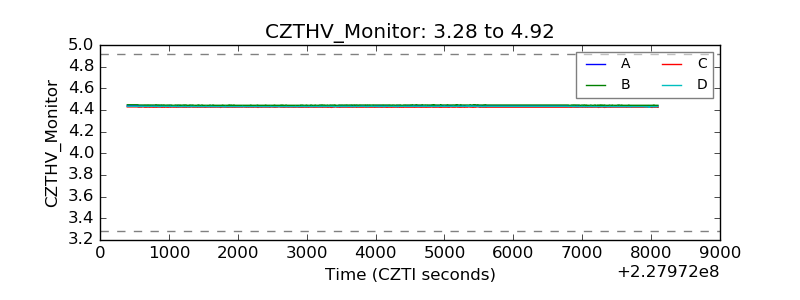 |
| D_VDD | 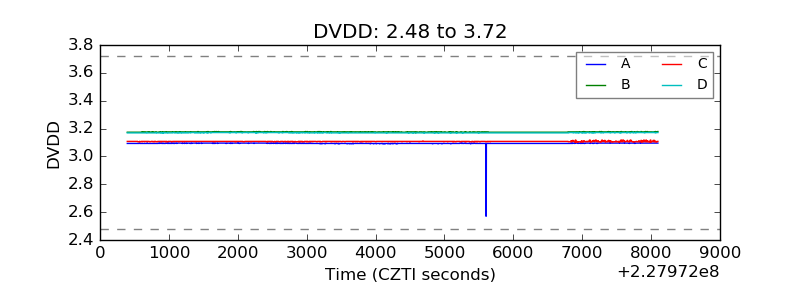 |
| Temperature 1 | 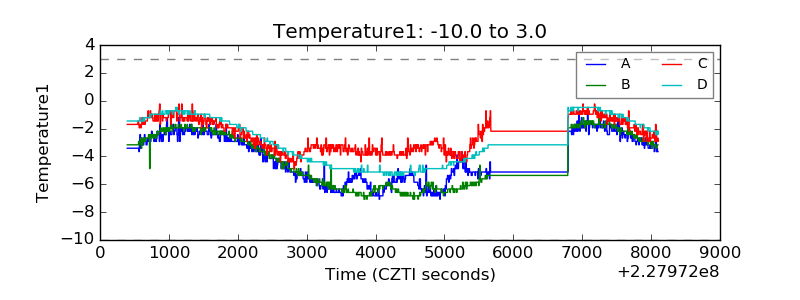 |
| Veto HV Monitor | 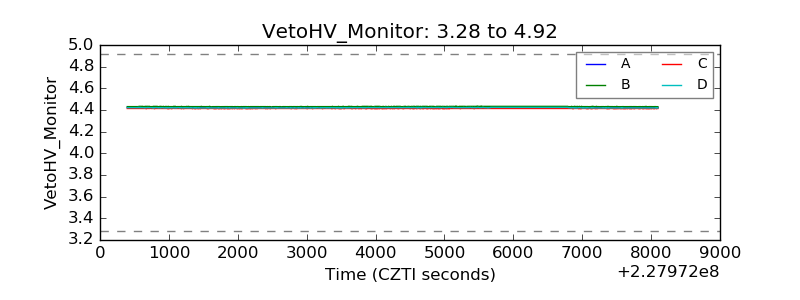 |
| Veto LLD | 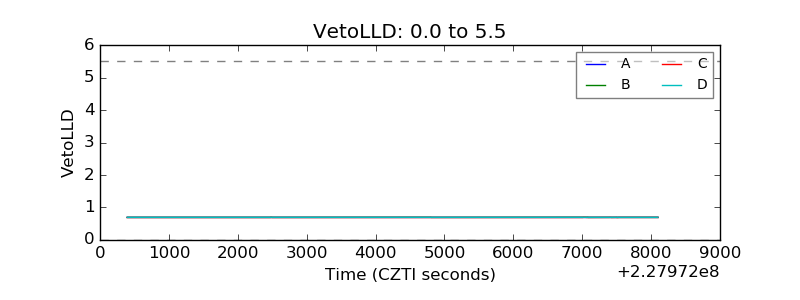 |
| Alpha Counter | 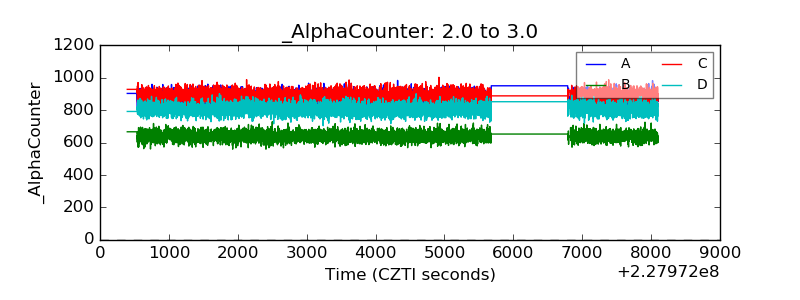 |
| _CPM_Rate | 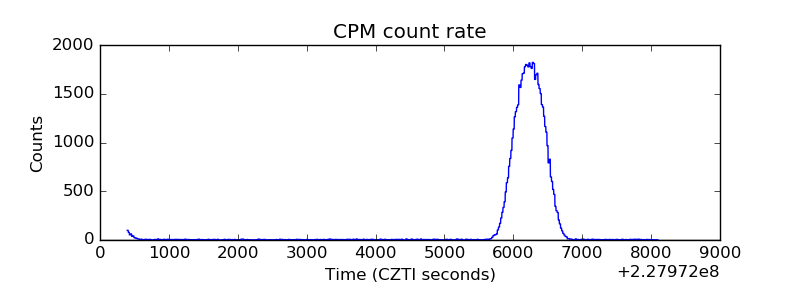 |
| CZT Counter | 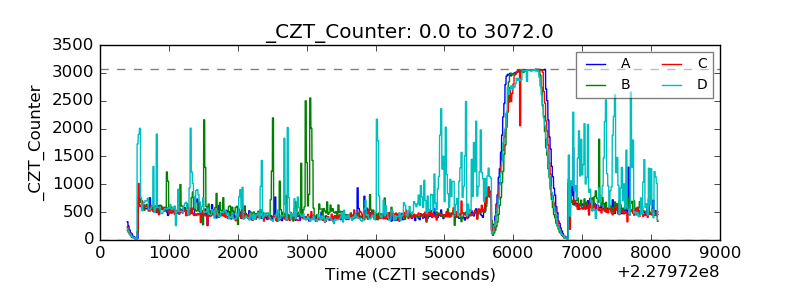 |
| +2.5 Volts monitor | 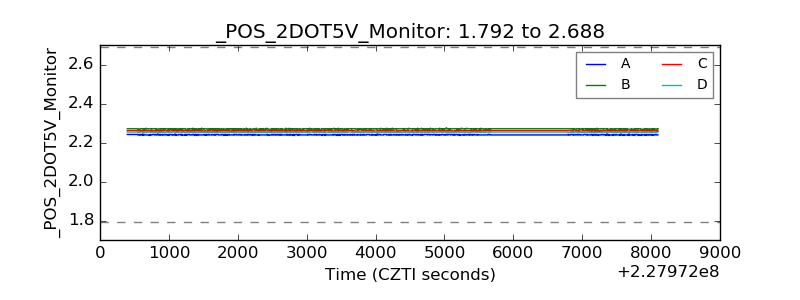 |
| +5 Volts monitor |  |
| _ROLL_ROT | 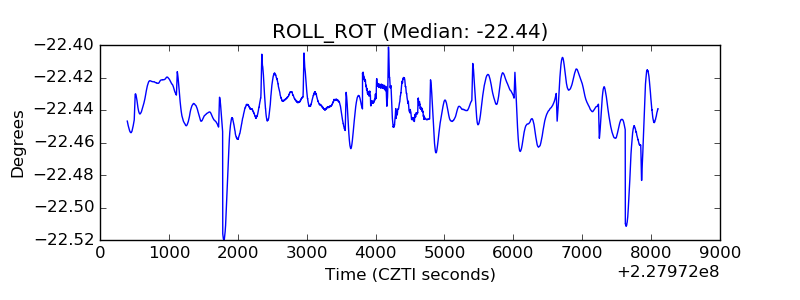 |
| _Roll_DEC | 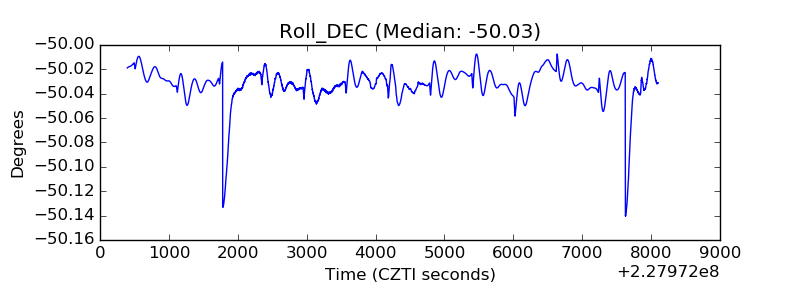 |
| _Roll_RA | 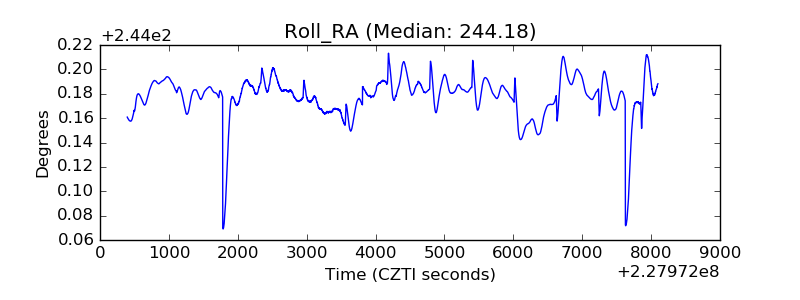 |
| Veto Counter | 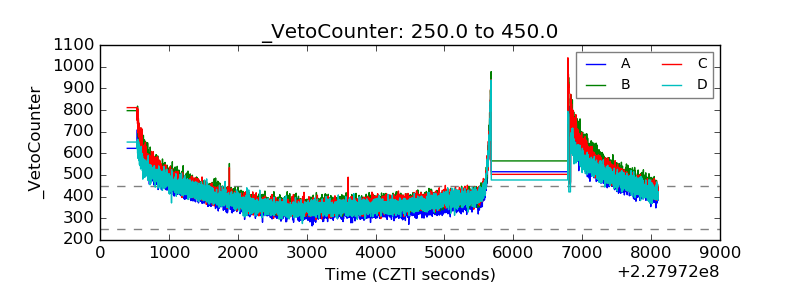 |