| Param | Original file | Final file |
|---|---|---|
| Filename | modeM0/AS1A02_080T01_9000001104_08031cztM0_level2.evt | modeM0/AS1A02_080T01_9000001104_08031cztM0_level2_quad_clean.evt |
| Size (bytes) | 562,878,720 | 80,179,200 |
| Size | 536.8 MB | 76.5 MB |
| Events in quadrant A | 3,246,000 | 524,271 |
| Events in quadrant B | 3,488,570 | 534,751 |
| Events in quadrant C | 3,010,719 | 510,428 |
| Events in quadrant D | 6,875,877 | 420,180 |
| Mode SS | |||
|---|---|---|---|
| Quadrant | BADHDUFLAG | Total packets | Discarded packets |
| A | 0 | 130 | 0 |
| B | 0 | 130 | 0 |
| C | 0 | 130 | 0 |
| D | 0 | 130 | 0 |
| Mode M0 | |||
|---|---|---|---|
| Quadrant | BADHDUFLAG | Total packets | Discarded packets |
| A | 0 | 13858 | 4 |
| B | 0 | 14516 | 3 |
| C | 0 | 13179 | 3 |
| D | 0 | 24799 | 3 |
| Mode M9 | |||
|---|---|---|---|
| Quadrant | BADHDUFLAG | Total packets | Discarded packets |
| A | 0 | 16 | 0 |
| B | 0 | 16 | 0 |
| C | 0 | 16 | 0 |
| D | 0 | 17 | 0 |
| Quadrant | Total seconds | Saturated seconds | Saturation percentage |
|---|---|---|---|
| A | 6265 | 101 | 1.612131% |
| B | 6265 | 137 | 2.186752% |
| C | 6265 | 32 | 0.510774% |
| D | 6265 | 1405 | 22.426177% |
Noise dominated data is calculated using 1-second bins in cleaned event files. If a bin has >2000 counts, and if more than 50% of those come from <1% of pixels, then it is considered to be noise-dominated and hence unusable.
| Quadrant | # 1 sec bins | Bins with >0 counts | Bins with >2000 counts | High rate bins dominated by noise | Noise dominated (total time) | Noise dominated (detector-on time) | Marked lightcurve |
|---|---|---|---|---|---|---|---|
| A | 7535 | 6267 | 15 | 15 | 0.20% | 0.24% | 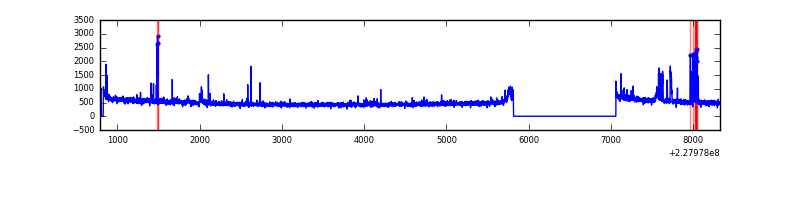 |
| B | 7535 | 6267 | 44 | 44 | 0.58% | 0.70% | 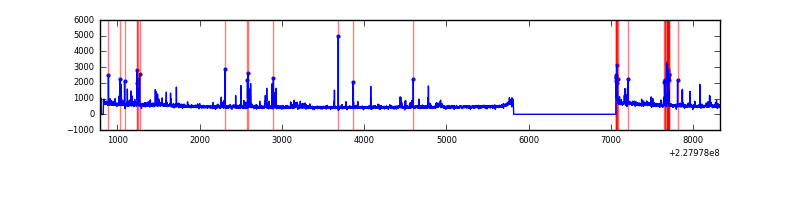 |
| C | 7535 | 6267 | 0 | 0 | 0.00% | 0.00% | 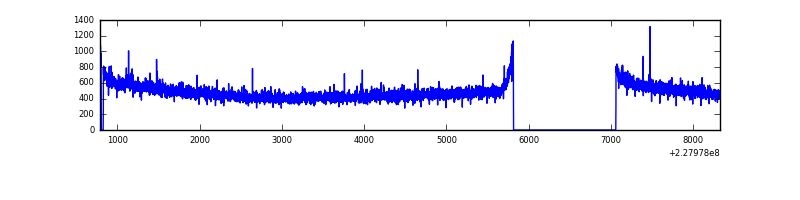 |
| D | 7534 | 6265 | 1112 | 1112 | 14.76% | 17.75% | 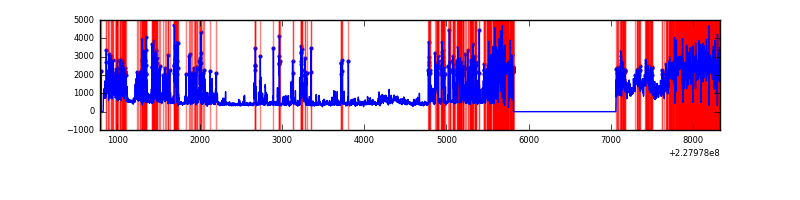 |
Top three noisy pixels from each quadrant. If the there are fewer than three noisy pixels in the level2.evt file, extra rows are filled as -1
| Pixel properties | Quadrant properties | ||||||
|---|---|---|---|---|---|---|---|
| Quadrant | DetID | PixID | Counts | Sigma | Mean | Median | Sigma |
| A | 4 | 2 | 148215 | 927.78 | 791 | 775 | 158.9 |
| A | 15 | 234 | 27841 | 170.32 | 791 | 775 | 158.9 |
| A | 8 | 6 | 10071 | 58.5 | 791 | 775 | 158.9 |
| B | 4 | 239 | 155808 | 1058.11 | 794 | 778 | 146.5 |
| B | 0 | 187 | 96952 | 656.4 | 794 | 778 | 146.5 |
| B | 10 | 16 | 51013 | 342.86 | 794 | 778 | 146.5 |
| C | 1 | 16 | 31334 | 175.56 | 759 | 764 | 174.1 |
| C | 13 | 61 | 5963 | 29.86 | 759 | 764 | 174.1 |
| C | 8 | 128 | 5678 | 28.22 | 759 | 764 | 174.1 |
| D | 2 | 250 | 3406238 | 19516.33 | 659 | 643 | 174.5 |
| D | 1 | 52 | 509131 | 2913.97 | 659 | 643 | 174.5 |
| D | 13 | 169 | 266435 | 1523.17 | 659 | 643 | 174.5 |
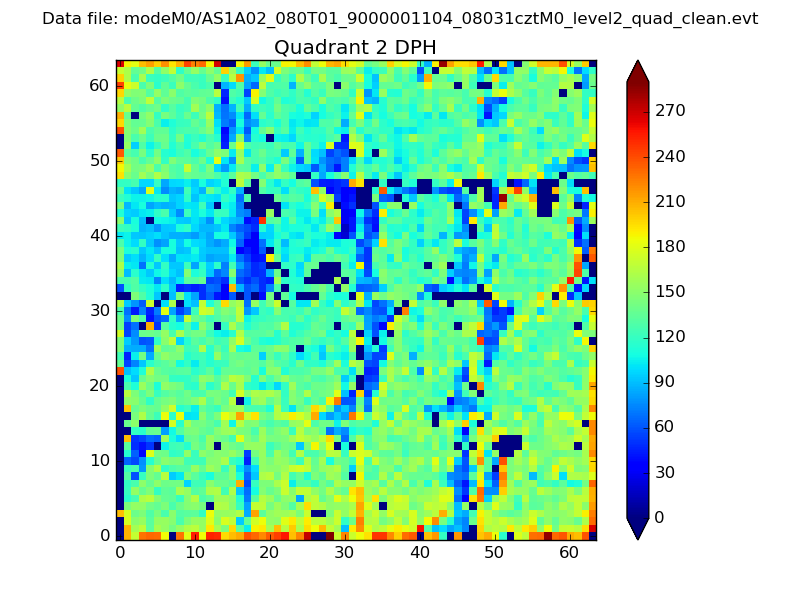
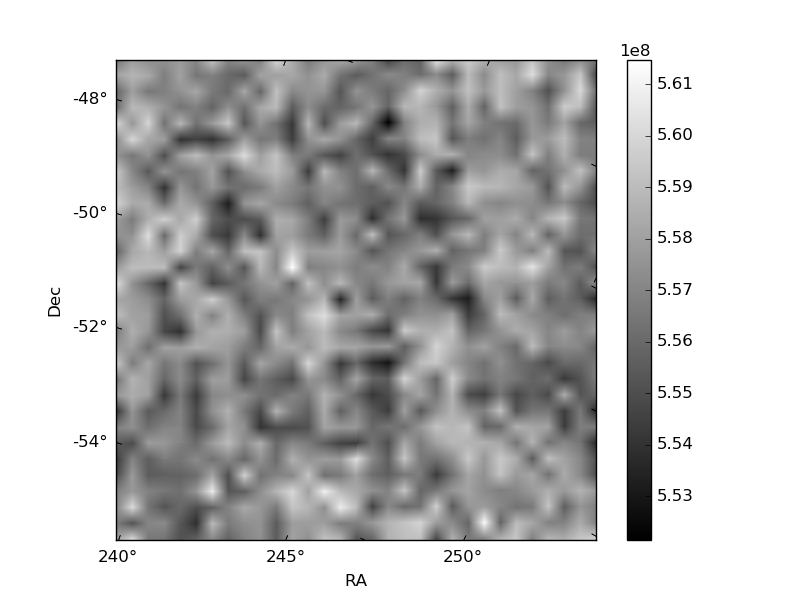
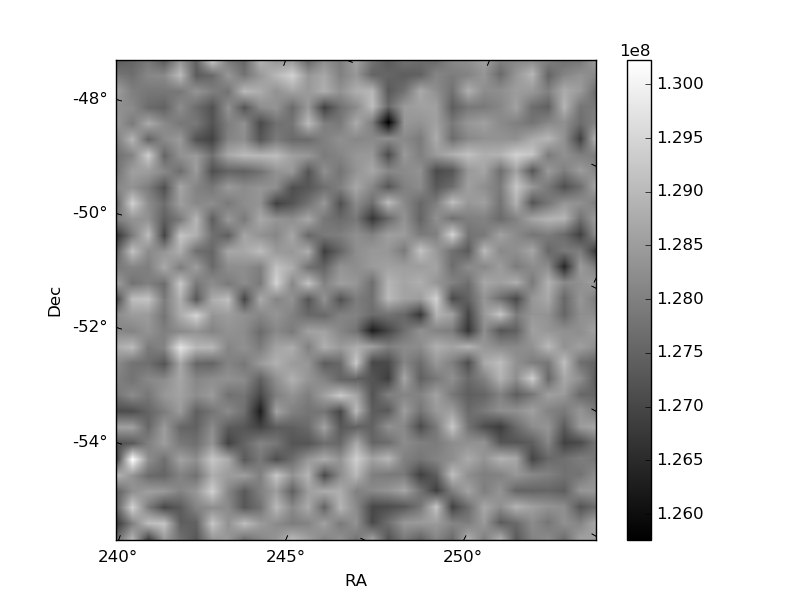
Histogram calculated using DETX and DETY for each event in the final _common_clean file
| Quadrant A | 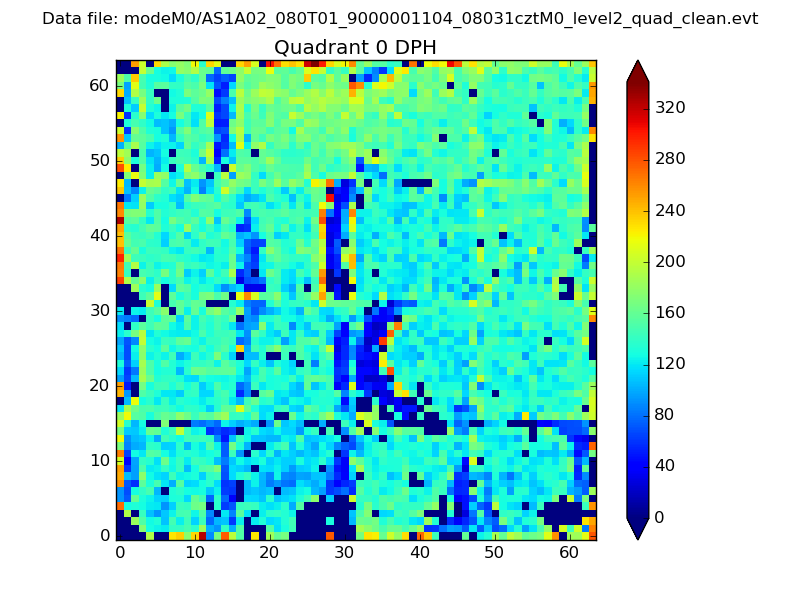 |
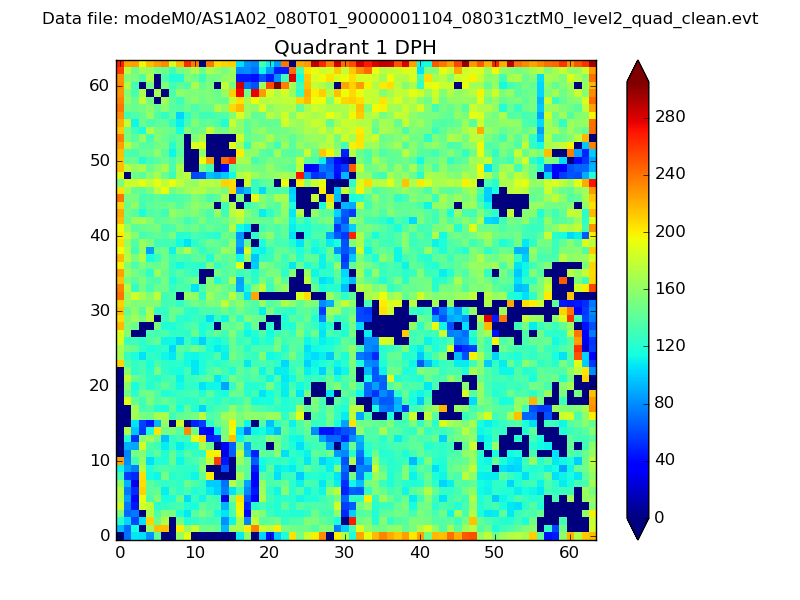 |
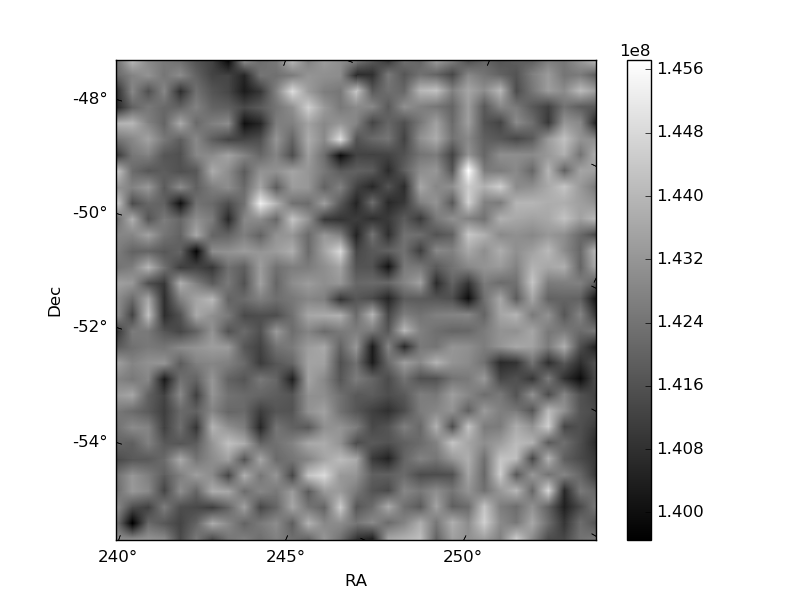
Quadrant B |
|---|---|---|---|
| Quadrant D | 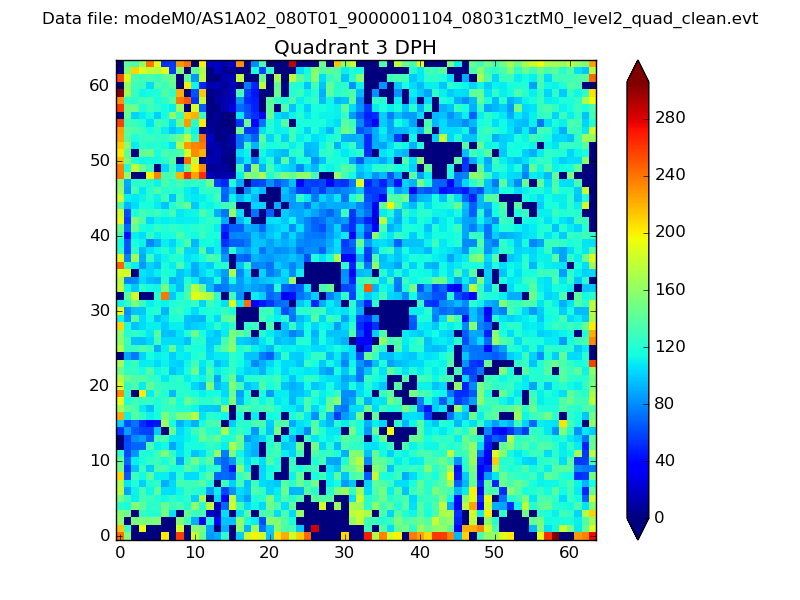 |
 |
Quadrant C |
| Plot type | Count rate plots | Images |
|---|---|---|
| Comparison with Poisson distribution Blue bars denote a histogram of data divided into 1 sec bins. Red curve is a Poisson curve with rate = median count rate of data. |
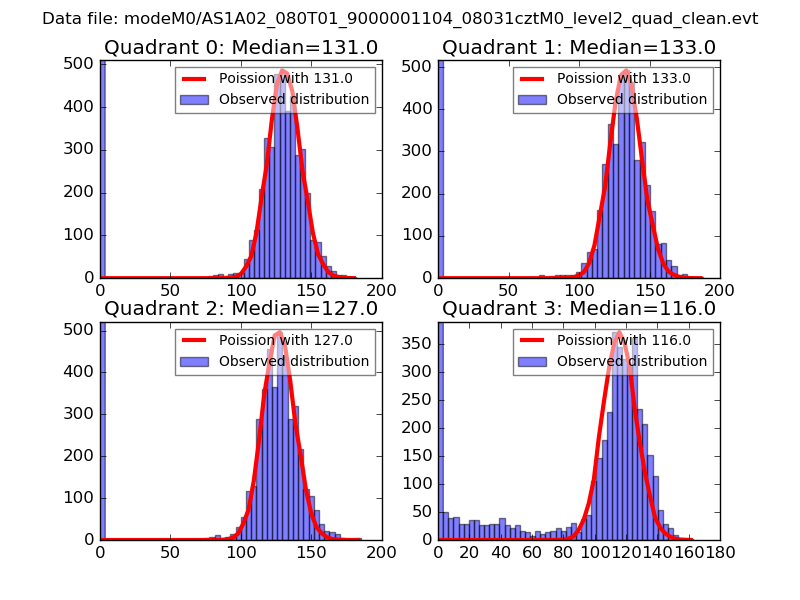 |
 |
| Quadrant-wise count rates Data is divided into 100 sec bins |
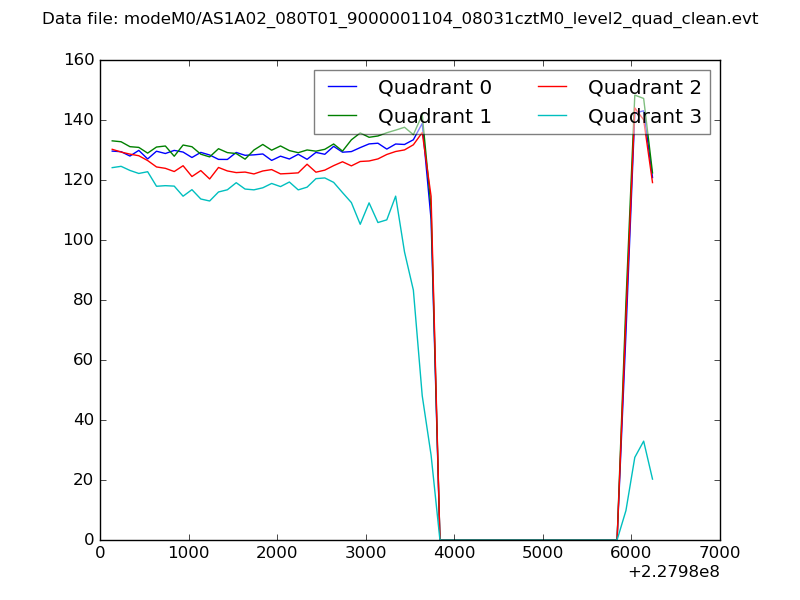 |
|
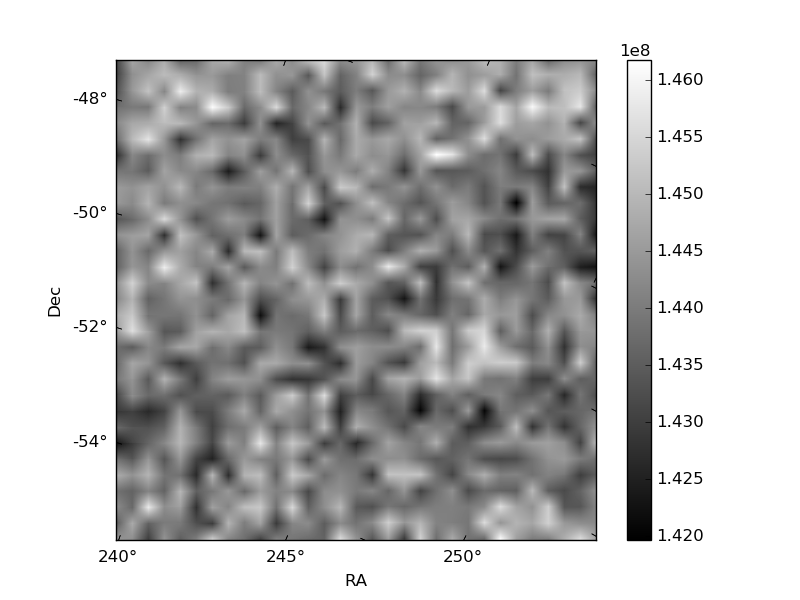
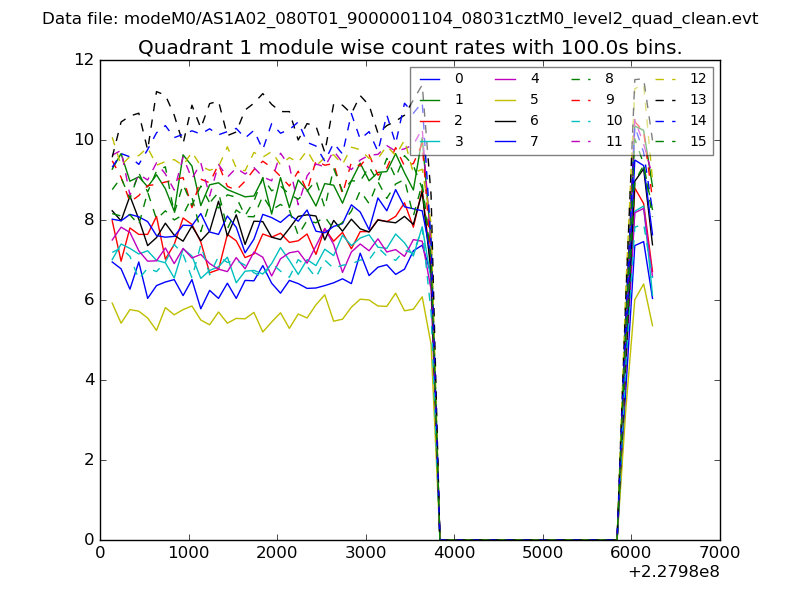
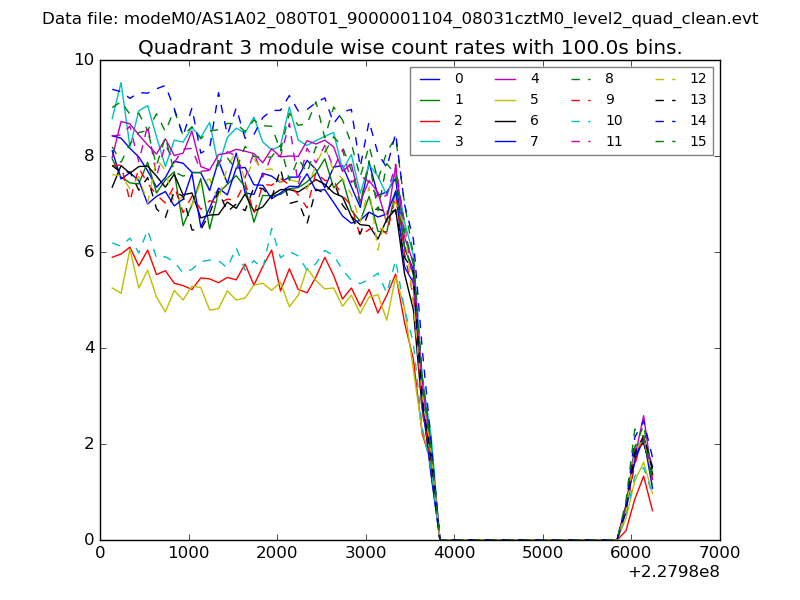
| Module-wise count rates for Quadrant A Data is divided into 100 sec bins |
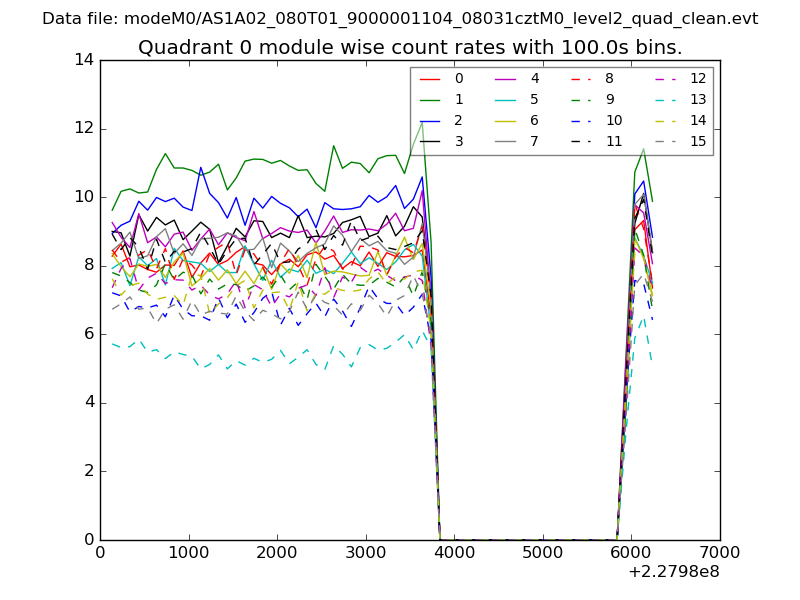 |
 |
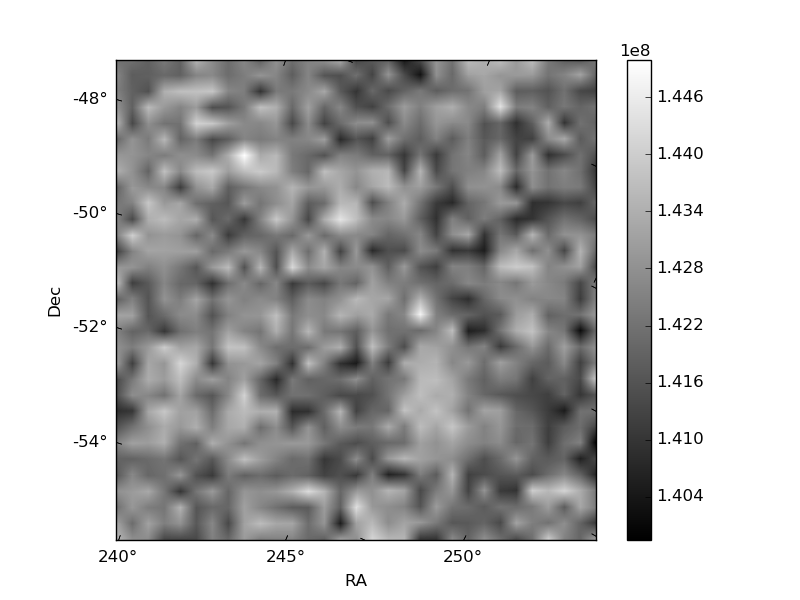
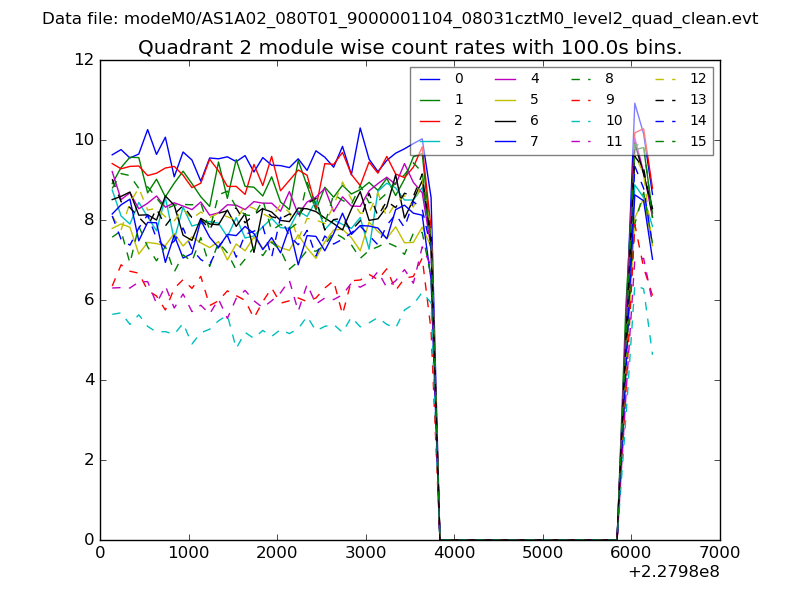
| Module-wise count rates for Quadrant B Data is divided into 100 sec bins |
 |
 |
| Module-wise count rates for Quadrant C Data is divided into 100 sec bins |
 |
 |
| Module-wise count rates for Quadrant D Data is divided into 100 sec bins |
 |
 |
| Parameter | Plot |
|---|---|
| CZT HV Monitor | 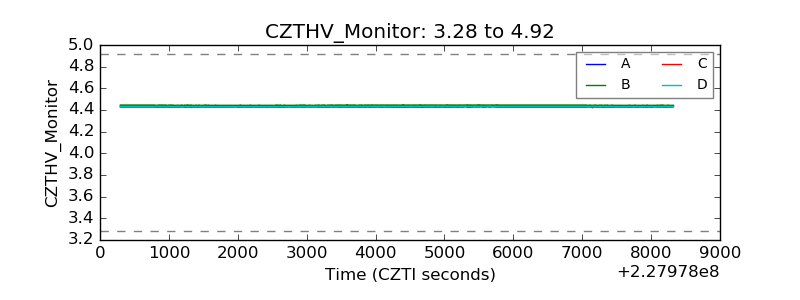 |
| D_VDD | 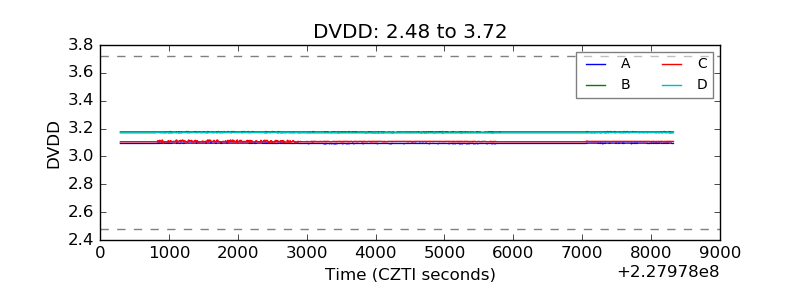 |
| Temperature 1 | 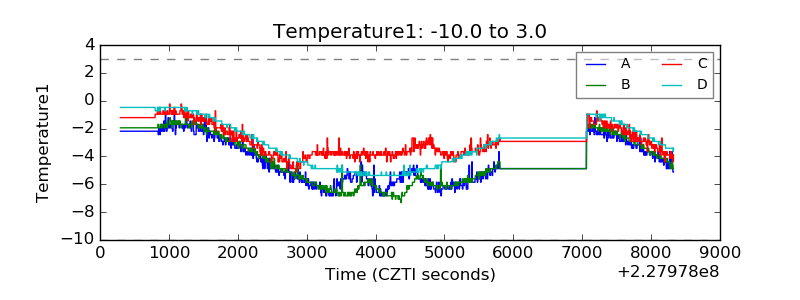 |
| Veto HV Monitor | 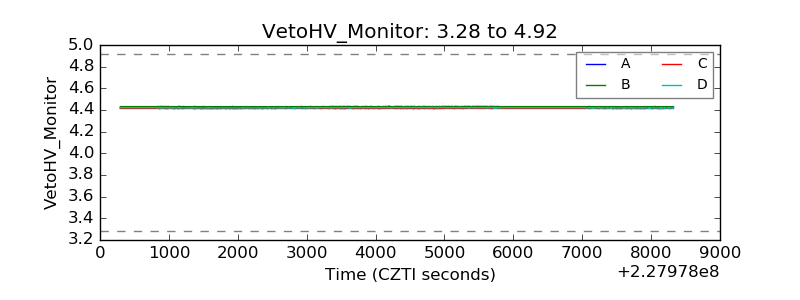 |
| Veto LLD | 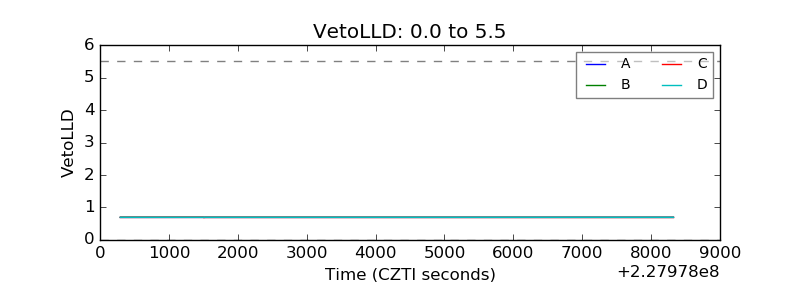 |
| Alpha Counter | 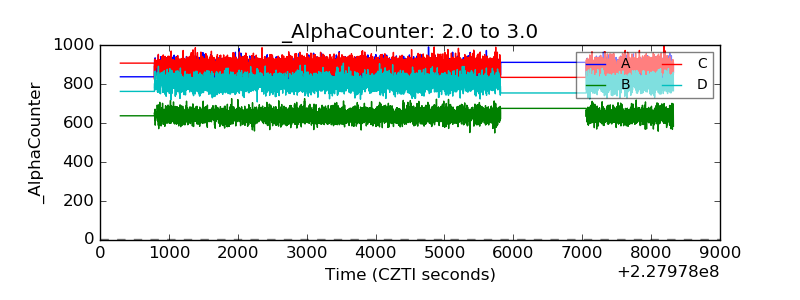 |
| _CPM_Rate | 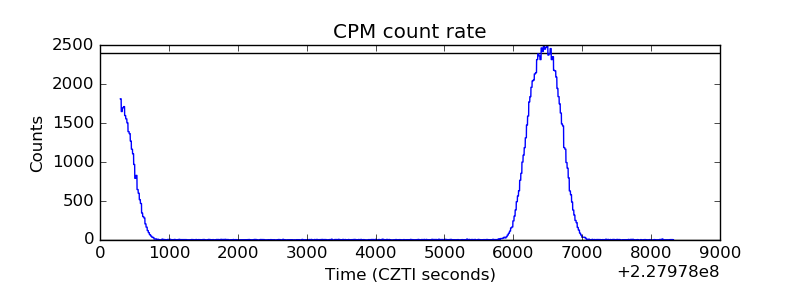 |
| CZT Counter | 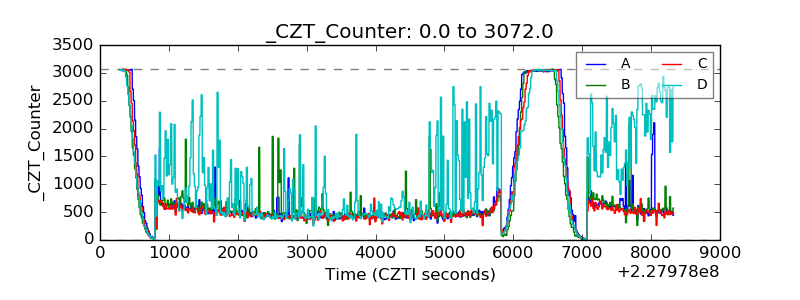 |
| +2.5 Volts monitor |  |
| +5 Volts monitor |  |
| _ROLL_ROT | 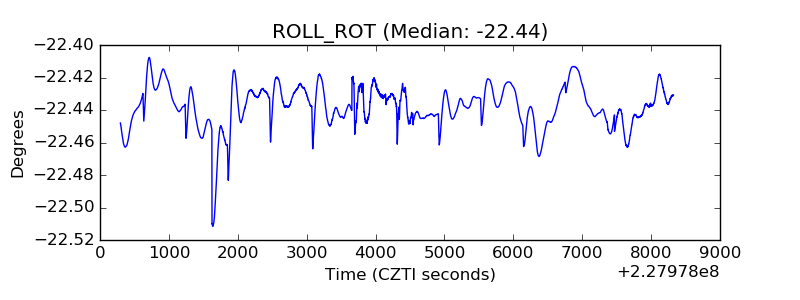 |
| _Roll_DEC | 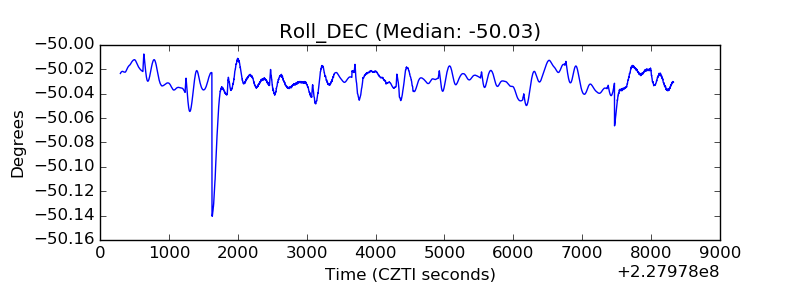 |
| _Roll_RA | 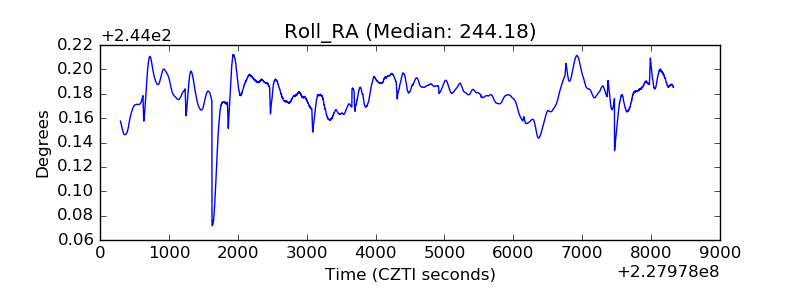 |
| Veto Counter | 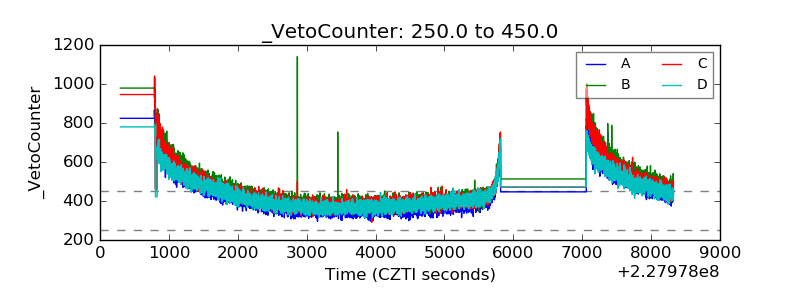 |