| Param | Original file | Final file |
|---|---|---|
| Filename | modeM0/AS1A02_080T01_9000001104_08034cztM0_level2.evt | modeM0/AS1A02_080T01_9000001104_08034cztM0_level2_quad_clean.evt |
| Size (bytes) | 416,476,800 | 90,835,200 |
| Size | 397.2 MB | 86.6 MB |
| Events in quadrant A | 2,681,158 | 604,335 |
| Events in quadrant B | 3,127,570 | 617,314 |
| Events in quadrant C | 2,509,430 | 594,303 |
| Events in quadrant D | 3,927,816 | 557,034 |
| Mode SS | |||
|---|---|---|---|
| Quadrant | BADHDUFLAG | Total packets | Discarded packets |
| A | 0 | 110 | 0 |
| B | 0 | 110 | 0 |
| C | 0 | 110 | 0 |
| D | 0 | 110 | 0 |
| Mode M0 | |||
|---|---|---|---|
| Quadrant | BADHDUFLAG | Total packets | Discarded packets |
| A | 0 | 11581 | 1 |
| B | 0 | 12953 | 1 |
| C | 0 | 11116 | 1 |
| D | 0 | 15392 | 1 |
| Mode M9 | |||
|---|---|---|---|
| Quadrant | BADHDUFLAG | Total packets | Discarded packets |
| A | 0 | 15 | 0 |
| B | 0 | 15 | 0 |
| C | 0 | 15 | 0 |
| D | 0 | 16 | 0 |
| Quadrant | Total seconds | Saturated seconds | Saturation percentage |
|---|---|---|---|
| A | 5398 | 68 | 1.259726% |
| B | 5398 | 194 | 3.593924% |
| C | 5398 | 15 | 0.277881% |
| D | 5398 | 209 | 3.871804% |
Noise dominated data is calculated using 1-second bins in cleaned event files. If a bin has >2000 counts, and if more than 50% of those come from <1% of pixels, then it is considered to be noise-dominated and hence unusable.
| Quadrant | # 1 sec bins | Bins with >0 counts | Bins with >2000 counts | High rate bins dominated by noise | Noise dominated (total time) | Noise dominated (detector-on time) | Marked lightcurve |
|---|---|---|---|---|---|---|---|
| A | 6663 | 5399 | 23 | 23 | 0.35% | 0.43% | 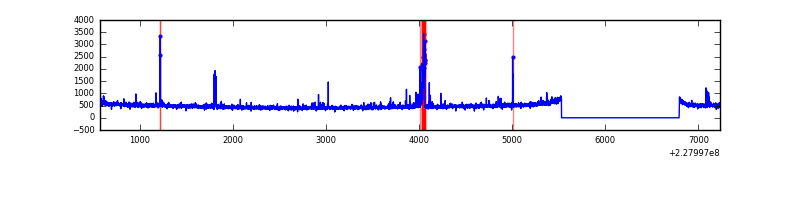 |
| B | 6663 | 5399 | 65 | 65 | 0.98% | 1.20% |  |
| C | 6663 | 5399 | 0 | 0 | 0.00% | 0.00% |  |
| D | 6663 | 5399 | 87 | 87 | 1.31% | 1.61% | 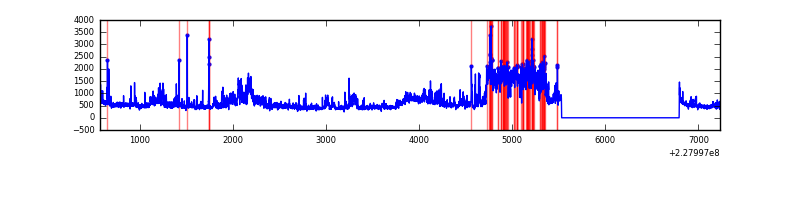 |
Top three noisy pixels from each quadrant. If the there are fewer than three noisy pixels in the level2.evt file, extra rows are filled as -1
| Pixel properties | Quadrant properties | ||||||
|---|---|---|---|---|---|---|---|
| Quadrant | DetID | PixID | Counts | Sigma | Mean | Median | Sigma |
| A | 4 | 2 | 155358 | 1166.11 | 652 | 640 | 132.7 |
| A | 15 | 234 | 8405 | 58.52 | 652 | 640 | 132.7 |
| A | 0 | 226 | 6304 | 42.69 | 652 | 640 | 132.7 |
| B | 4 | 239 | 321205 | 2584.82 | 659 | 644 | 124.0 |
| B | 10 | 16 | 70325 | 561.87 | 659 | 644 | 124.0 |
| B | 11 | 51 | 48425 | 385.28 | 659 | 644 | 124.0 |
| C | 1 | 16 | 13467 | 87.03 | 639 | 641 | 147.4 |
| C | 13 | 61 | 4971 | 29.38 | 639 | 641 | 147.4 |
| C | 8 | 222 | 3159 | 17.08 | 639 | 641 | 147.4 |
| D | 13 | 169 | 1386011 | 9074.69 | 625 | 606 | 152.7 |
| D | 2 | 136 | 62891 | 407.98 | 625 | 606 | 152.7 |
| D | 1 | 52 | 44573 | 287.99 | 625 | 606 | 152.7 |
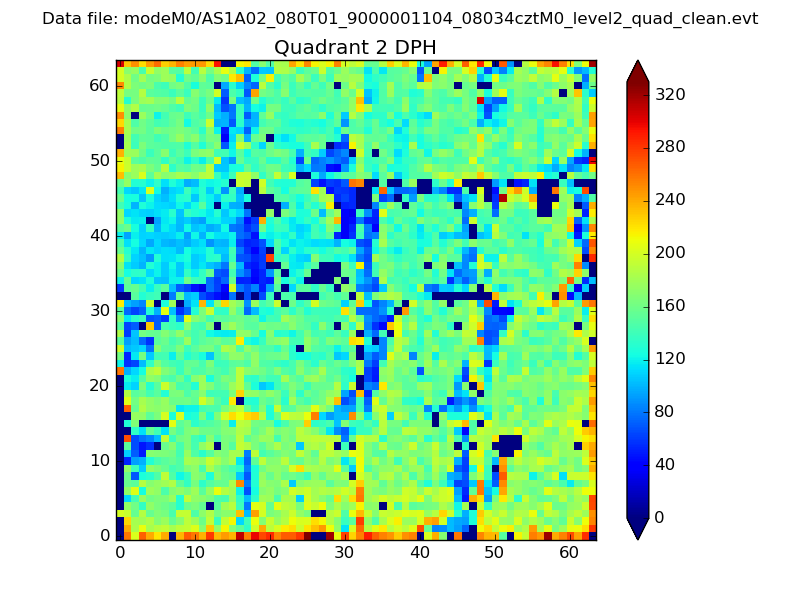
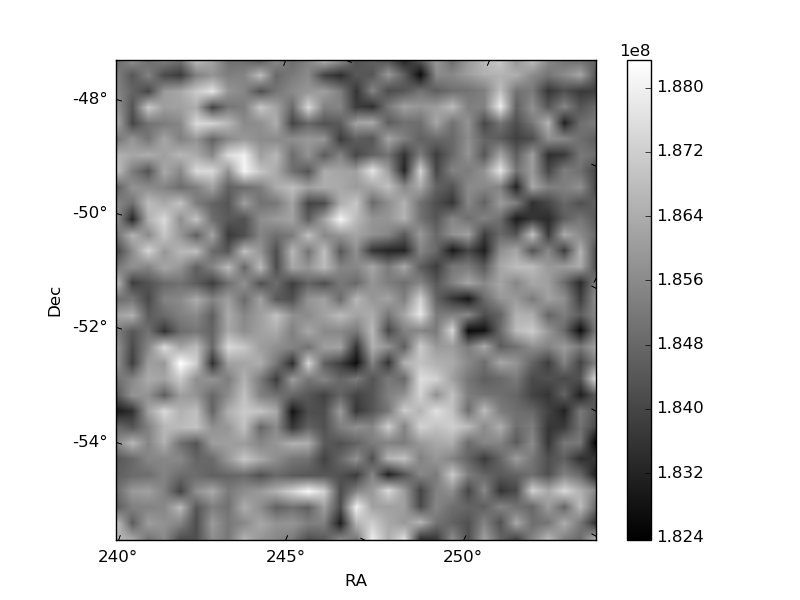
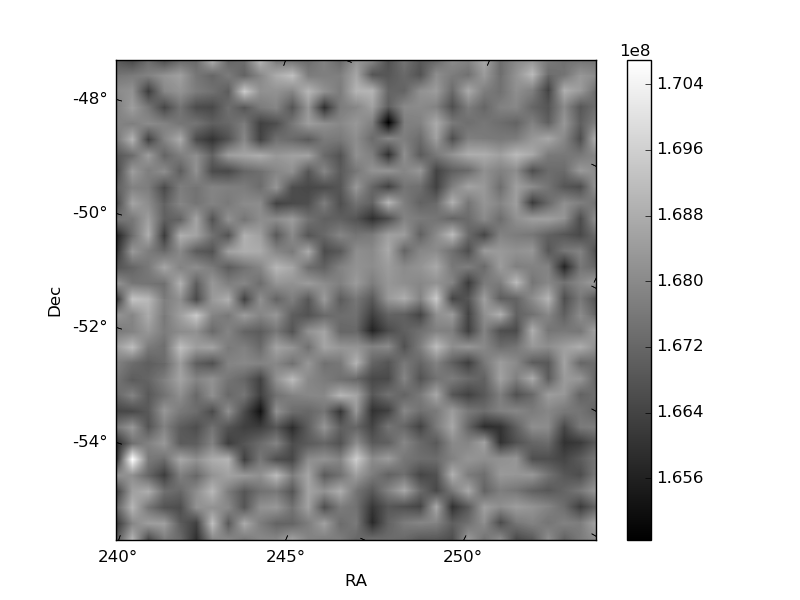
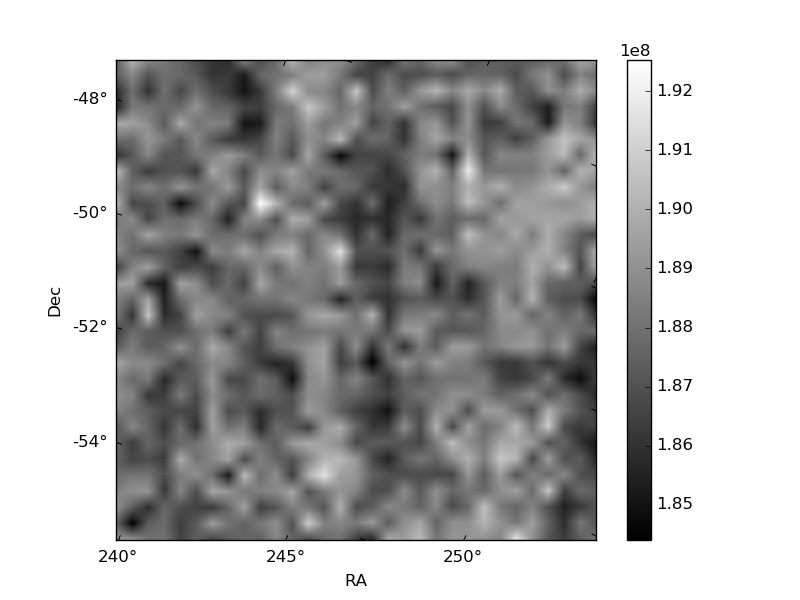
Histogram calculated using DETX and DETY for each event in the final _common_clean file
| Quadrant A | 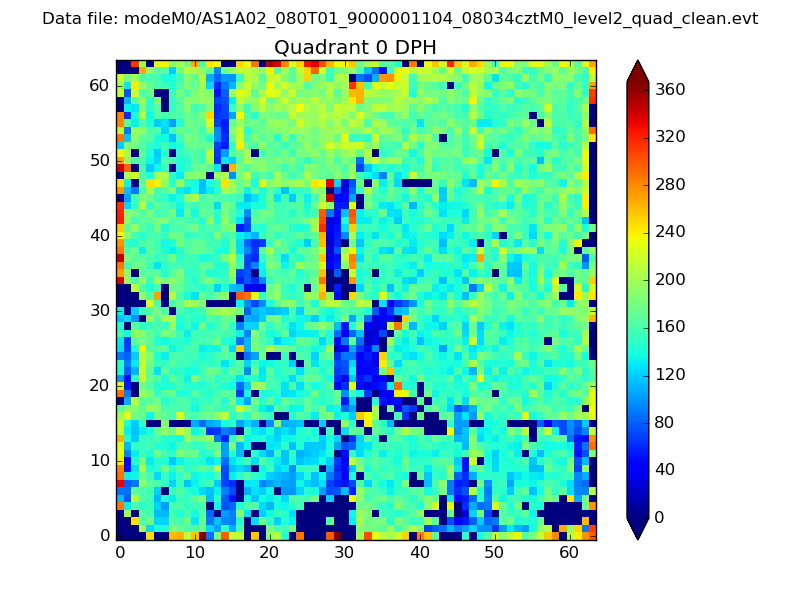 |
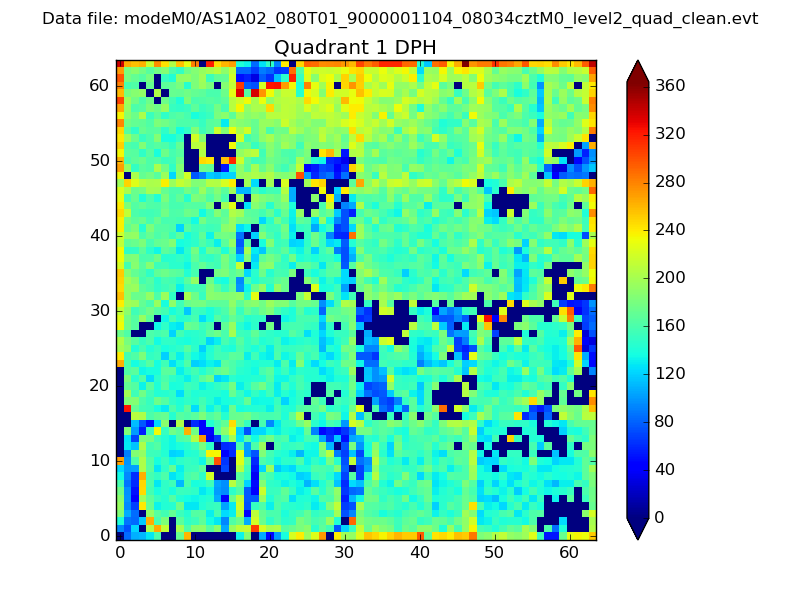 |
Quadrant B |
|---|---|---|---|
| Quadrant D | 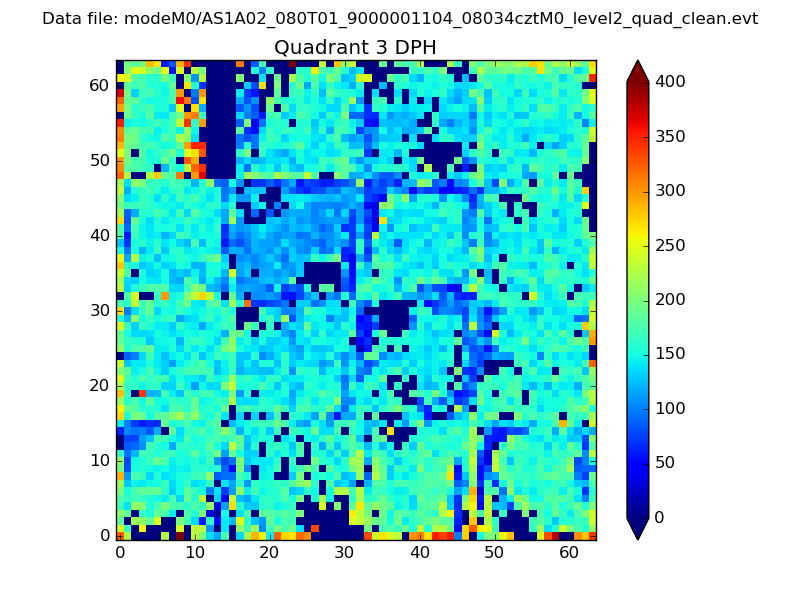 |
 |
Quadrant C |
| Plot type | Count rate plots | Images |
|---|---|---|
| Comparison with Poisson distribution Blue bars denote a histogram of data divided into 1 sec bins. Red curve is a Poisson curve with rate = median count rate of data. |
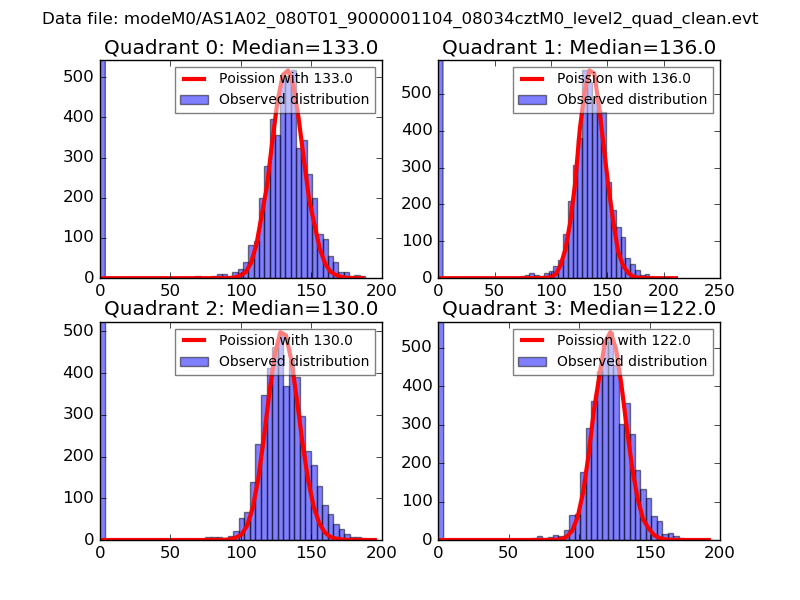 |
 |
| Quadrant-wise count rates Data is divided into 100 sec bins |
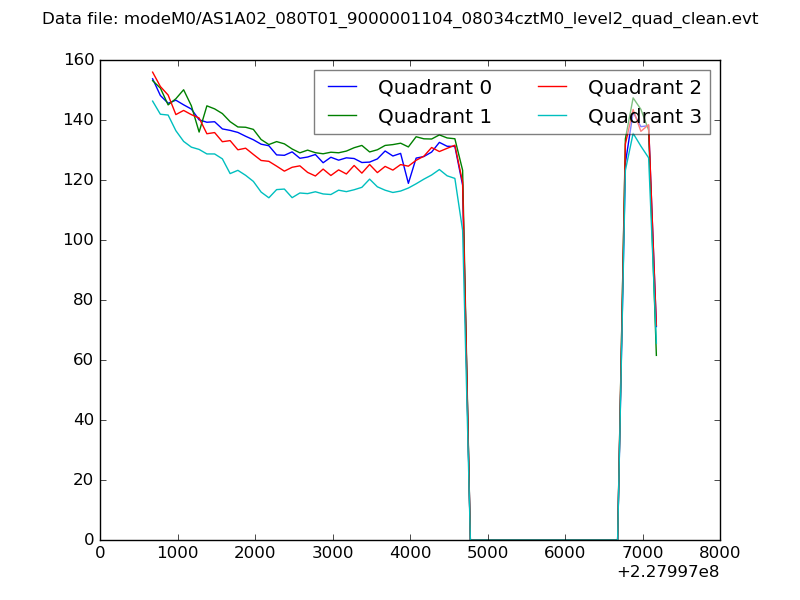 |
|
| Module-wise count rates for Quadrant A Data is divided into 100 sec bins |
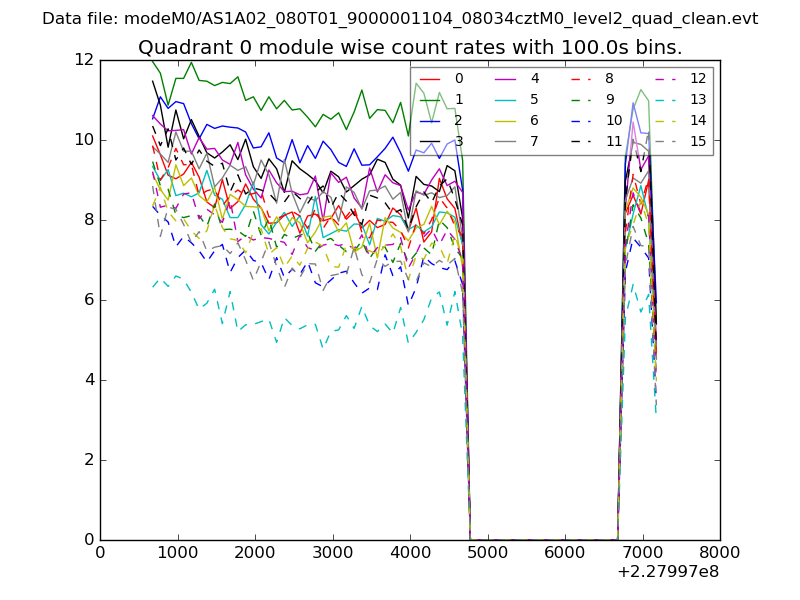 |
 |
| Module-wise count rates for Quadrant B Data is divided into 100 sec bins |
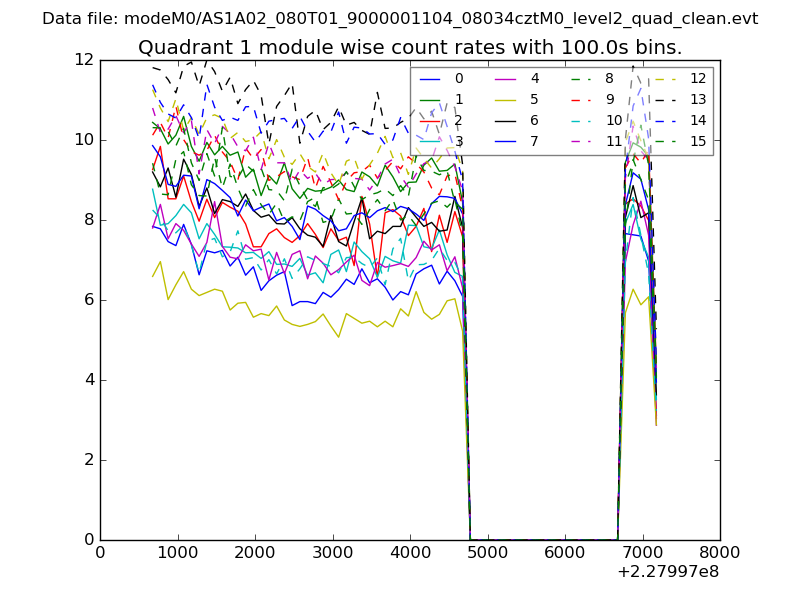 |
 |
| Module-wise count rates for Quadrant C Data is divided into 100 sec bins |
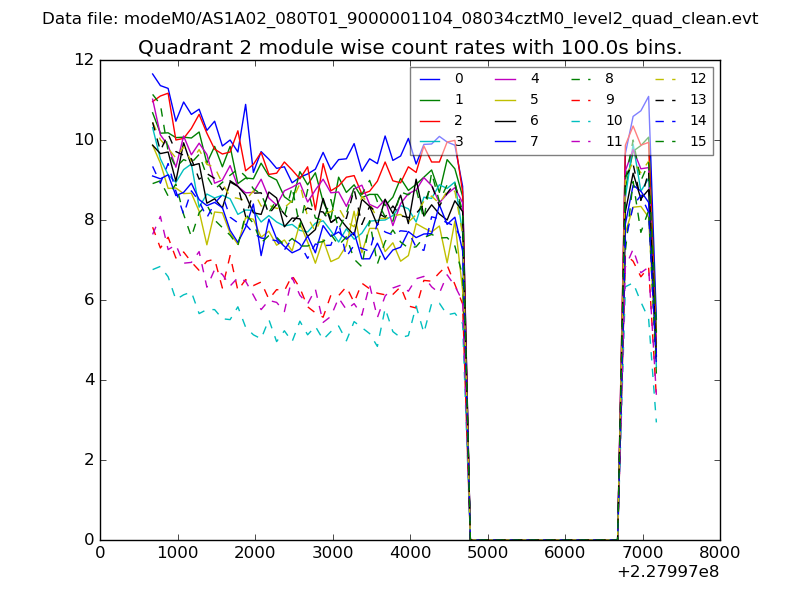 |
 |
| Module-wise count rates for Quadrant D Data is divided into 100 sec bins |
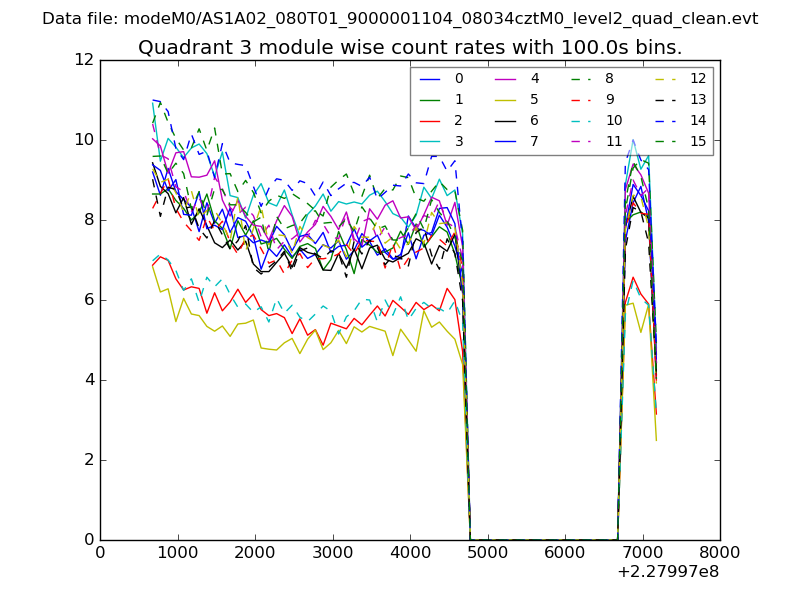 |
 |
| Parameter | Plot |
|---|---|
| CZT HV Monitor | 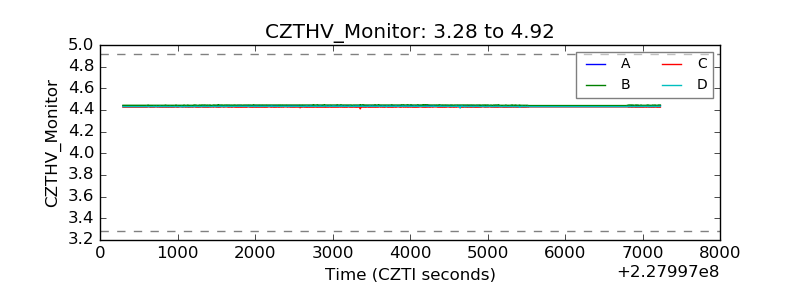 |
| D_VDD | 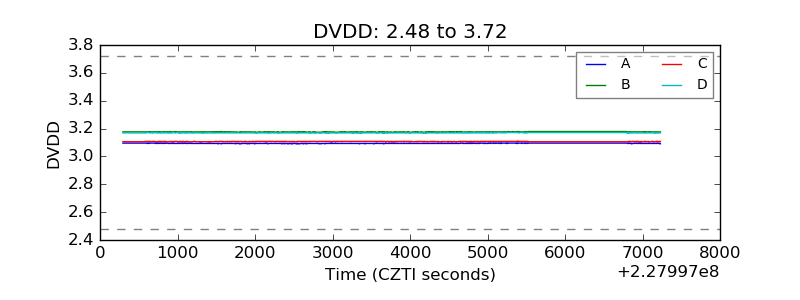 |
| Temperature 1 | 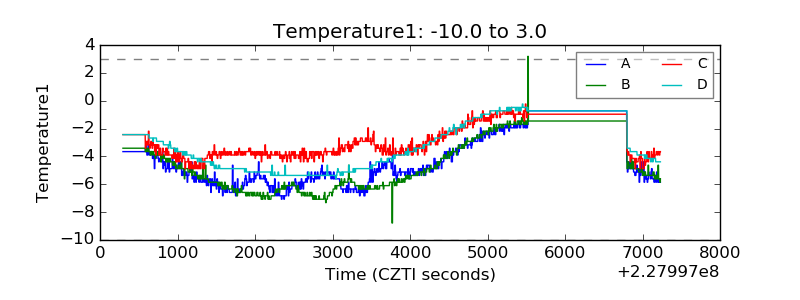 |
| Veto HV Monitor | 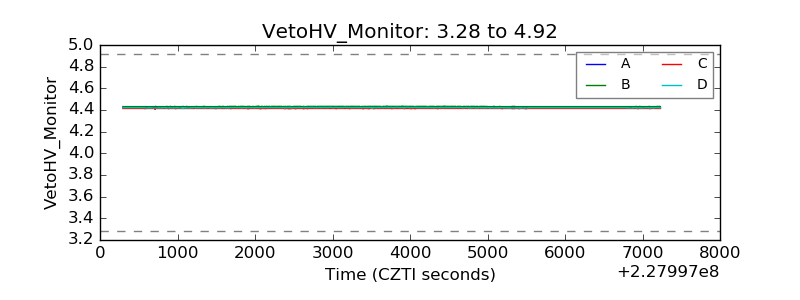 |
| Veto LLD | 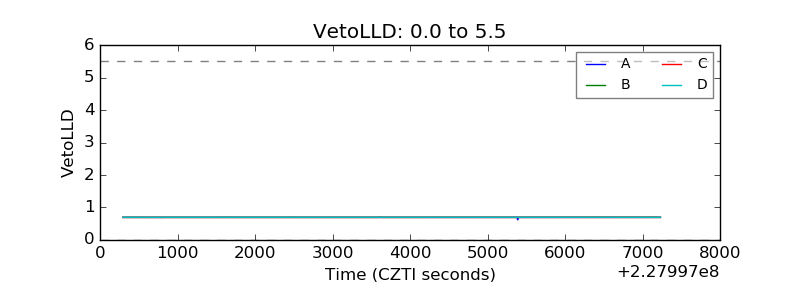 |
| Alpha Counter | 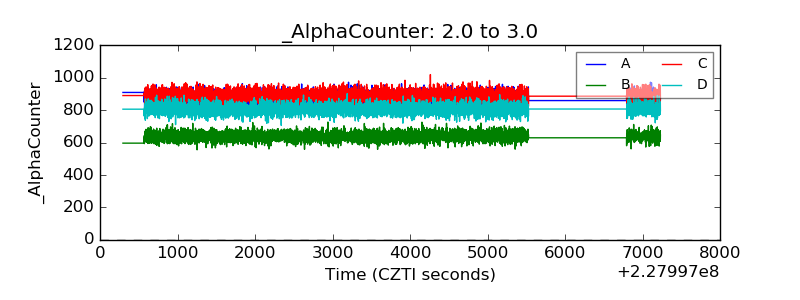 |
| _CPM_Rate | 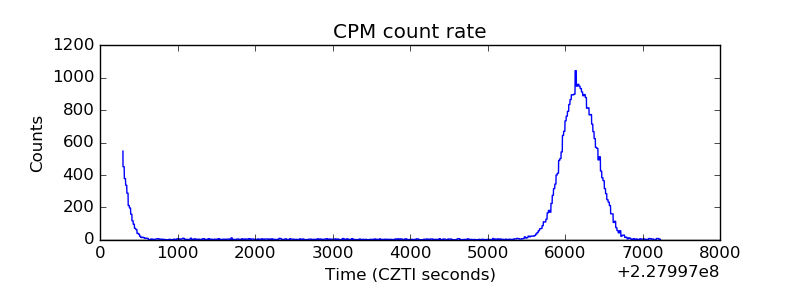 |
| CZT Counter | 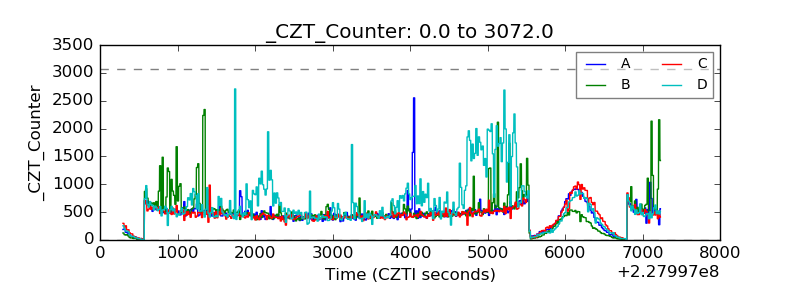 |
| +2.5 Volts monitor |  |
| +5 Volts monitor |  |
| _ROLL_ROT | 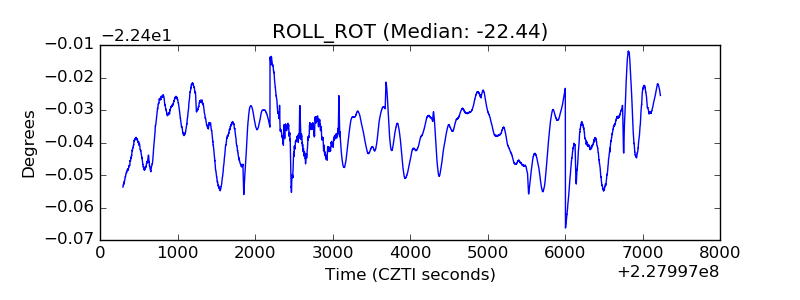 |
| _Roll_DEC | 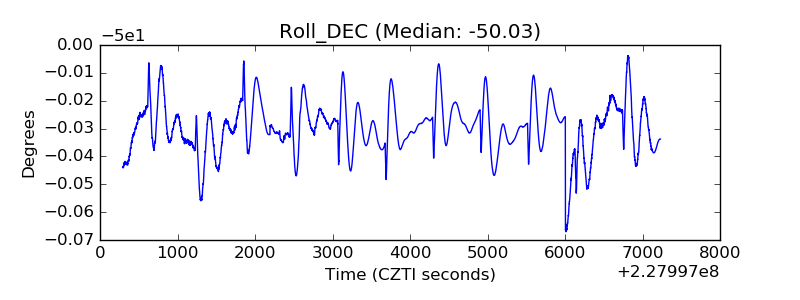 |
| _Roll_RA | 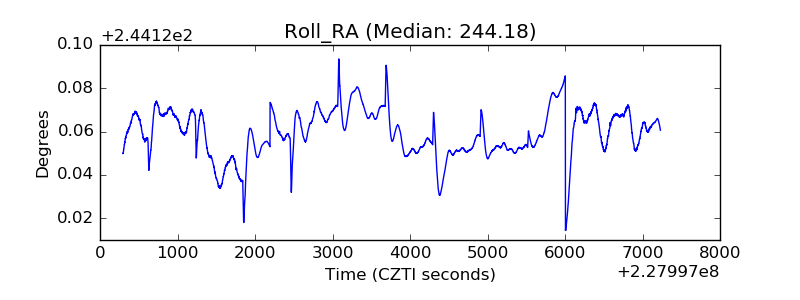 |
| Veto Counter | 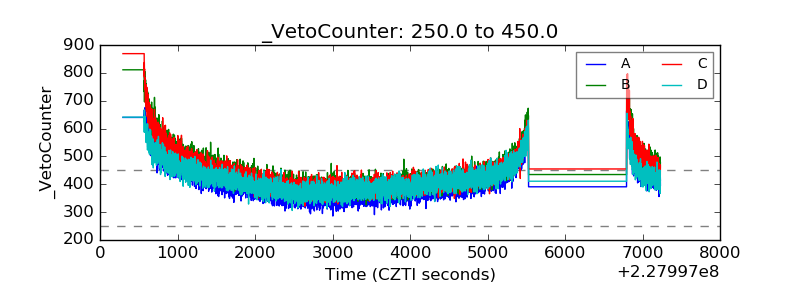 |