| Param | Original file | Final file |
|---|---|---|
| Filename | modeM0/AS1A02_080T01_9000001104_08035cztM0_level2.evt | modeM0/AS1A02_080T01_9000001104_08035cztM0_level2_quad_clean.evt |
| Size (bytes) | 35,112,960 | 9,348,480 |
| Size | 33.5 MB | 8.9 MB |
| Events in quadrant A | 238,160 | 61,326 |
| Events in quadrant B | 335,108 | 62,304 |
| Events in quadrant C | 226,702 | 62,110 |
| Events in quadrant D | 230,355 | 58,423 |
| Mode SS | |||
|---|---|---|---|
| Quadrant | BADHDUFLAG | Total packets | Discarded packets |
| A | 0 | 8 | 0 |
| B | 0 | 8 | 0 |
| C | 0 | 8 | 0 |
| D | 0 | 8 | 0 |
| Mode M0 | |||
|---|---|---|---|
| Quadrant | BADHDUFLAG | Total packets | Discarded packets |
| A | 0 | 969 | 0 |
| B | 0 | 1283 | 0 |
| C | 0 | 938 | 0 |
| D | 0 | 966 | 0 |
| Mode M9 | |||
|---|---|---|---|
| Quadrant | BADHDUFLAG | Total packets | Discarded packets |
| A | 0 | 6 | 0 |
| B | 0 | 6 | 0 |
| C | 0 | 6 | 0 |
| D | 0 | 7 | 0 |
| Quadrant | Total seconds | Saturated seconds | Saturation percentage |
|---|---|---|---|
| A | 438 | 7 | 1.598174% |
| B | 438 | 34 | 7.762557% |
| C | 438 | 2 | 0.456621% |
| D | 438 | 4 | 0.913242% |
Noise dominated data is calculated using 1-second bins in cleaned event files. If a bin has >2000 counts, and if more than 50% of those come from <1% of pixels, then it is considered to be noise-dominated and hence unusable.
| Quadrant | # 1 sec bins | Bins with >0 counts | Bins with >2000 counts | High rate bins dominated by noise | Noise dominated (total time) | Noise dominated (detector-on time) | Marked lightcurve |
|---|---|---|---|---|---|---|---|
| A | 438 | 438 | 0 | 0 | 0.00% | 0.00% |  |
| B | 438 | 438 | 22 | 22 | 5.02% | 5.02% |  |
| C | 438 | 438 | 0 | 0 | 0.00% | 0.00% | 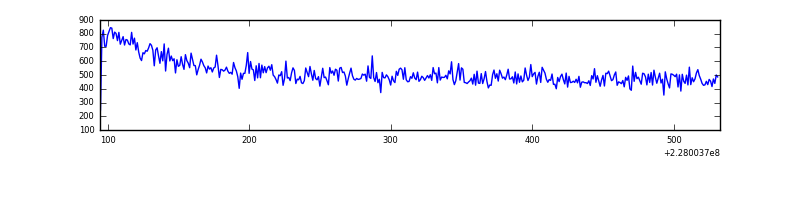 |
| D | 438 | 438 | 0 | 0 | 0.00% | 0.00% | 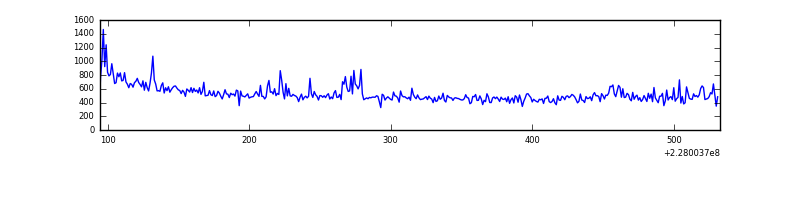 |
Top three noisy pixels from each quadrant. If the there are fewer than three noisy pixels in the level2.evt file, extra rows are filled as -1
| Pixel properties | Quadrant properties | ||||||
|---|---|---|---|---|---|---|---|
| Quadrant | DetID | PixID | Counts | Sigma | Mean | Median | Sigma |
| A | 15 | 234 | 7100 | 498.25 | 58 | 57 | 14.1 |
| A | 8 | 6 | 2174 | 149.77 | 58 | 57 | 14.1 |
| A | 4 | 2 | 2080 | 143.12 | 58 | 57 | 14.1 |
| B | 4 | 239 | 92958 | 6850.98 | 59 | 58 | 13.6 |
| B | 11 | 51 | 5524 | 403.09 | 59 | 58 | 13.6 |
| B | 0 | 214 | 3560 | 258.26 | 59 | 58 | 13.6 |
| C | 1 | 16 | 3075 | 200.6 | 57 | 57 | 15.0 |
| C | 1 | 3 | 494 | 29.05 | 57 | 57 | 15.0 |
| C | 7 | 159 | 448 | 25.99 | 57 | 57 | 15.0 |
| D | 13 | 169 | 6969 | 432.6 | 55 | 53 | 16.0 |
| D | 12 | 233 | 4744 | 293.42 | 55 | 53 | 16.0 |
| D | 1 | 52 | 2367 | 144.74 | 55 | 53 | 16.0 |
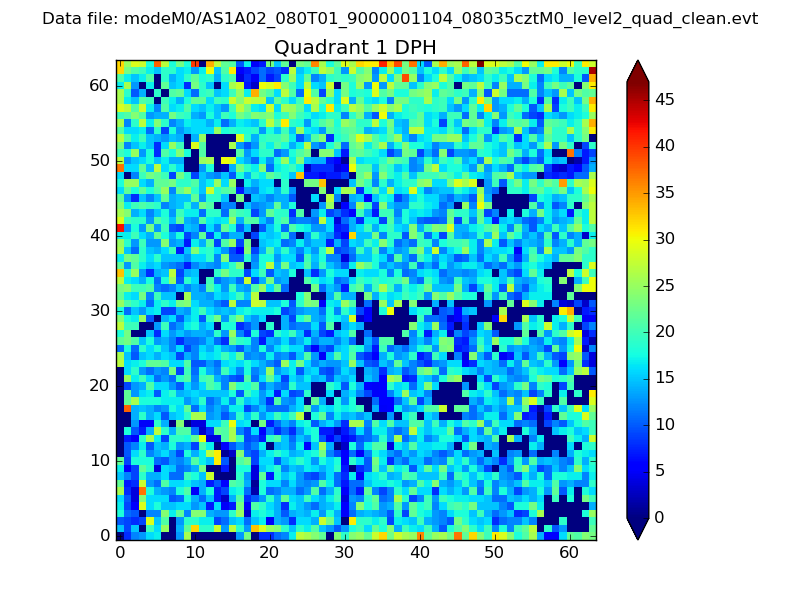
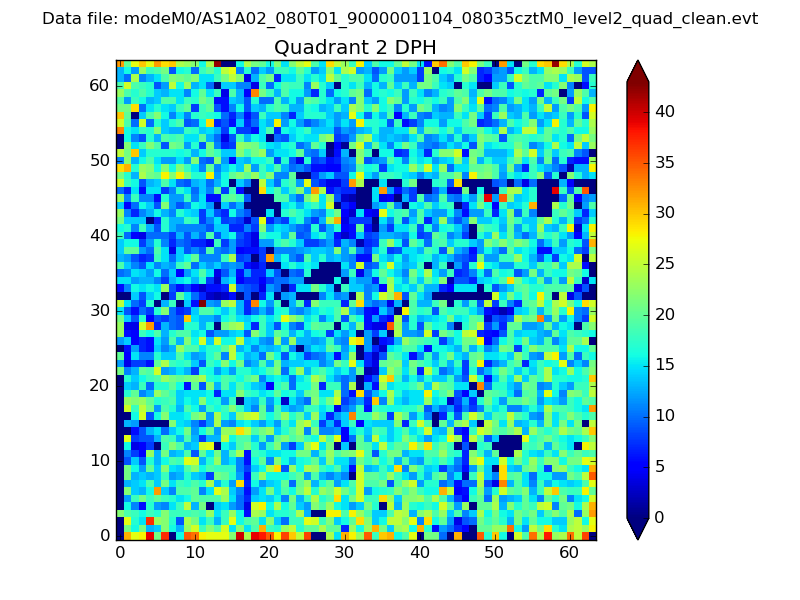
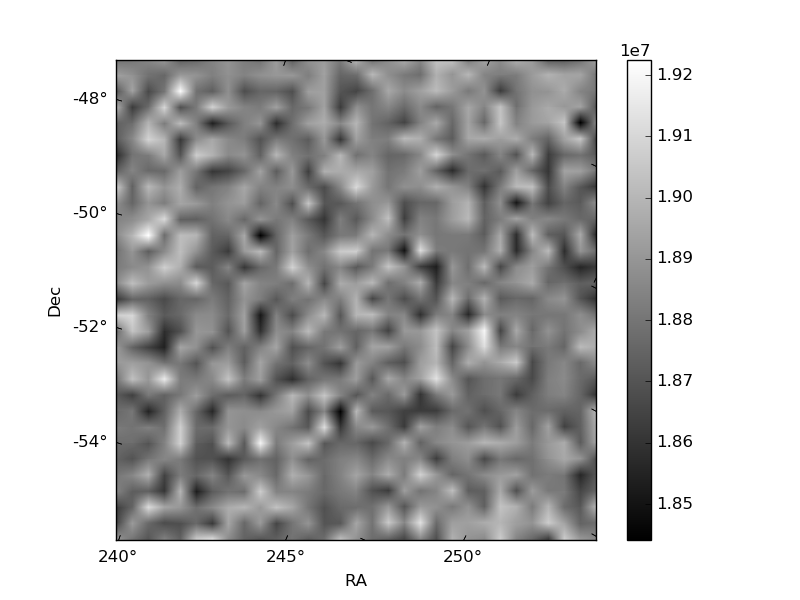
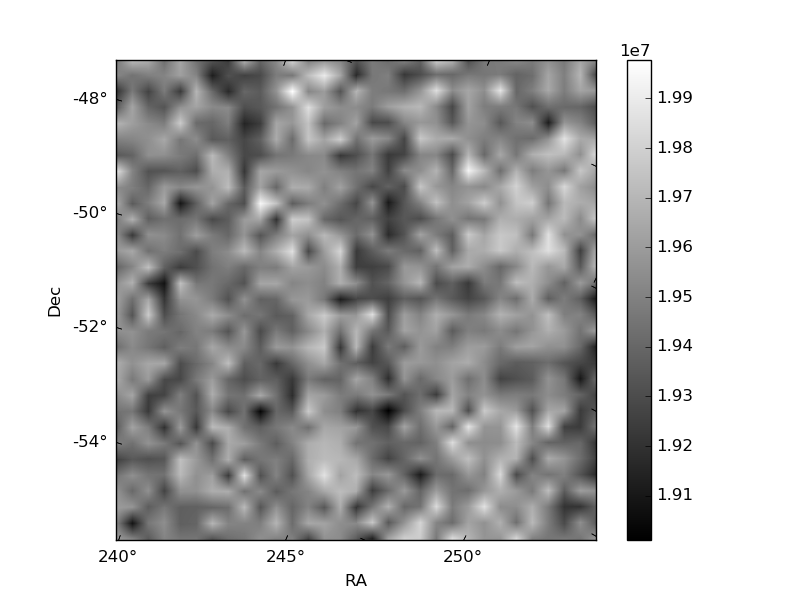
Histogram calculated using DETX and DETY for each event in the final _common_clean file
| Quadrant A | 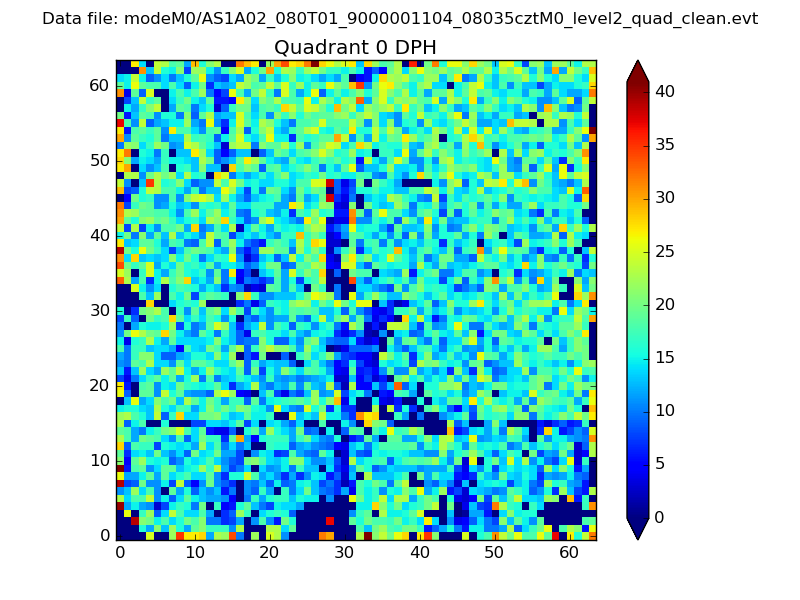 |
 |
Quadrant B |
|---|---|---|---|
| Quadrant D | 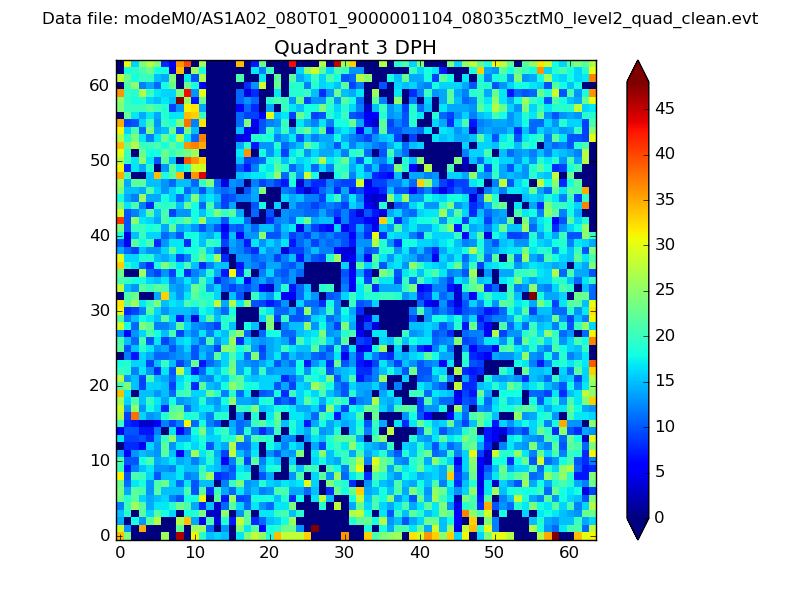 |
 |
Quadrant C |
| Plot type | Count rate plots | Images |
|---|---|---|
| Comparison with Poisson distribution Blue bars denote a histogram of data divided into 1 sec bins. Red curve is a Poisson curve with rate = median count rate of data. |
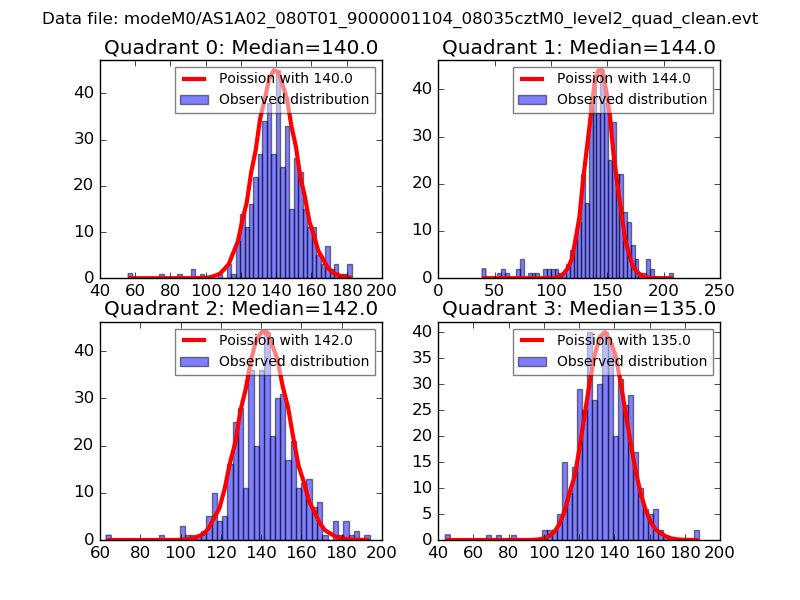 |
 |
| Quadrant-wise count rates Data is divided into 100 sec bins |
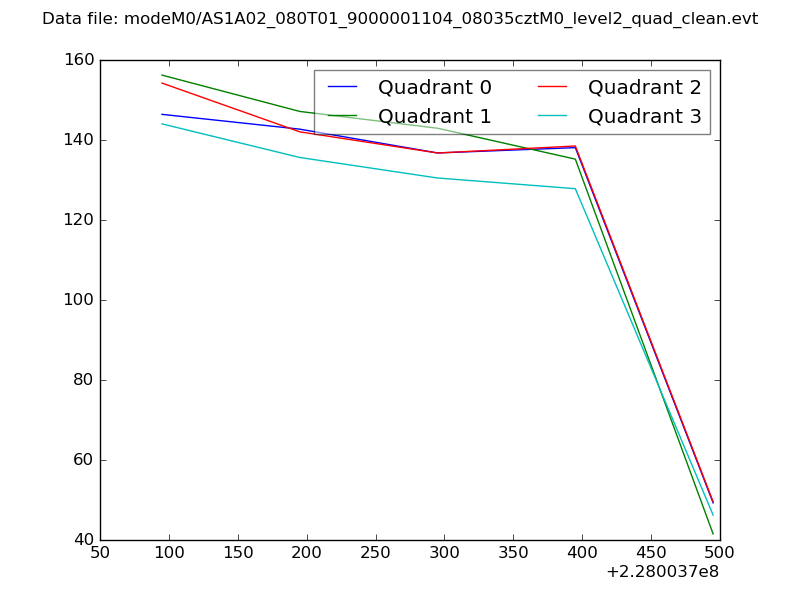 |
|
| Module-wise count rates for Quadrant A Data is divided into 100 sec bins |
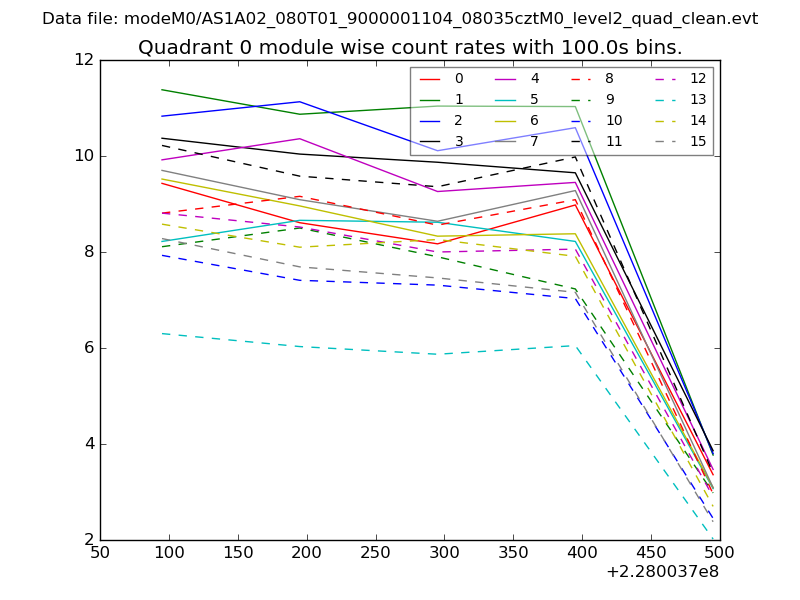 |
 |
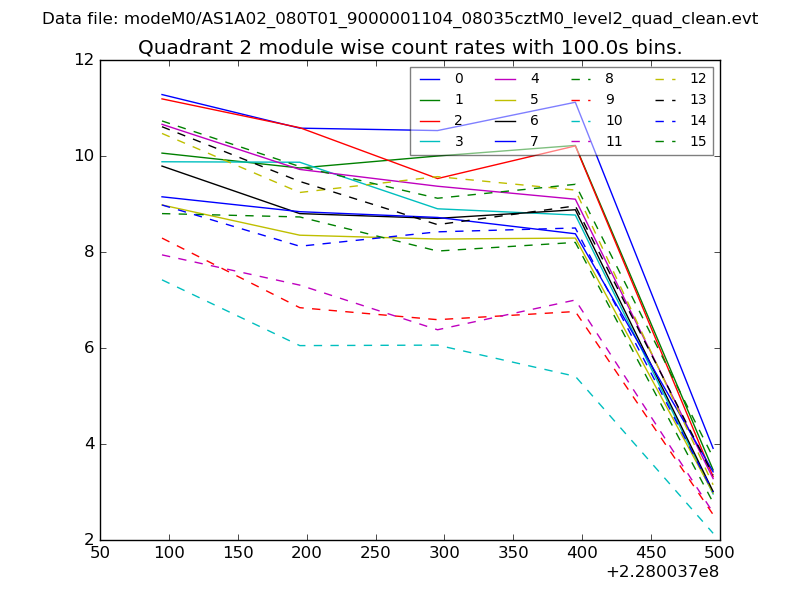
| Module-wise count rates for Quadrant B Data is divided into 100 sec bins |
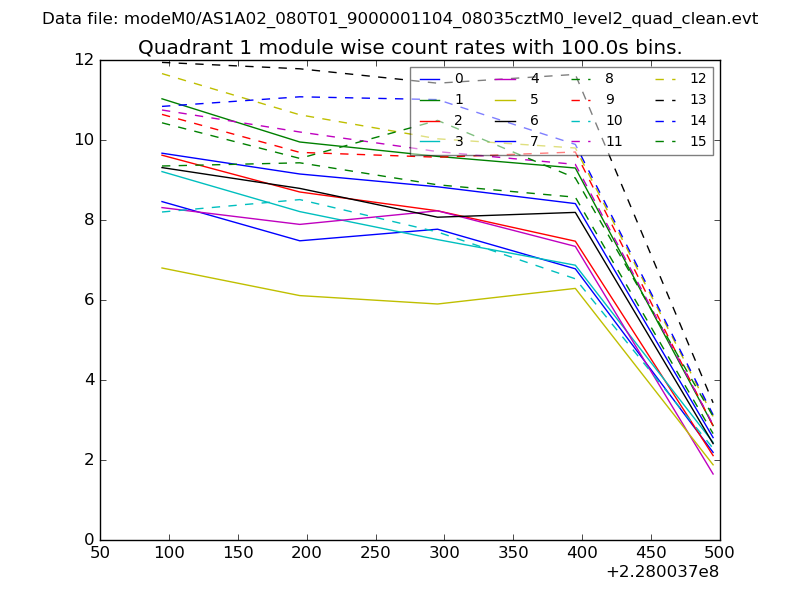 |
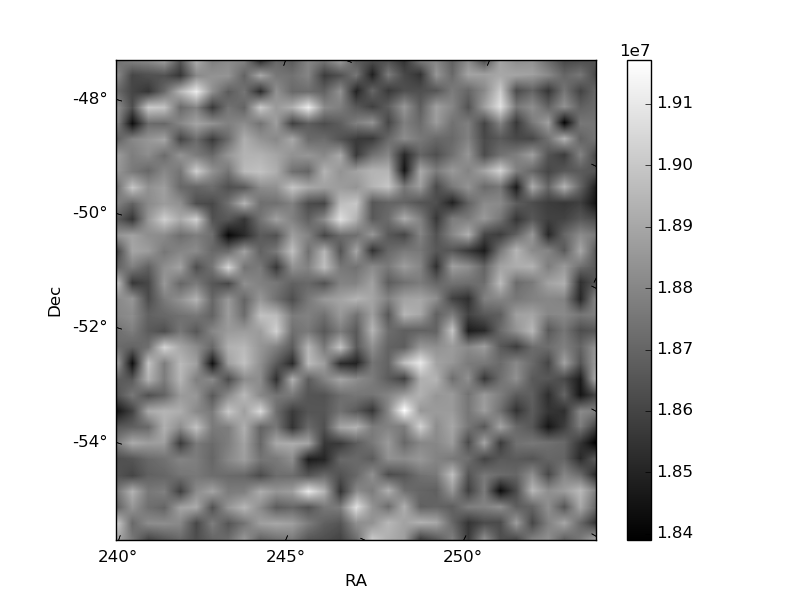 |
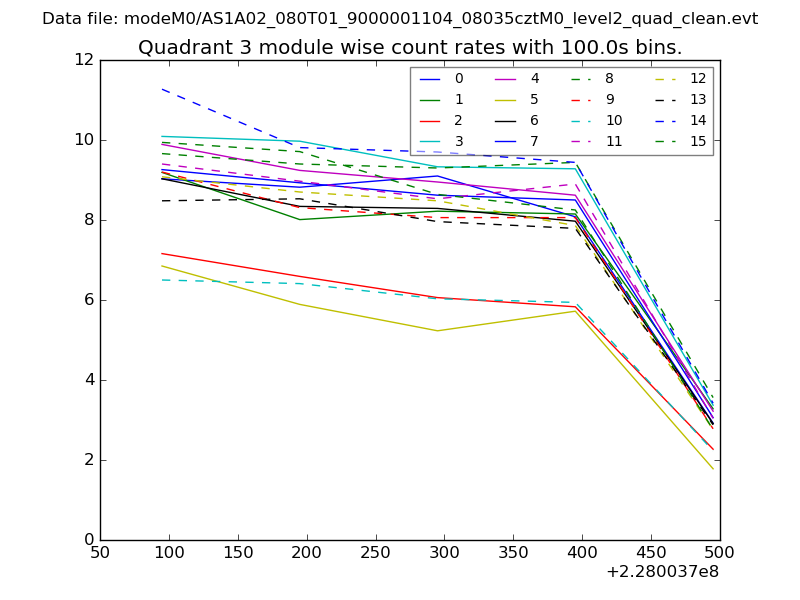
| Module-wise count rates for Quadrant C Data is divided into 100 sec bins |
 |
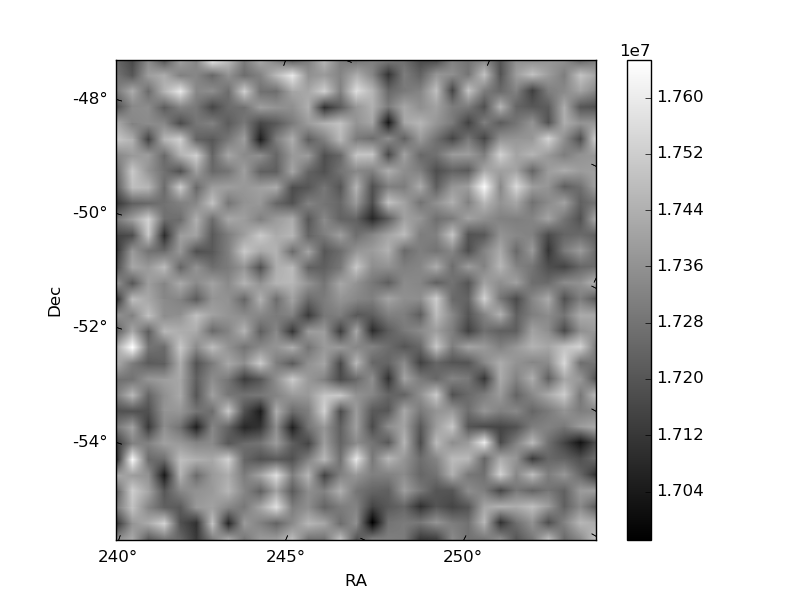 |
| Module-wise count rates for Quadrant D Data is divided into 100 sec bins |
 |
 |
| Parameter | Plot |
|---|---|
| CZT HV Monitor | 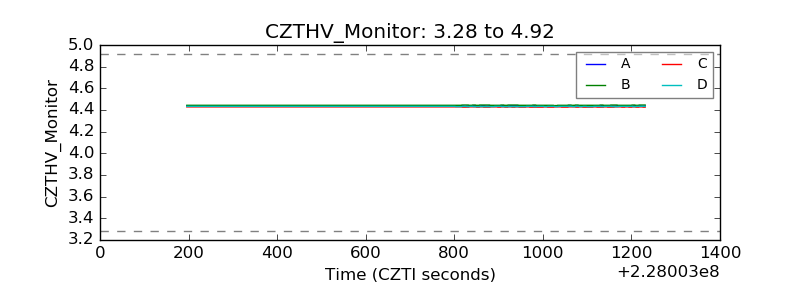 |
| D_VDD | 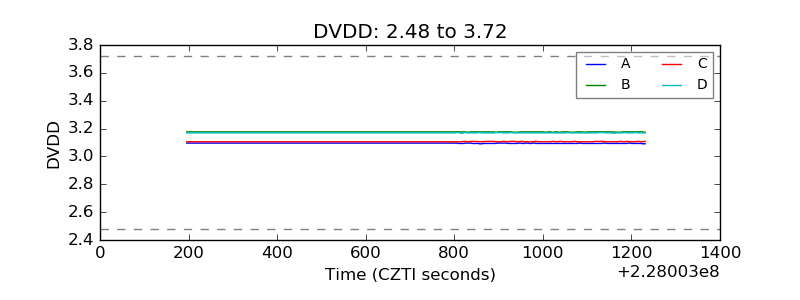 |
| Temperature 1 | 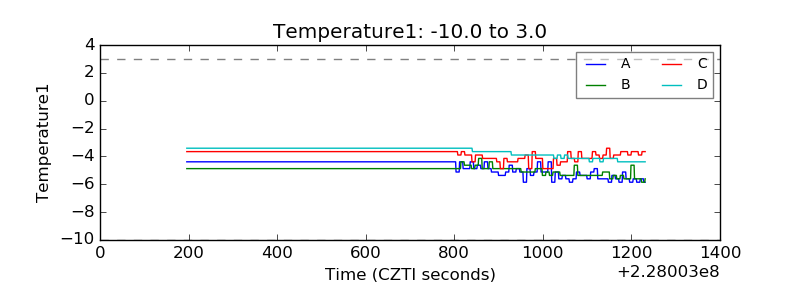 |
| Veto HV Monitor | 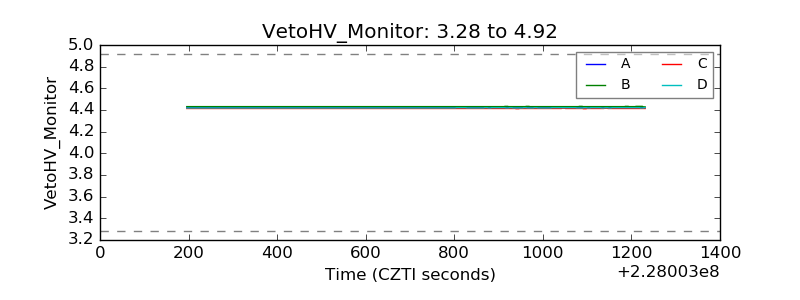 |
| Veto LLD | 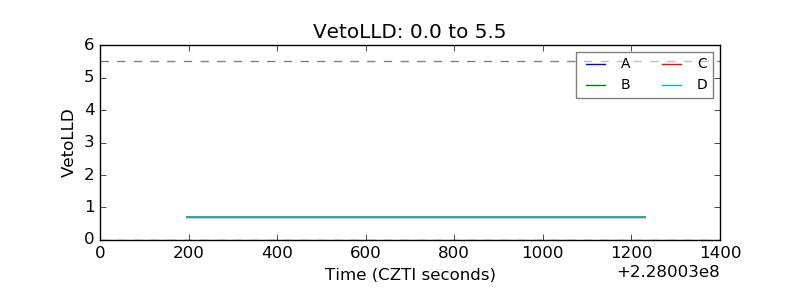 |
| Alpha Counter | 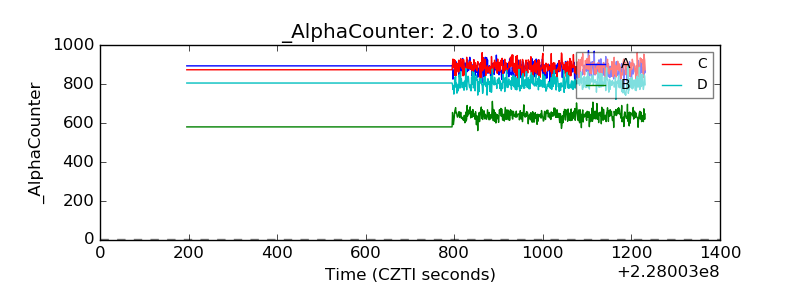 |
| _CPM_Rate | 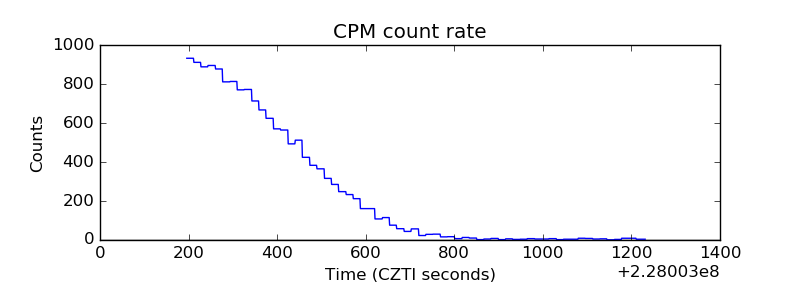 |
| CZT Counter | 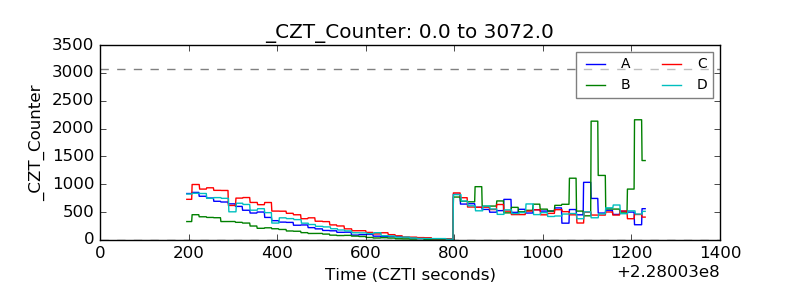 |
| +2.5 Volts monitor |  |
| +5 Volts monitor |  |
| _ROLL_ROT | 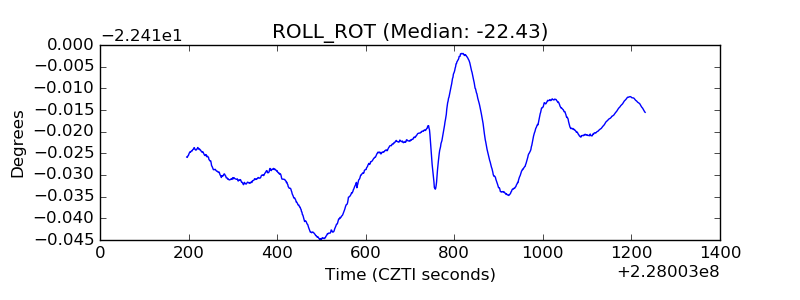 |
| _Roll_DEC | 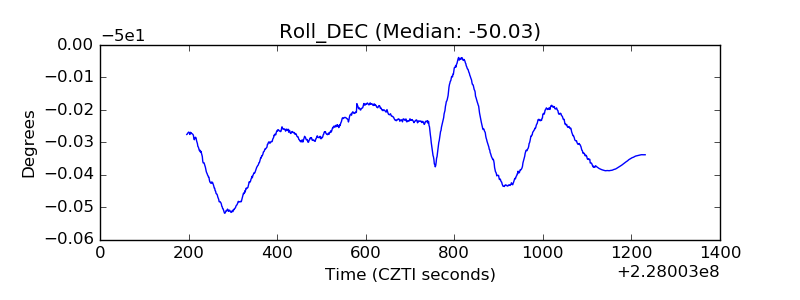 |
| _Roll_RA | 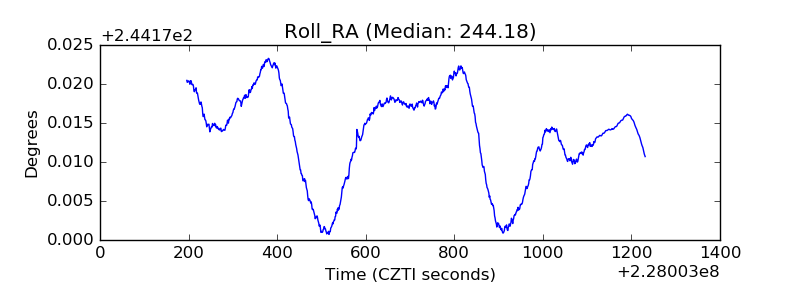 |
| Veto Counter | 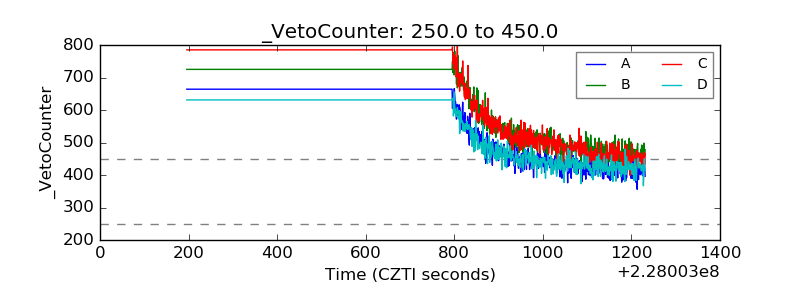 |