| Param | Original file | Final file |
|---|---|---|
| Filename | modeM0/AS1G05_246T02_9000001106cztM0_level2.fits | modeM0/AS1G05_246T02_9000001106cztM0_level2_quad_clean.evt |
| Size (bytes) | 568,676,160 | 584,066,880 |
| Size | 542.3 MB | 557.0 MB |
| Events in quadrant A | 3,413,666 | 3,512,568 |
| Events in quadrant B | 3,311,268 | 3,549,240 |
| Events in quadrant C | 3,394,950 | 3,357,631 |
| Events in quadrant D | 2,859,512 | 3,028,300 |
| Mode M0 | |||
|---|---|---|---|
| Quadrant | BADHDUFLAG | Total packets | Discarded packets |
| A | 0 | 135718 | 0 |
| B | 0 | 135391 | 0 |
| C | 0 | 129743 | 0 |
| D | 0 | 149274 | 0 |
| Mode SS | |||
|---|---|---|---|
| Quadrant | BADHDUFLAG | Total packets | Discarded packets |
| A | 0 | 1252 | 0 |
| B | 0 | 1252 | 0 |
| C | 0 | 1252 | 0 |
| D | 0 | 1252 | 0 |
| Mode M9 | |||
|---|---|---|---|
| Quadrant | BADHDUFLAG | Total packets | Discarded packets |
| A | 0 | 68 | 0 |
| B | 0 | 68 | 0 |
| C | 0 | 68 | 0 |
| D | 0 | 68 | 0 |
| Quadrant | Total seconds | Saturated seconds | Saturation percentage |
|---|---|---|---|
| A | 61835 | 1332 | 2.154120% |
| B | 61835 | 1523 | 2.463006% |
| C | 61835 | 1032 | 1.668958% |
| D | 61835 | 2784 | 4.502305% |
Noise dominated data is calculated using 1-second bins in cleaned event files. If a bin has >2000 counts, and if more than 50% of those come from <1% of pixels, then it is considered to be noise-dominated and hence unusable.
| Quadrant | # 1 sec bins | Bins with >0 counts | Bins with >2000 counts | High rate bins dominated by noise | Noise dominated (total time) | Noise dominated (detector-on time) | Marked lightcurve |
|---|---|---|---|---|---|---|---|
| A | 82254 | 61837 | 0 | 0 | 0.00% | 0.00% | 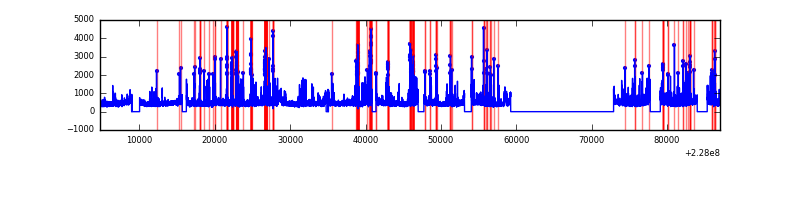 |
| B | 82254 | 61835 | 0 | 0 | 0.00% | 0.00% | 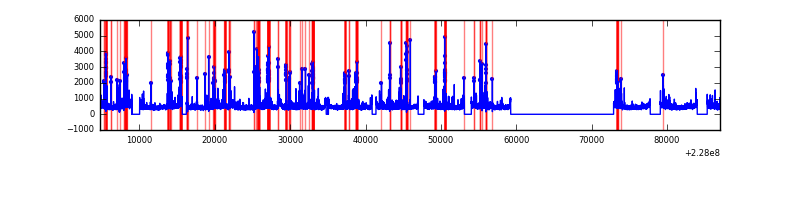 |
| C | 82254 | 61834 | 0 | 0 | 0.00% | 0.00% |  |
| D | 82254 | 61822 | 0 | 0 | 0.00% | 0.00% | 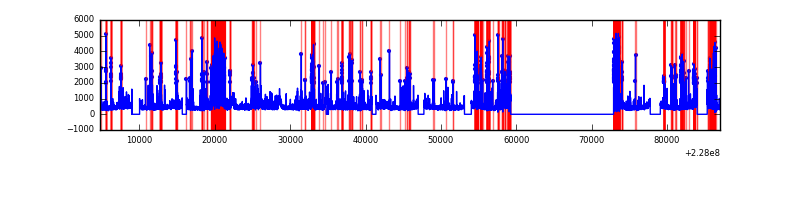 |
Top three noisy pixels from each quadrant. If the there are fewer than three noisy pixels in the level2.evt file, extra rows are filled as -1
| Pixel properties | Quadrant properties | ||||||
|---|---|---|---|---|---|---|---|
| Quadrant | DetID | PixID | Counts | Sigma | Mean | Median | Sigma |
| A | 14 | 188 | 3338 | 11.08 | 885 | 825 | 226.7 |
| A | 0 | 29 | 3299 | 10.91 | 885 | 825 | 226.7 |
| A | 7 | 110 | 2912 | 9.21 | 885 | 825 | 226.7 |
| B | 2 | 9 | 2900 | 11.78 | 874 | 831 | 175.7 |
| B | 3 | 17 | 2267 | 8.17 | 874 | 831 | 175.7 |
| B | 12 | 226 | 2256 | 8.11 | 874 | 831 | 175.7 |
| C | 1 | 81 | 2479 | 6.94 | 895 | 824 | 238.5 |
| C | 1 | 80 | 2473 | 6.91 | 895 | 824 | 238.5 |
| C | 12 | 241 | 2418 | 6.68 | 895 | 824 | 238.5 |
| D | 6 | 231 | 2121 | 6.23 | 816 | 738 | 221.8 |
| D | 1 | 19 | 2014 | 5.75 | 816 | 738 | 221.8 |
| D | 3 | 159 | 2004 | 5.71 | 816 | 738 | 221.8 |
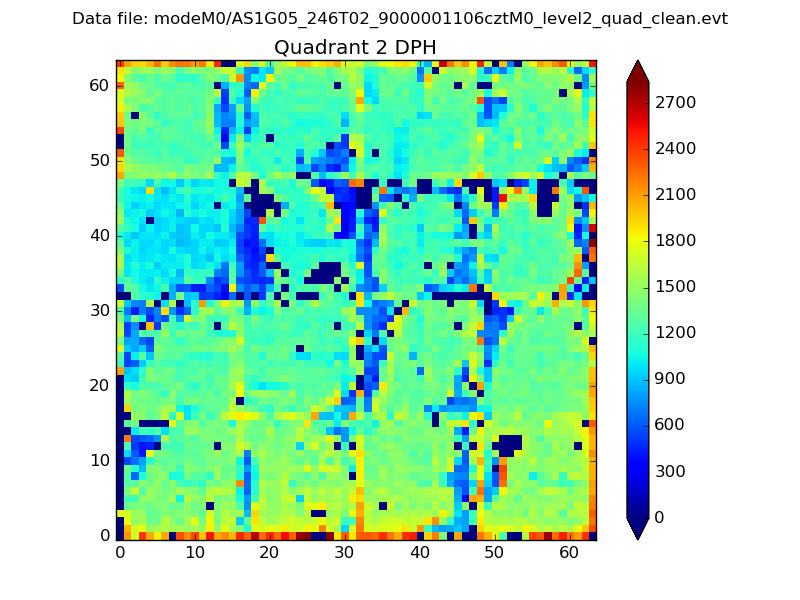
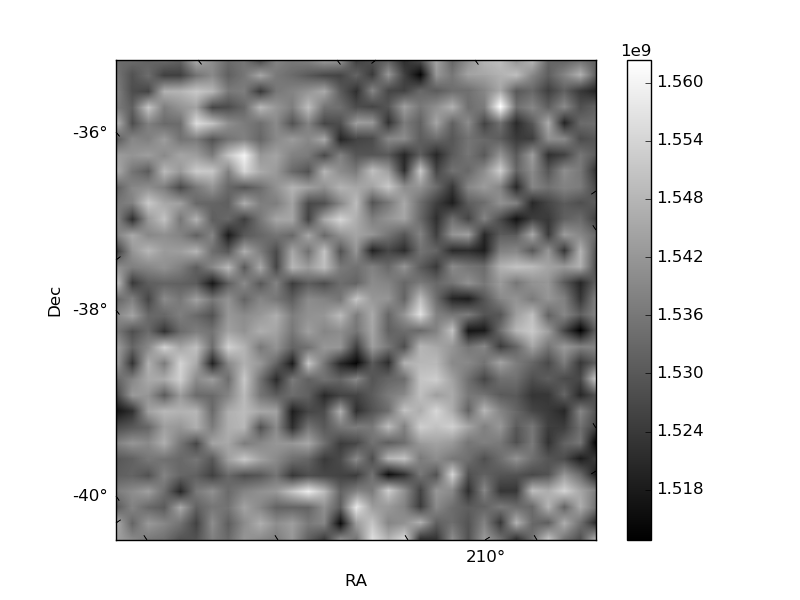
Histogram calculated using DETX and DETY for each event in the final _common_clean file
| Quadrant A | 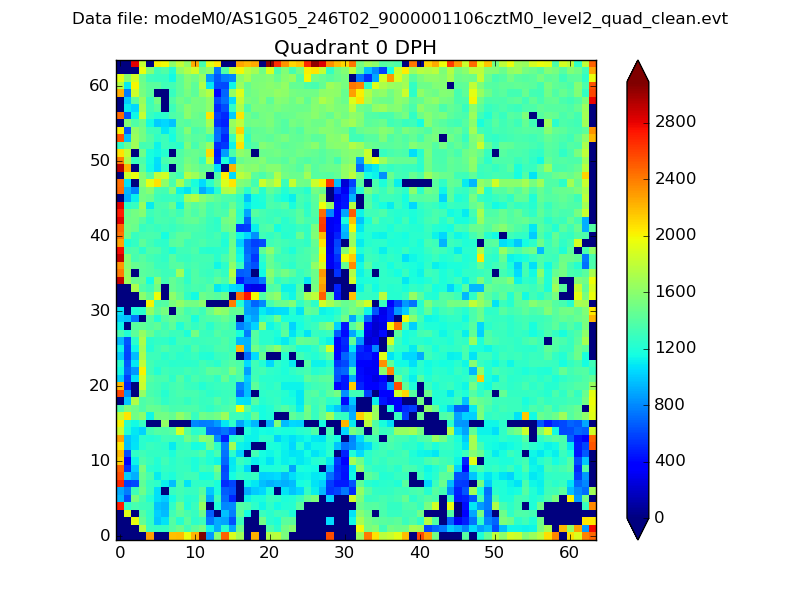 |
 |
Quadrant B |
|---|---|---|---|
| Quadrant D | 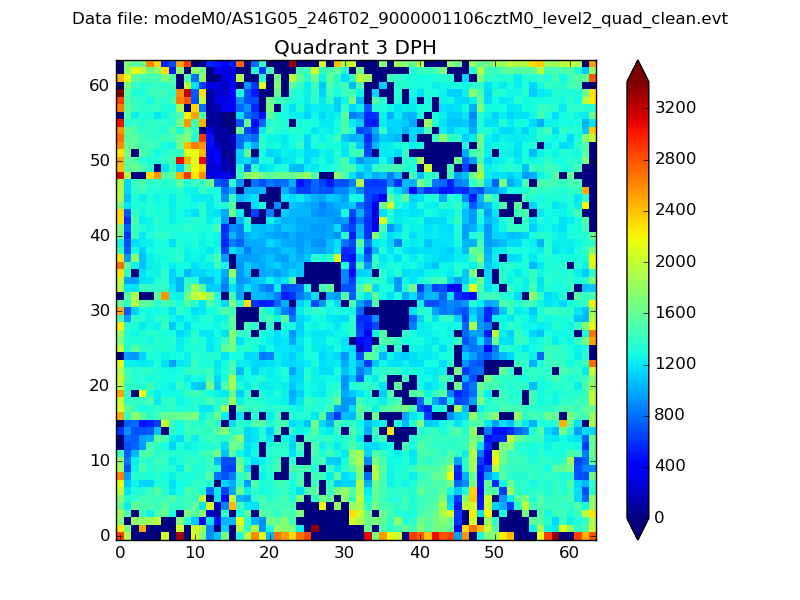 |
 |
Quadrant C |
| Plot type | Count rate plots | Images |
|---|---|---|
| Comparison with Poisson distribution Blue bars denote a histogram of data divided into 1 sec bins. Red curve is a Poisson curve with rate = median count rate of data. |
 |
 |
| Quadrant-wise count rates Data is divided into 100 sec bins |
 |
|
| Module-wise count rates for Quadrant A Data is divided into 100 sec bins |
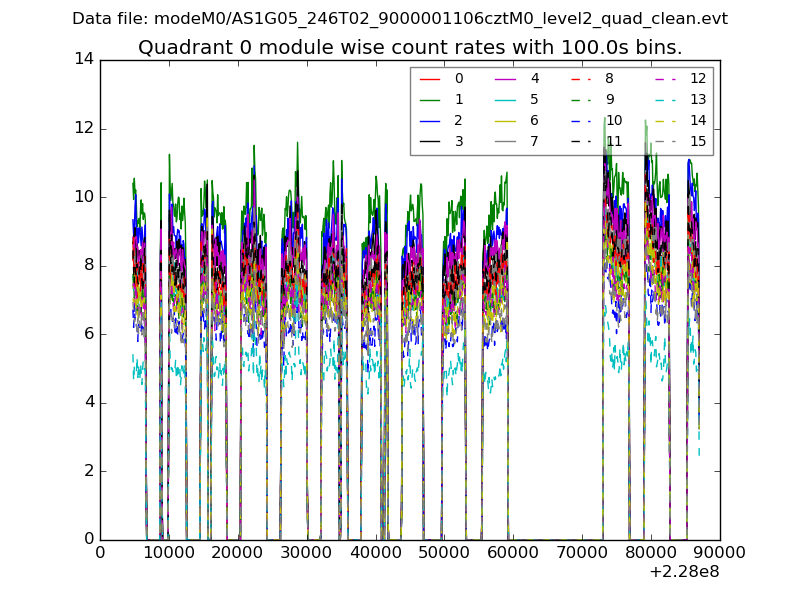 |
 |
| Module-wise count rates for Quadrant B Data is divided into 100 sec bins |
 |
 |
| Module-wise count rates for Quadrant C Data is divided into 100 sec bins |
 |
 |
| Module-wise count rates for Quadrant D Data is divided into 100 sec bins |
 |
 |
| Parameter | Plot |
|---|---|
| CZT HV Monitor |  |
| D_VDD |  |
| Temperature 1 |  |
| Veto HV Monitor |  |
| Veto LLD |  |
| Alpha Counter | 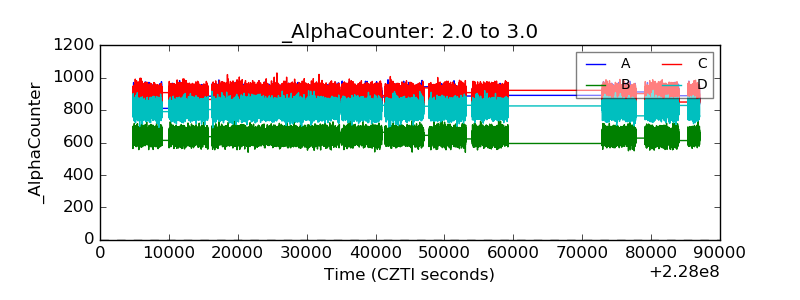 |
| _CPM_Rate |  |
| CZT Counter | 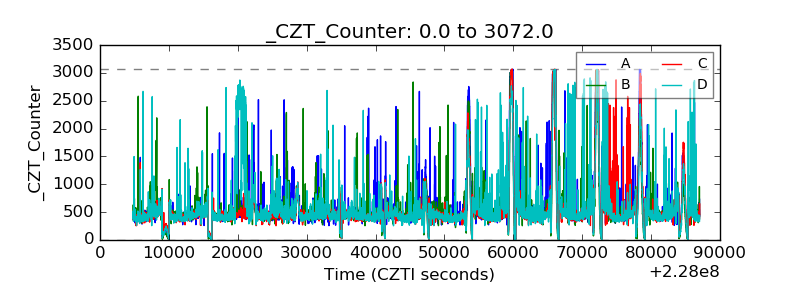 |
| +2.5 Volts monitor | 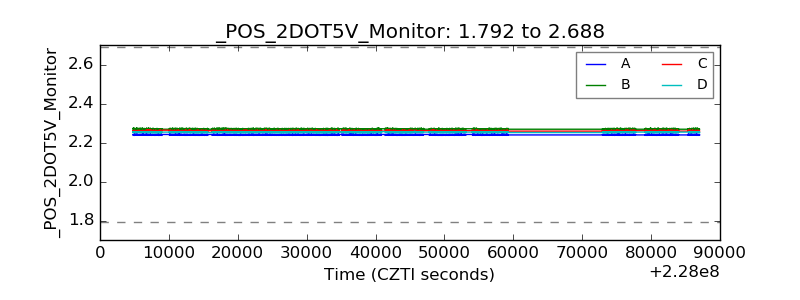 |
| +5 Volts monitor | 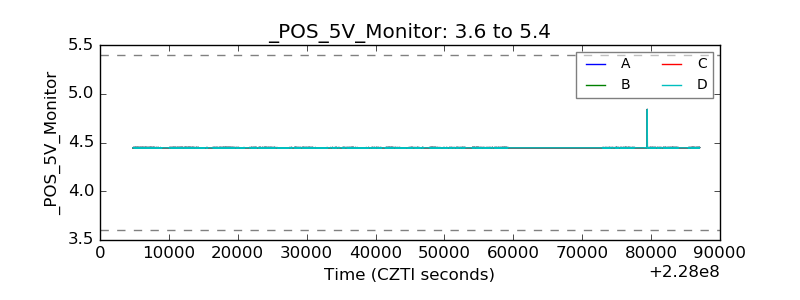 |
| _ROLL_ROT | 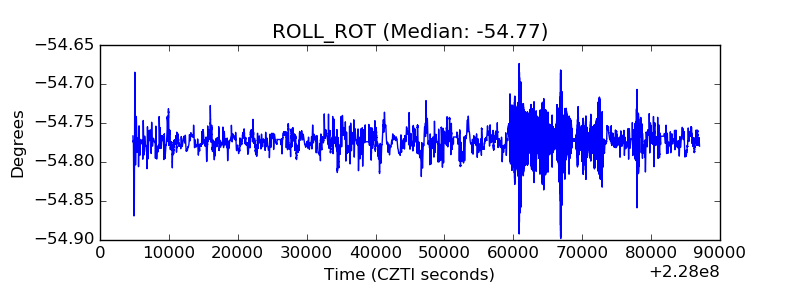 |
| _Roll_DEC | 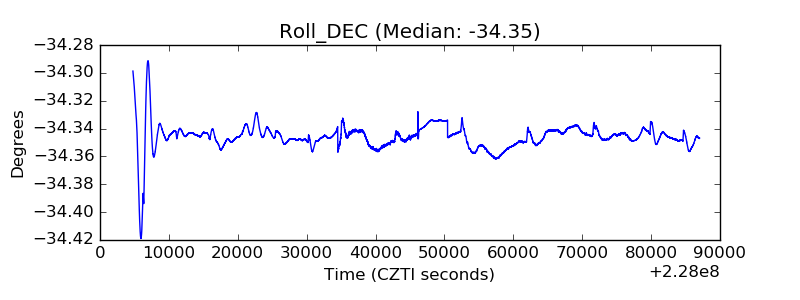 |
| _Roll_RA | 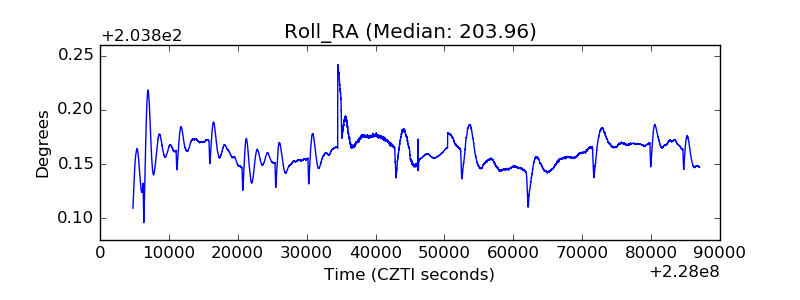 |
| Veto Counter | 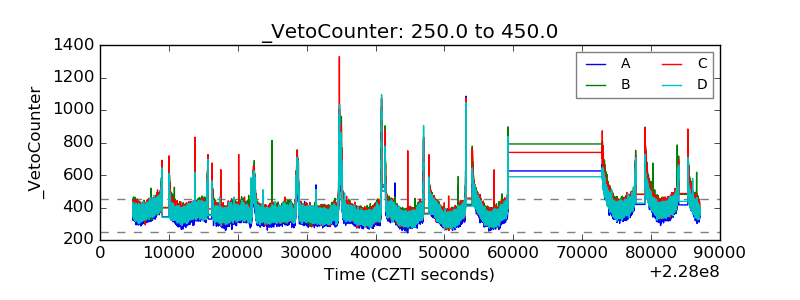 |