| Param | Original file | Final file |
|---|---|---|
| Filename | modeM0/AS1G05_246T02_9000001106_08037cztM0_level2.evt | modeM0/AS1G05_246T02_9000001106_08037cztM0_level2_quad_clean.evt |
| Size (bytes) | 680,152,320 | 124,358,400 |
| Size | 648.6 MB | 118.6 MB |
| Events in quadrant A | 4,504,625 | 799,048 |
| Events in quadrant B | 4,535,991 | 817,349 |
| Events in quadrant C | 4,002,954 | 804,815 |
| Events in quadrant D | 6,966,113 | 742,077 |
| Mode M0 | |||
|---|---|---|---|
| Quadrant | BADHDUFLAG | Total packets | Discarded packets |
| A | 0 | 19403 | 2 |
| B | 0 | 19449 | 1 |
| C | 0 | 18005 | 1 |
| D | 0 | 27029 | 1 |
| Mode SS | |||
|---|---|---|---|
| Quadrant | BADHDUFLAG | Total packets | Discarded packets |
| A | 0 | 174 | 0 |
| B | 0 | 174 | 0 |
| C | 0 | 174 | 0 |
| D | 0 | 174 | 0 |
| Mode M9 | |||
|---|---|---|---|
| Quadrant | BADHDUFLAG | Total packets | Discarded packets |
| A | 0 | 6 | 0 |
| B | 0 | 6 | 0 |
| C | 0 | 6 | 0 |
| D | 0 | 6 | 0 |
| Quadrant | Total seconds | Saturated seconds | Saturation percentage |
|---|---|---|---|
| A | 8686 | 255 | 2.935759% |
| B | 8686 | 331 | 3.810730% |
| C | 8686 | 184 | 2.118351% |
| D | 8686 | 1335 | 15.369560% |
Noise dominated data is calculated using 1-second bins in cleaned event files. If a bin has >2000 counts, and if more than 50% of those come from <1% of pixels, then it is considered to be noise-dominated and hence unusable.
| Quadrant | # 1 sec bins | Bins with >0 counts | Bins with >2000 counts | High rate bins dominated by noise | Noise dominated (total time) | Noise dominated (detector-on time) | Marked lightcurve |
|---|---|---|---|---|---|---|---|
| A | 9236 | 8687 | 71 | 71 | 0.77% | 0.82% | 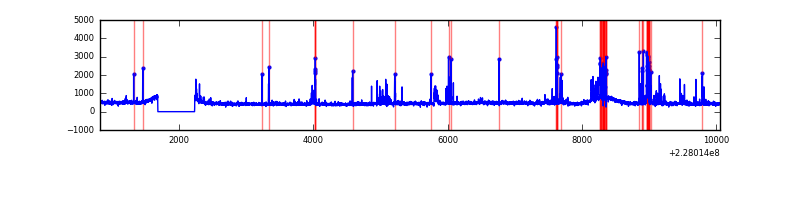 |
| B | 9236 | 8687 | 54 | 54 | 0.58% | 0.62% | 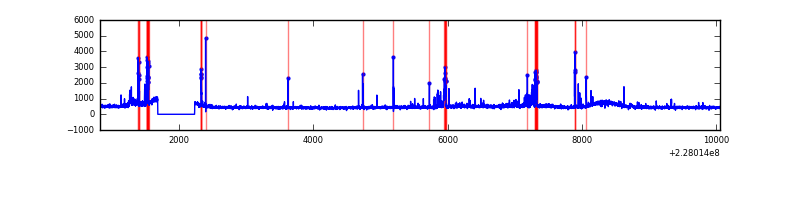 |
| C | 9236 | 8687 | 0 | 0 | 0.00% | 0.00% | 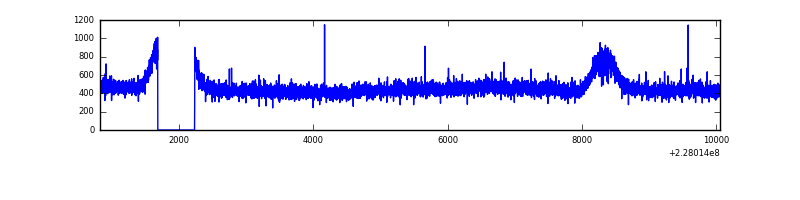 |
| D | 9236 | 8687 | 1038 | 1038 | 11.24% | 11.95% | 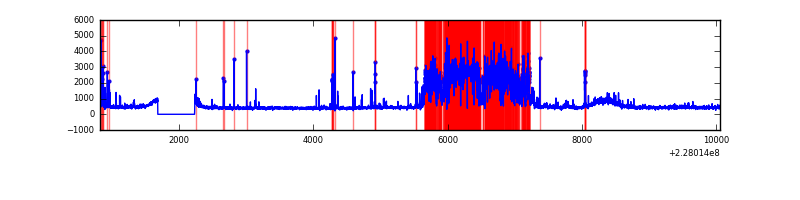 |
Top three noisy pixels from each quadrant. If the there are fewer than three noisy pixels in the level2.evt file, extra rows are filled as -1
| Pixel properties | Quadrant properties | ||||||
|---|---|---|---|---|---|---|---|
| Quadrant | DetID | PixID | Counts | Sigma | Mean | Median | Sigma |
| A | 4 | 2 | 552130 | 2620.35 | 1024 | 997 | 210.3 |
| A | 0 | 226 | 9478 | 40.32 | 1024 | 997 | 210.3 |
| A | 13 | 251 | 9218 | 39.09 | 1024 | 997 | 210.3 |
| B | 4 | 239 | 267516 | 1335.83 | 1037 | 1010 | 199.5 |
| B | 10 | 16 | 115452 | 573.62 | 1037 | 1010 | 199.5 |
| B | 11 | 51 | 57731 | 284.3 | 1037 | 1010 | 199.5 |
| C | 1 | 16 | 33448 | 136.75 | 1017 | 1018 | 237.1 |
| C | 13 | 61 | 7767 | 28.46 | 1017 | 1018 | 237.1 |
| C | 8 | 222 | 3115 | 8.84 | 1017 | 1018 | 237.1 |
| D | 13 | 169 | 3203992 | 13313.15 | 932 | 909 | 240.6 |
| D | 12 | 233 | 116037 | 478.51 | 932 | 909 | 240.6 |
| D | 2 | 136 | 35315 | 143.0 | 932 | 909 | 240.6 |
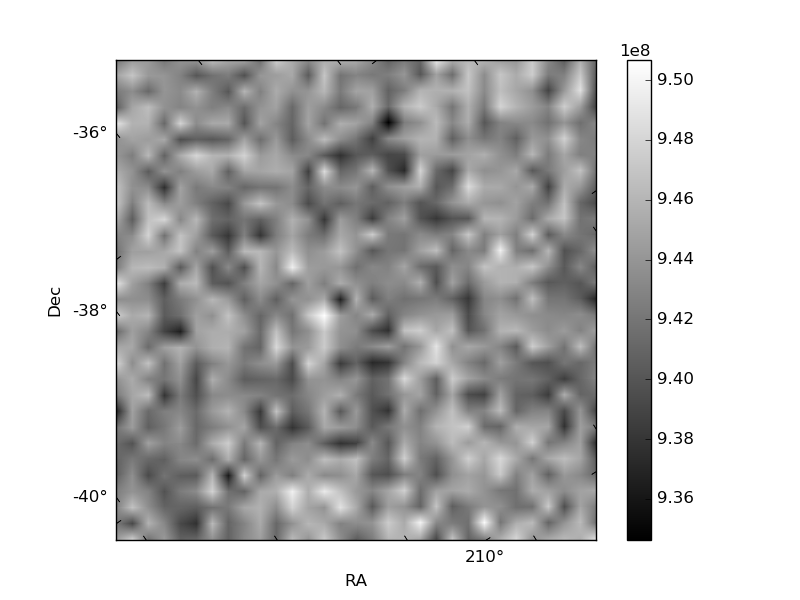
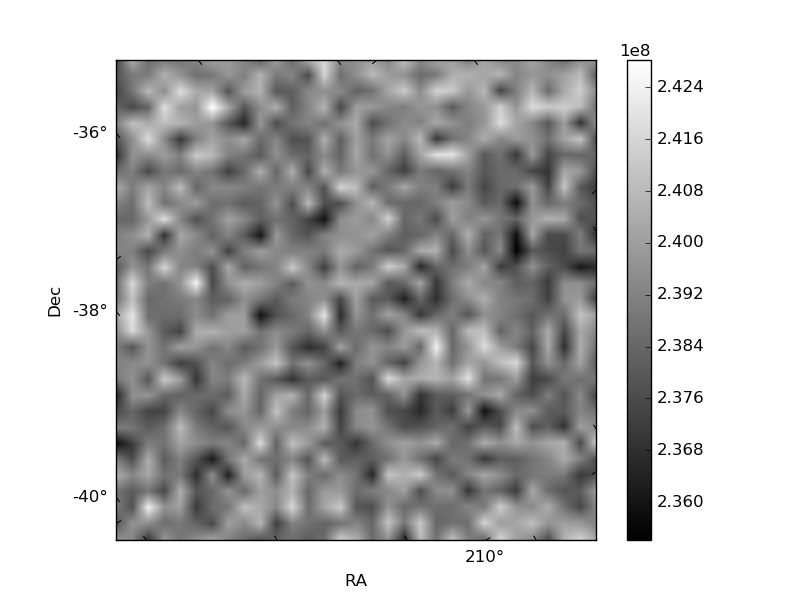
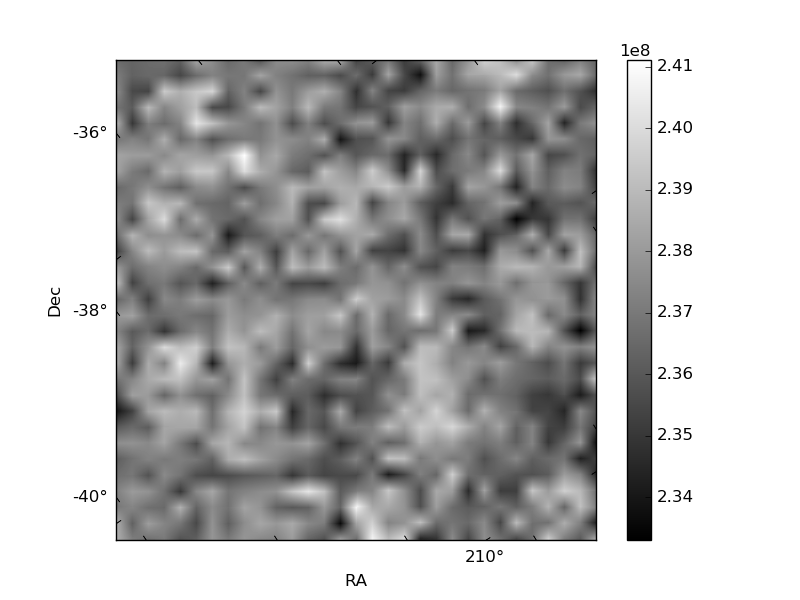
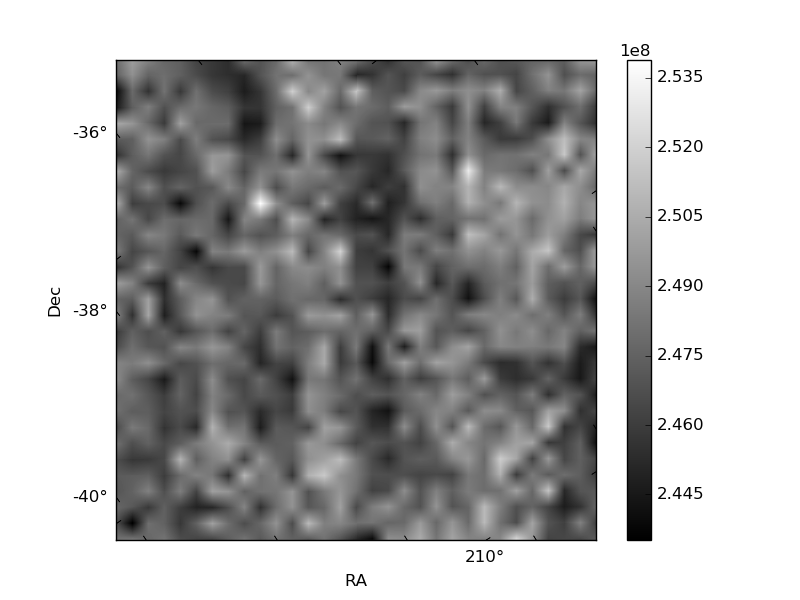
Histogram calculated using DETX and DETY for each event in the final _common_clean file
| Quadrant A | 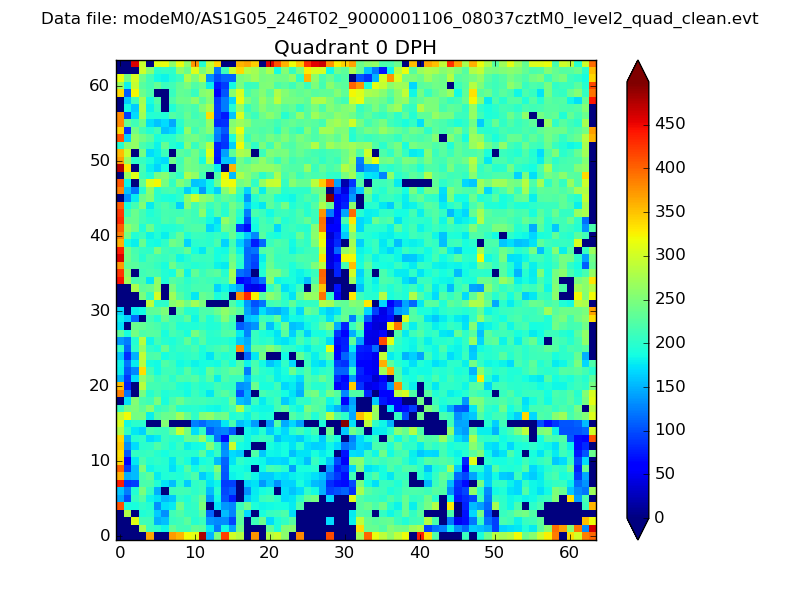 |
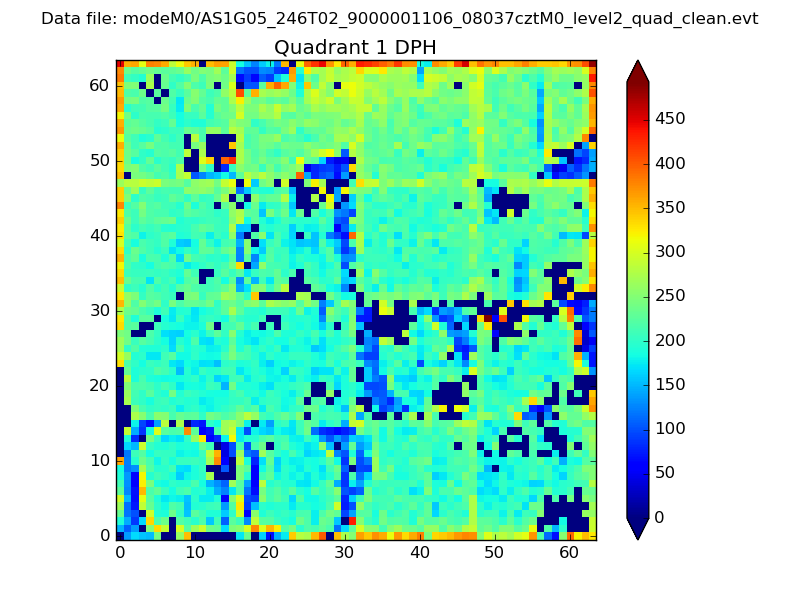 |
Quadrant B |
|---|---|---|---|
| Quadrant D | 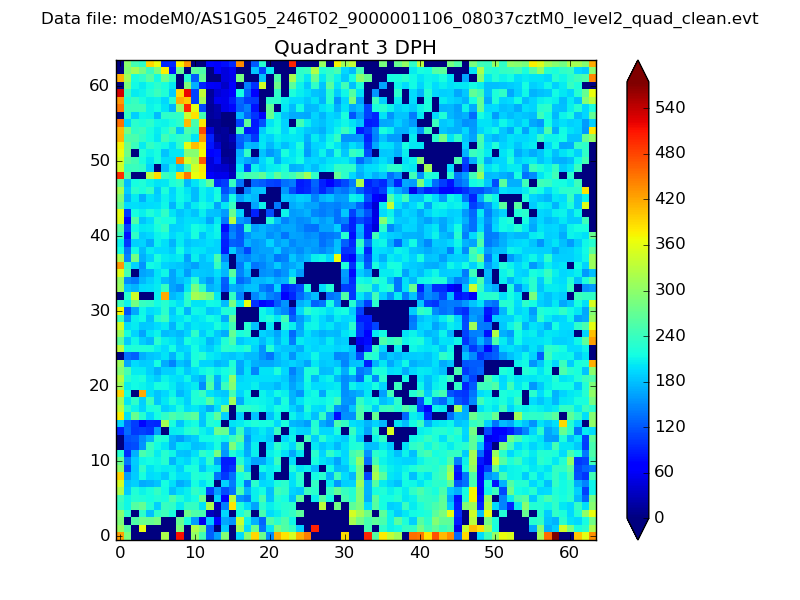 |
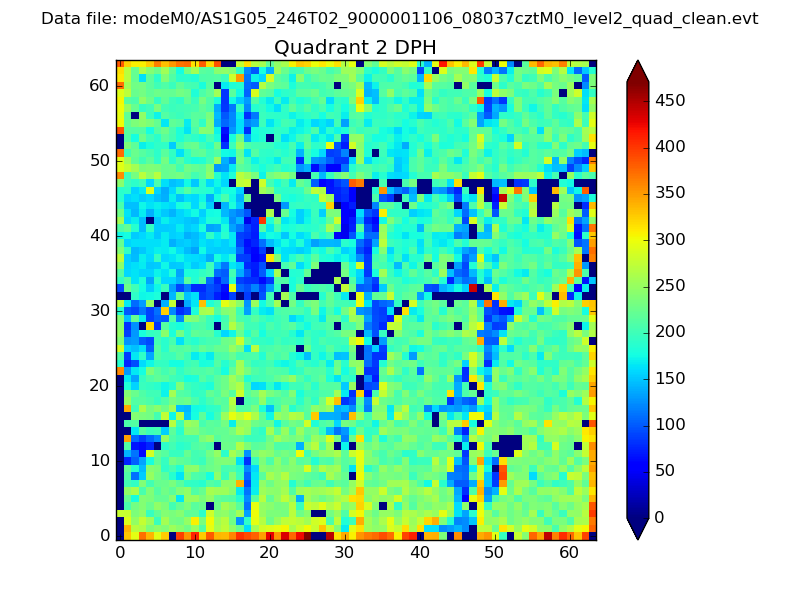 |
Quadrant C |
| Plot type | Count rate plots | Images |
|---|---|---|
| Comparison with Poisson distribution Blue bars denote a histogram of data divided into 1 sec bins. Red curve is a Poisson curve with rate = median count rate of data. |
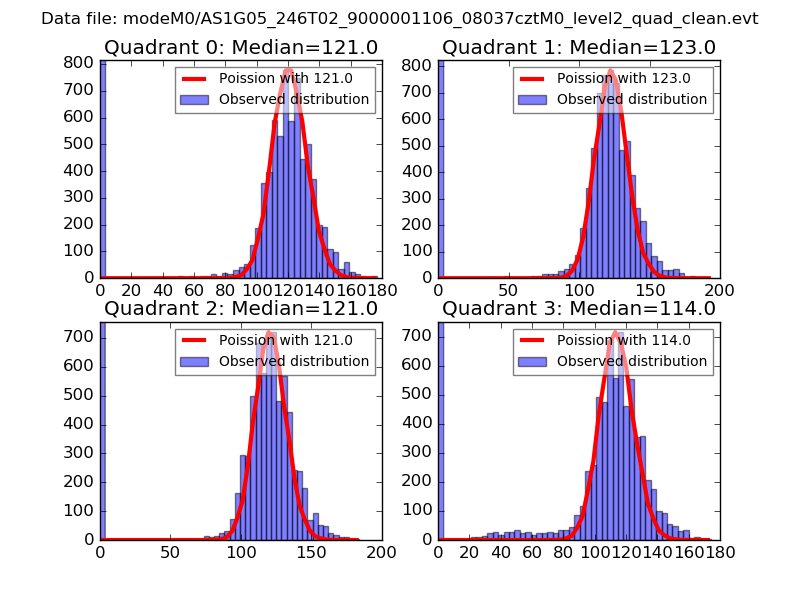 |
 |
| Quadrant-wise count rates Data is divided into 100 sec bins |
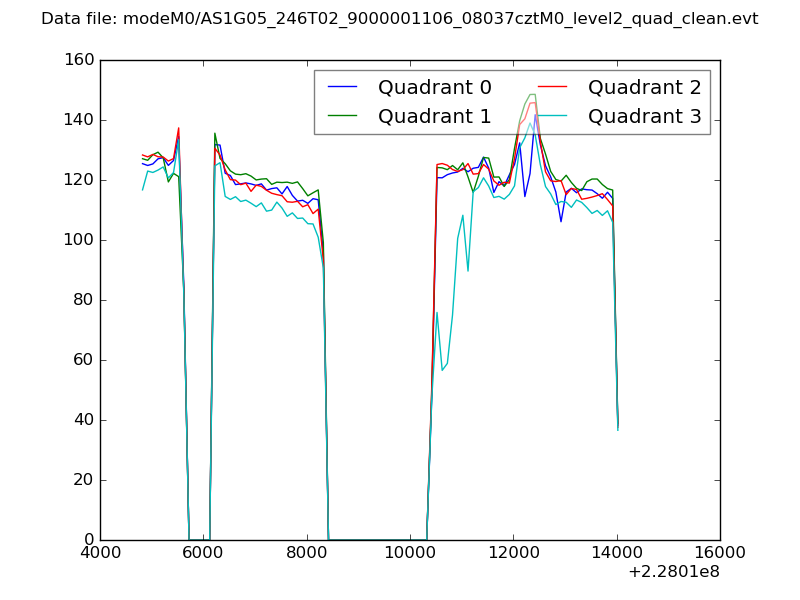 |
|
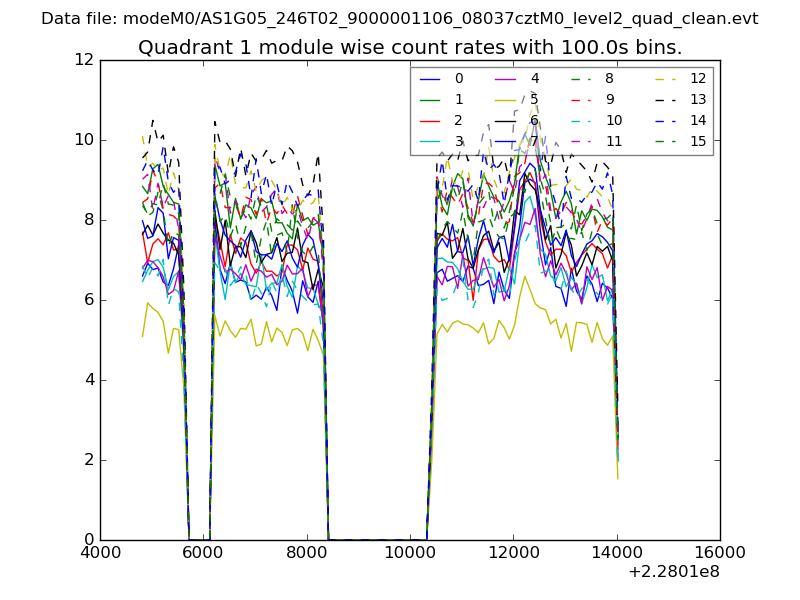
| Module-wise count rates for Quadrant A Data is divided into 100 sec bins |
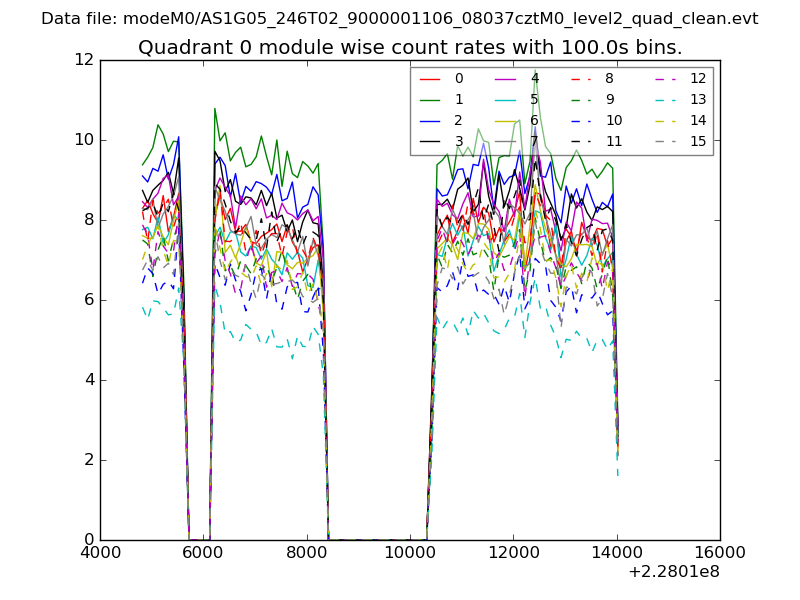 |
 |
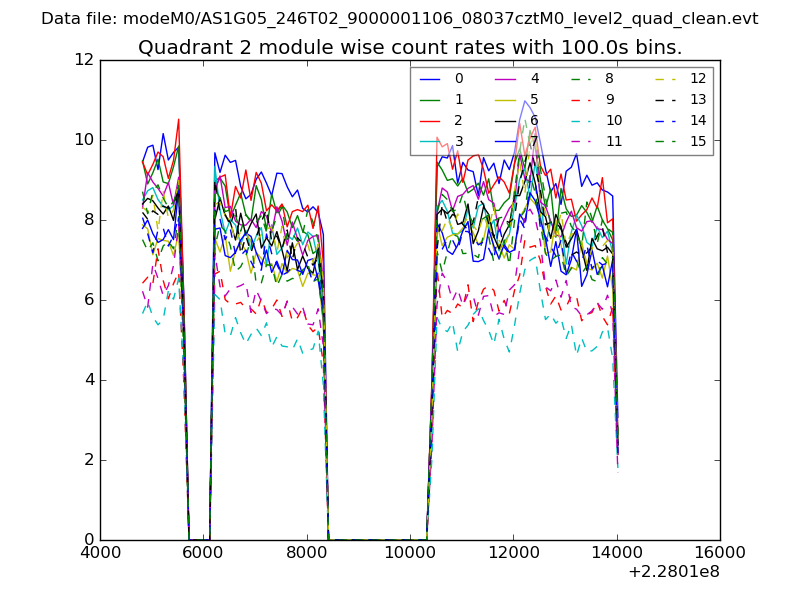
| Module-wise count rates for Quadrant B Data is divided into 100 sec bins |
 |
 |
| Module-wise count rates for Quadrant C Data is divided into 100 sec bins |
 |
 |
| Module-wise count rates for Quadrant D Data is divided into 100 sec bins |
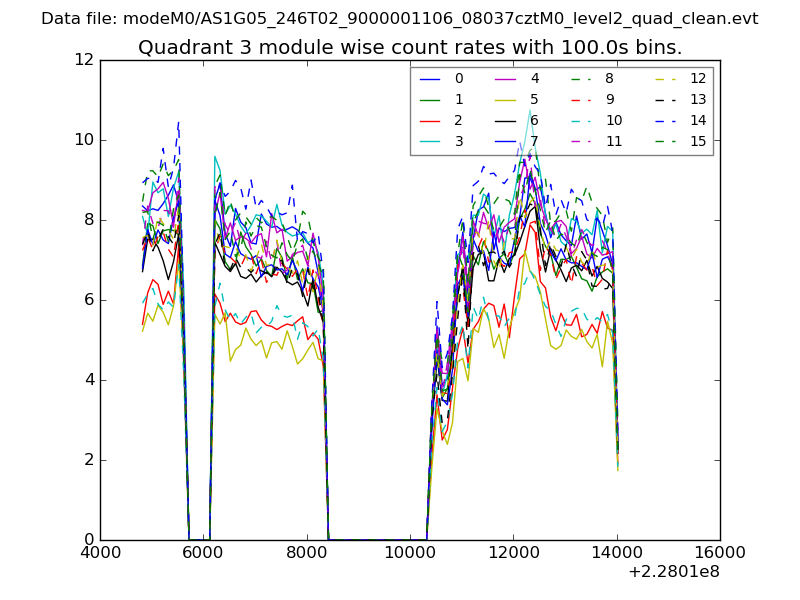 |
 |
| Parameter | Plot |
|---|---|
| CZT HV Monitor | 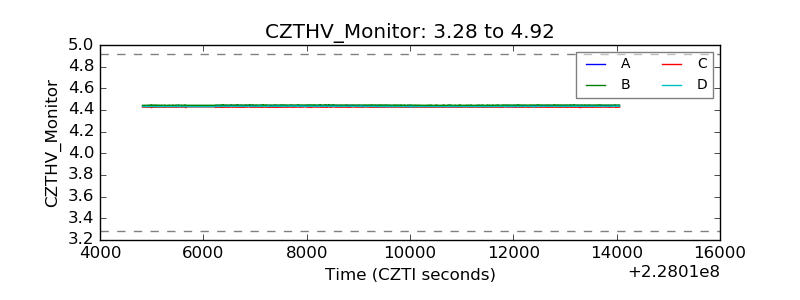 |
| D_VDD | 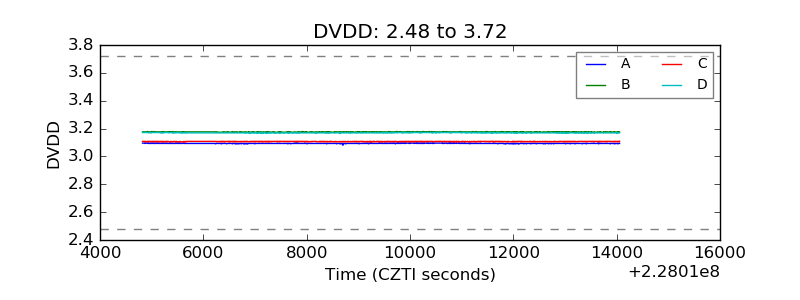 |
| Temperature 1 | 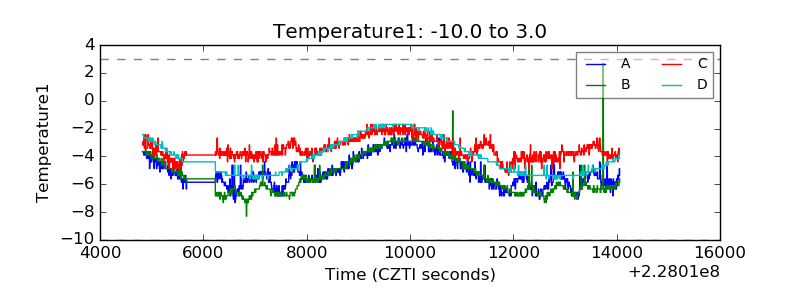 |
| Veto HV Monitor |  |
| Veto LLD | 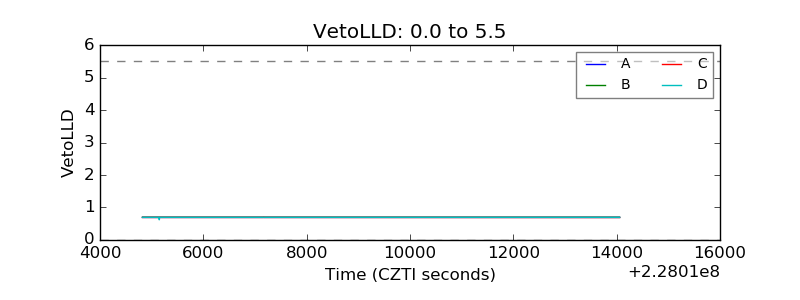 |
| Alpha Counter | 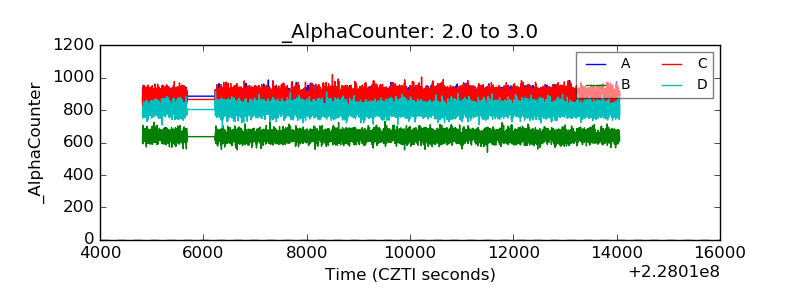 |
| _CPM_Rate | 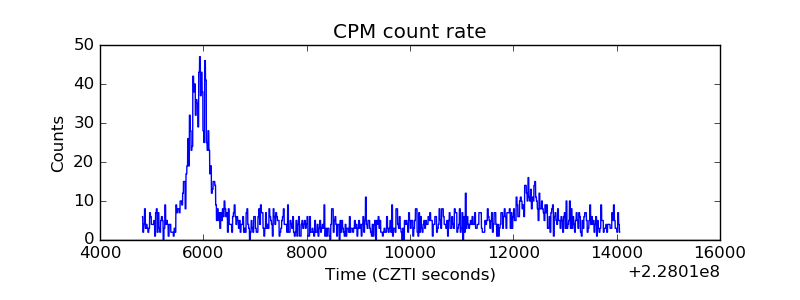 |
| CZT Counter | 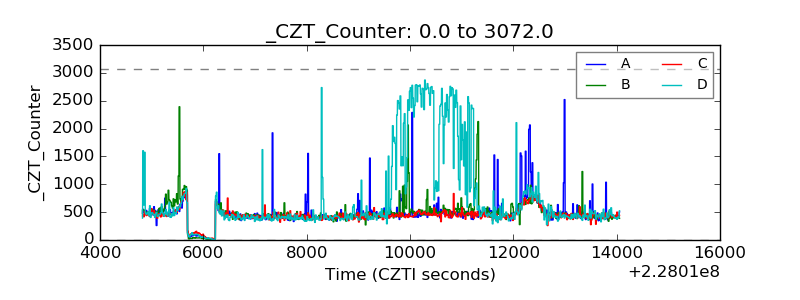 |
| +2.5 Volts monitor |  |
| +5 Volts monitor | 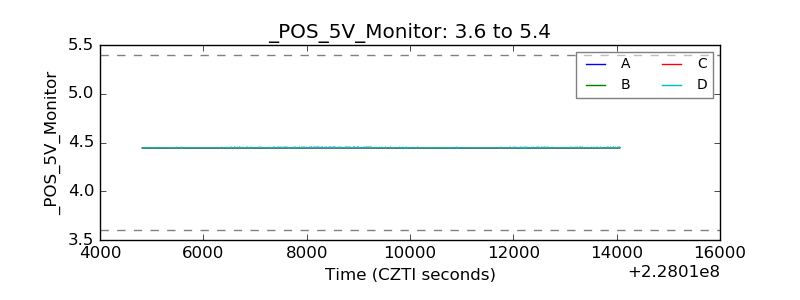 |
| _ROLL_ROT | 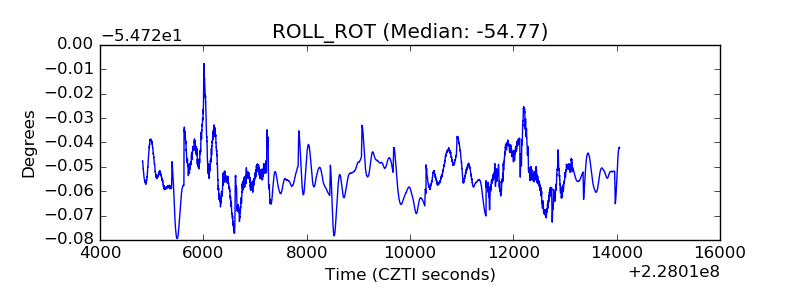 |
| _Roll_DEC | 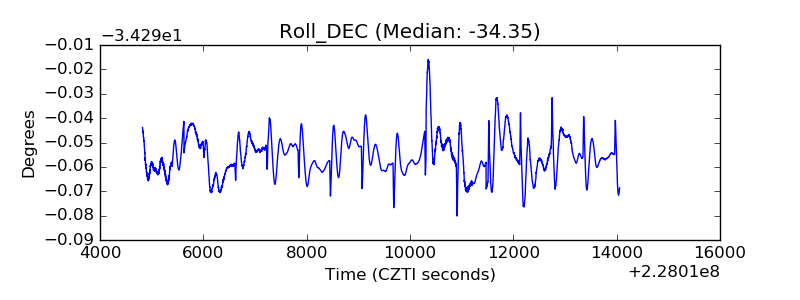 |
| _Roll_RA | 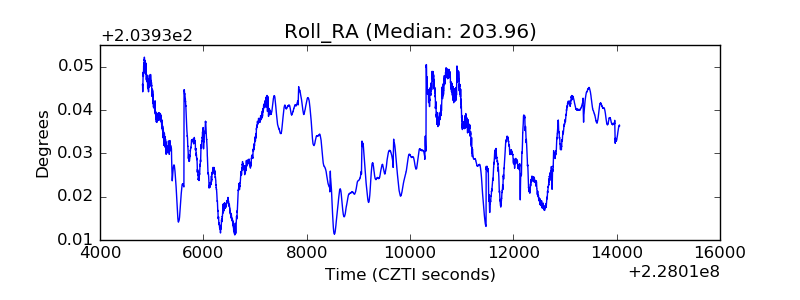 |
| Veto Counter | 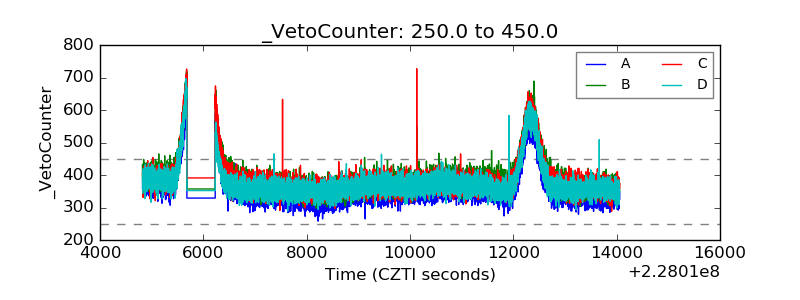 |