| Param | Original file | Final file |
|---|---|---|
| Filename | modeM0/AS1G05_246T02_9000001106_08038cztM0_level2.evt | modeM0/AS1G05_246T02_9000001106_08038cztM0_level2_quad_clean.evt |
| Size (bytes) | 593,688,960 | 115,557,120 |
| Size | 566.2 MB | 110.2 MB |
| Events in quadrant A | 4,731,988 | 725,210 |
| Events in quadrant B | 4,385,675 | 752,415 |
| Events in quadrant C | 3,939,558 | 736,630 |
| Events in quadrant D | 4,357,363 | 706,536 |
| Mode M0 | |||
|---|---|---|---|
| Quadrant | BADHDUFLAG | Total packets | Discarded packets |
| A | 0 | 19851 | 48 |
| B | 0 | 18774 | 54 |
| C | 0 | 17565 | 22 |
| D | 0 | 18834 | 34 |
| Mode SS | |||
|---|---|---|---|
| Quadrant | BADHDUFLAG | Total packets | Discarded packets |
| A | 0 | 168 | 0 |
| B | 0 | 168 | 0 |
| C | 0 | 168 | 0 |
| D | 0 | 168 | 0 |
| Quadrant | Total seconds | Saturated seconds | Saturation percentage |
|---|---|---|---|
| A | 8316 | 525 | 6.313131% |
| B | 8312 | 506 | 6.087584% |
| C | 8322 | 336 | 4.037491% |
| D | 8318 | 359 | 4.315941% |
Noise dominated data is calculated using 1-second bins in cleaned event files. If a bin has >2000 counts, and if more than 50% of those come from <1% of pixels, then it is considered to be noise-dominated and hence unusable.
| Quadrant | # 1 sec bins | Bins with >0 counts | Bins with >2000 counts | High rate bins dominated by noise | Noise dominated (total time) | Noise dominated (detector-on time) | Marked lightcurve |
|---|---|---|---|---|---|---|---|
| A | 8333 | 8333 | 116 | 116 | 1.39% | 1.39% | 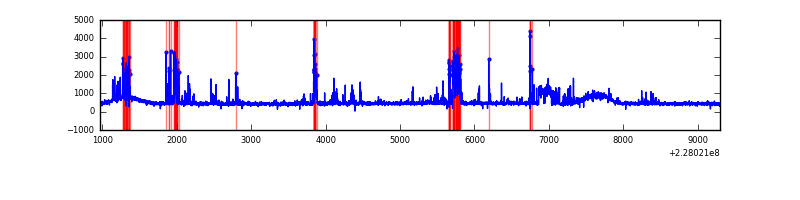 |
| B | 8333 | 8332 | 67 | 67 | 0.80% | 0.80% | 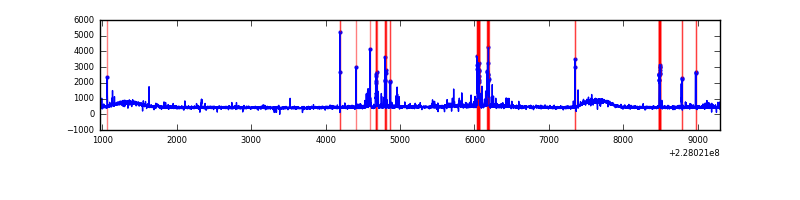 |
| C | 8333 | 8333 | 0 | 0 | 0.00% | 0.00% | 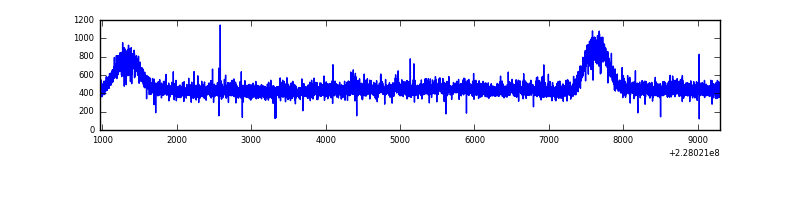 |
| D | 8333 | 8332 | 17 | 17 | 0.20% | 0.20% | 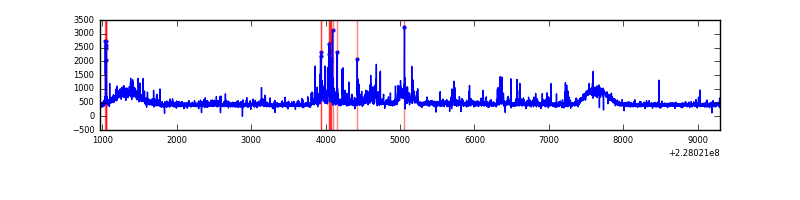 |
Top three noisy pixels from each quadrant. If the there are fewer than three noisy pixels in the level2.evt file, extra rows are filled as -1
| Pixel properties | Quadrant properties | ||||||
|---|---|---|---|---|---|---|---|
| Quadrant | DetID | PixID | Counts | Sigma | Mean | Median | Sigma |
| A | 4 | 2 | 727853 | 3537.94 | 995 | 967 | 205.5 |
| A | 15 | 79 | 162879 | 788.07 | 995 | 967 | 205.5 |
| A | 13 | 251 | 9573 | 41.89 | 995 | 967 | 205.5 |
| B | 4 | 239 | 242329 | 1233.65 | 1008 | 980 | 195.6 |
| B | 11 | 51 | 66079 | 332.75 | 1008 | 980 | 195.6 |
| B | 15 | 85 | 64638 | 325.39 | 1008 | 980 | 195.6 |
| C | 1 | 16 | 48297 | 203.84 | 995 | 996 | 232.0 |
| C | 13 | 61 | 7827 | 29.44 | 995 | 996 | 232.0 |
| C | 8 | 222 | 4919 | 16.91 | 995 | 996 | 232.0 |
| D | 13 | 169 | 452334 | 1803.07 | 980 | 950 | 250.3 |
| D | 12 | 233 | 84538 | 333.9 | 980 | 950 | 250.3 |
| D | 1 | 52 | 46357 | 181.38 | 980 | 950 | 250.3 |
Histogram calculated using DETX and DETY for each event in the final _common_clean file
| Quadrant A | 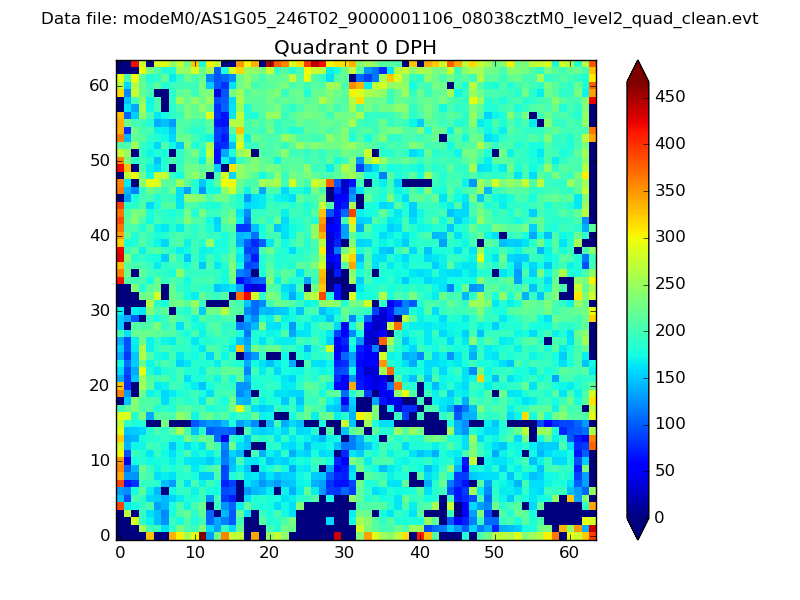 |
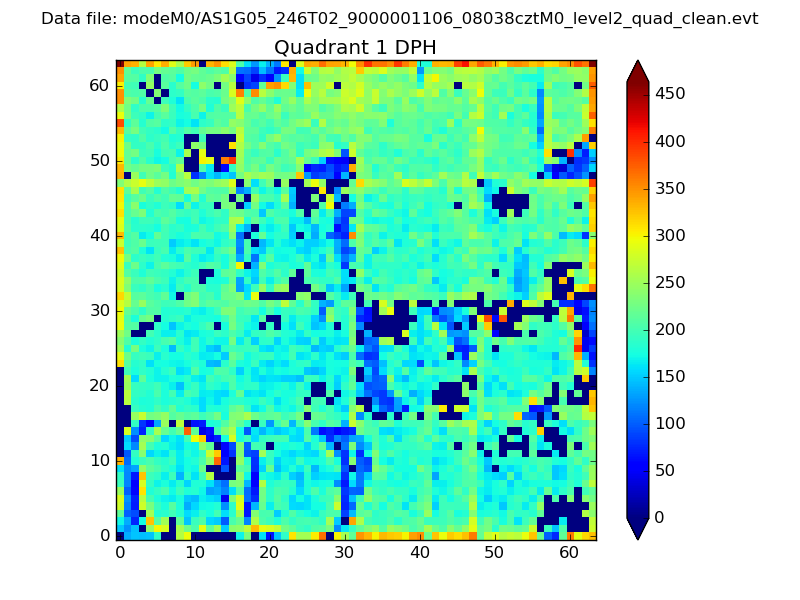 |
Quadrant B |
|---|---|---|---|
| Quadrant D | 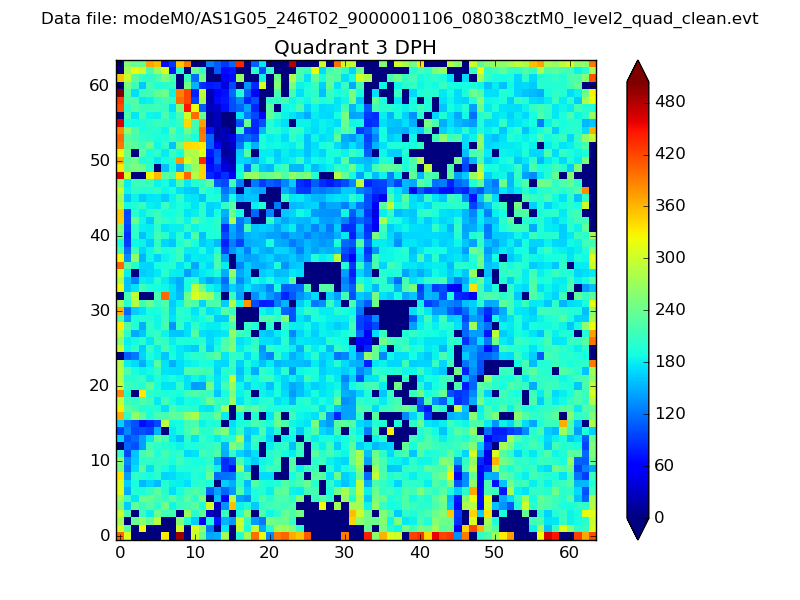 |
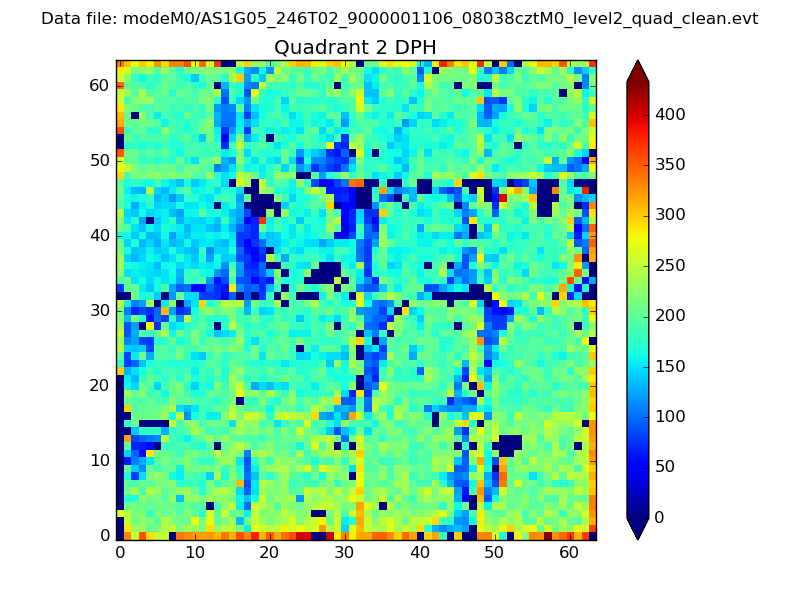 |
Quadrant C |
| Plot type | Count rate plots | Images |
|---|---|---|
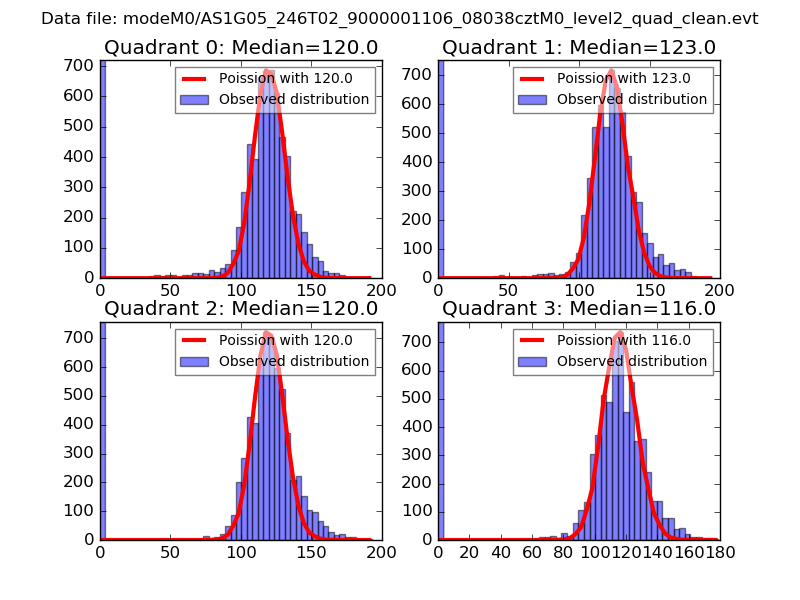
| Comparison with Poisson distribution Blue bars denote a histogram of data divided into 1 sec bins. Red curve is a Poisson curve with rate = median count rate of data. |
 |
 |
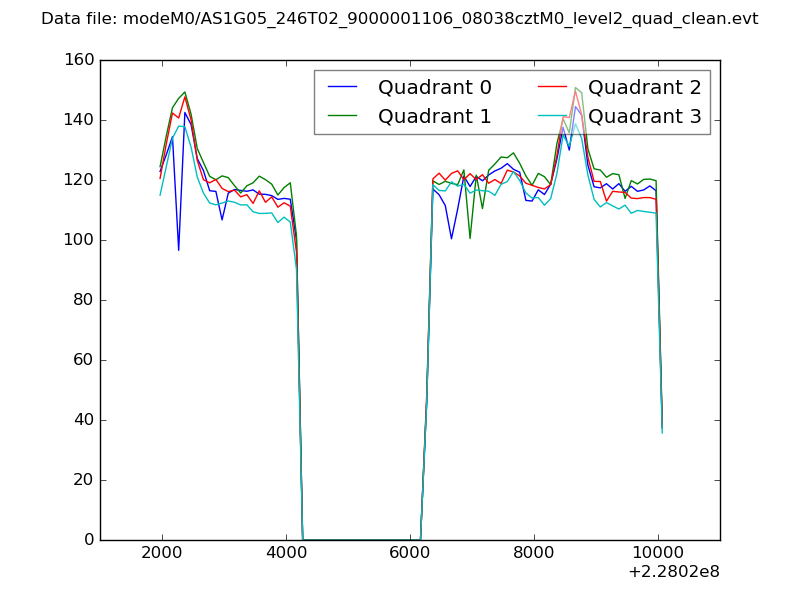
| Quadrant-wise count rates Data is divided into 100 sec bins |
 |
|
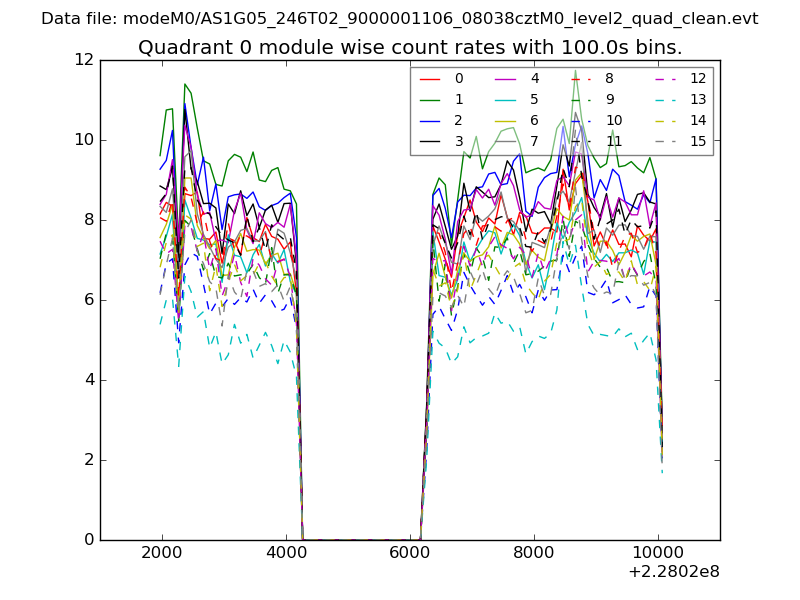
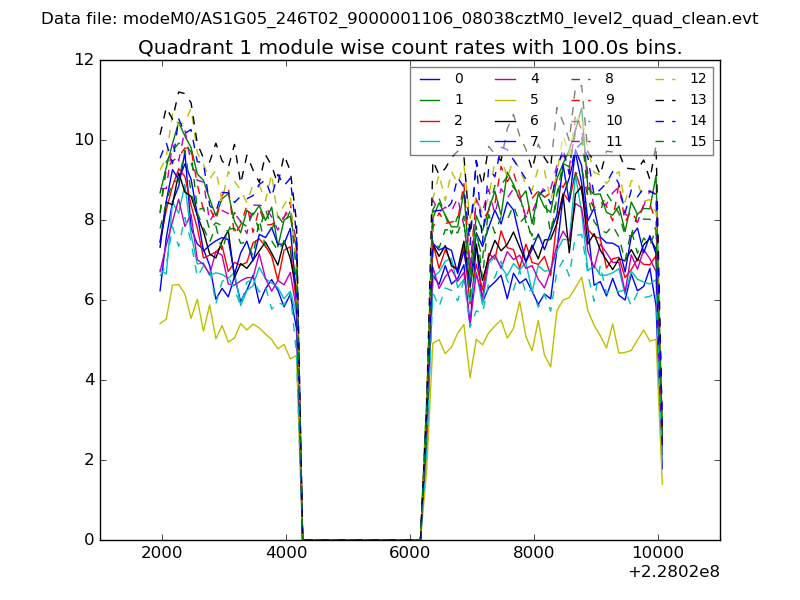
| Module-wise count rates for Quadrant A Data is divided into 100 sec bins |
 |
 |
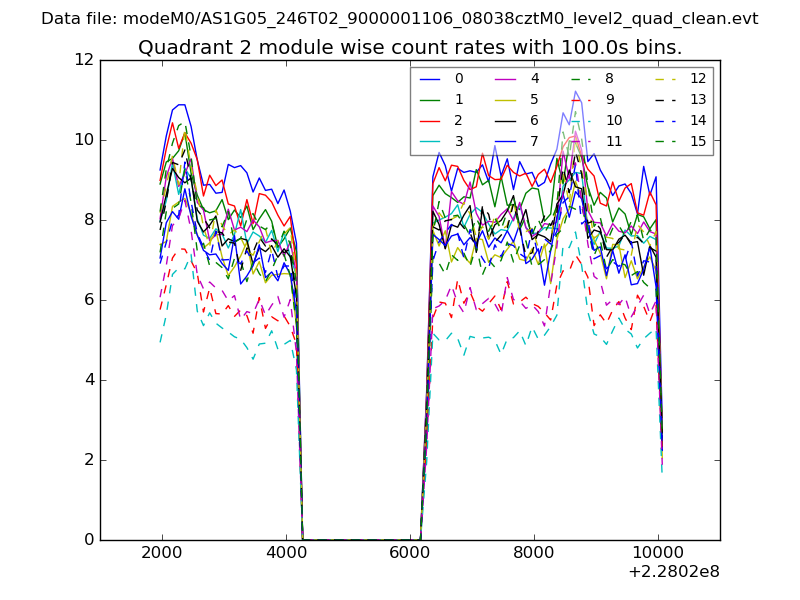
| Module-wise count rates for Quadrant B Data is divided into 100 sec bins |
 |
 |
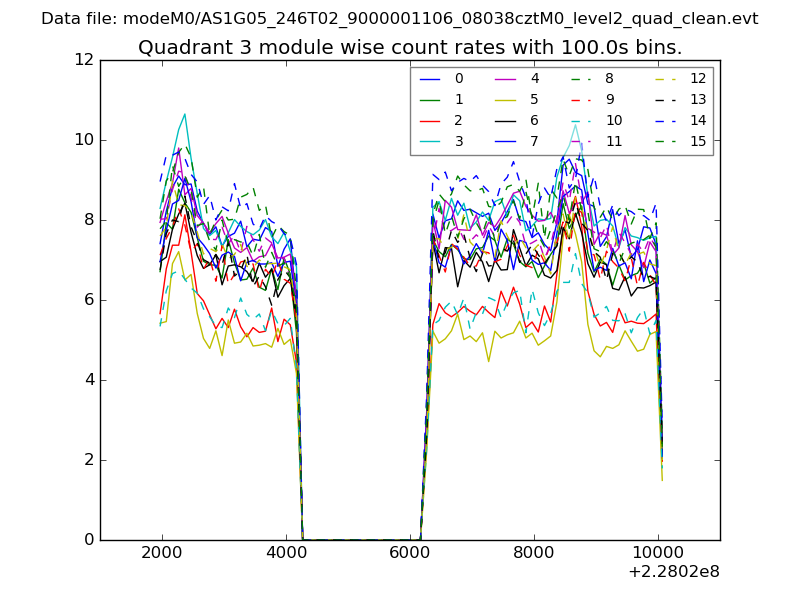
| Module-wise count rates for Quadrant C Data is divided into 100 sec bins |
 |
 |
| Module-wise count rates for Quadrant D Data is divided into 100 sec bins |
 |
 |
| Parameter | Plot |
|---|---|
| CZT HV Monitor | 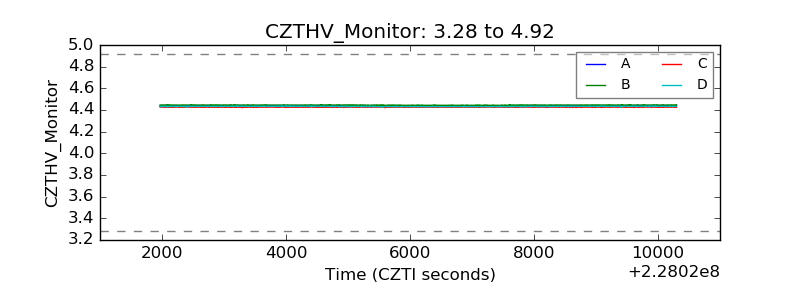 |
| D_VDD |  |
| Temperature 1 |  |
| Veto HV Monitor | 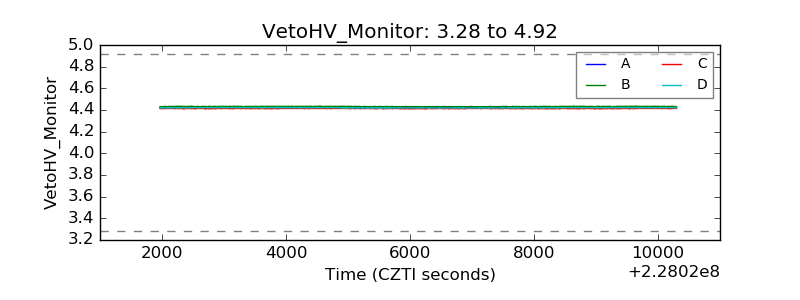 |
| Veto LLD | 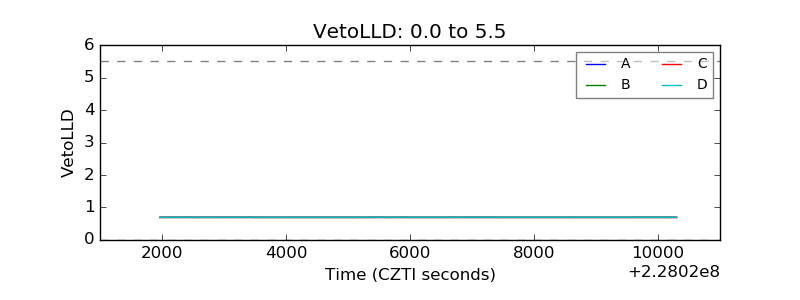 |
| Alpha Counter | 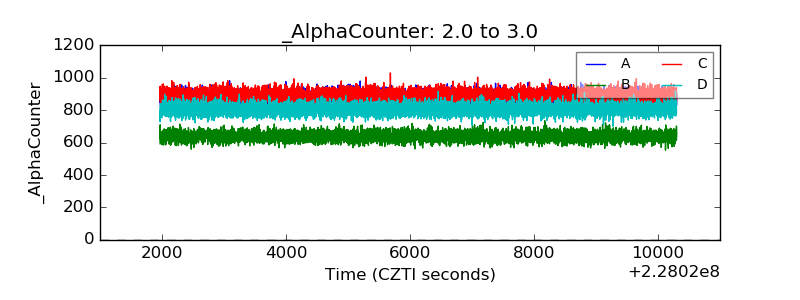 |
| _CPM_Rate | 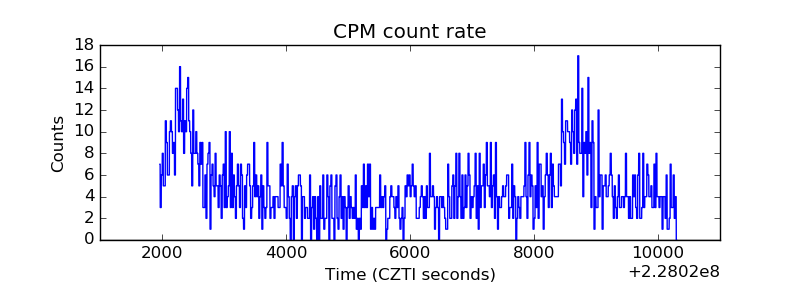 |
| CZT Counter | 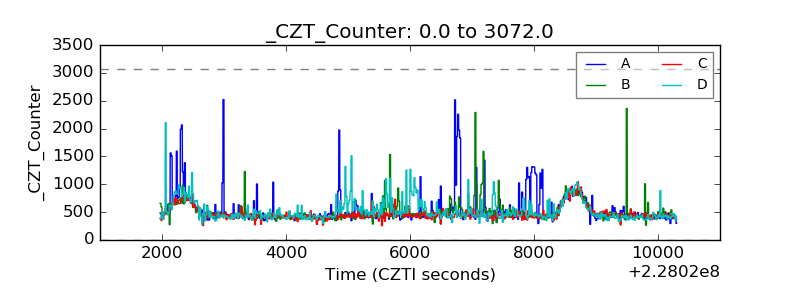 |
| +2.5 Volts monitor |  |
| +5 Volts monitor |  |
| _ROLL_ROT | 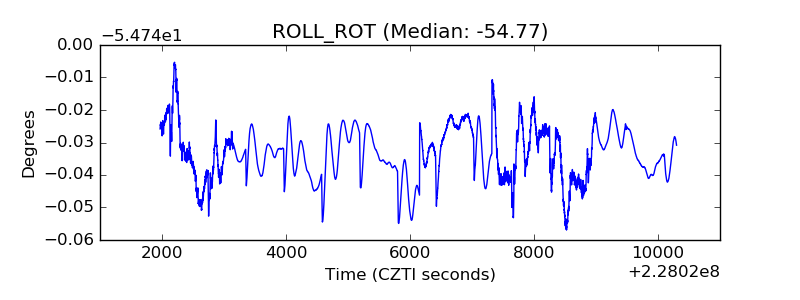 |
| _Roll_DEC | 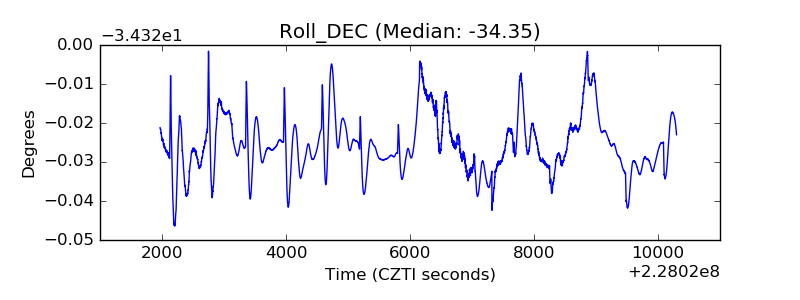 |
| _Roll_RA | 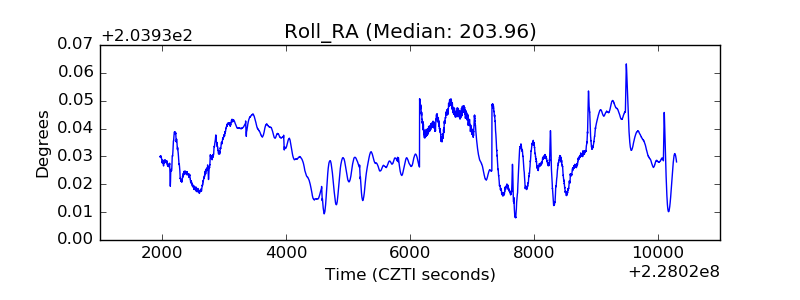 |
| Veto Counter | 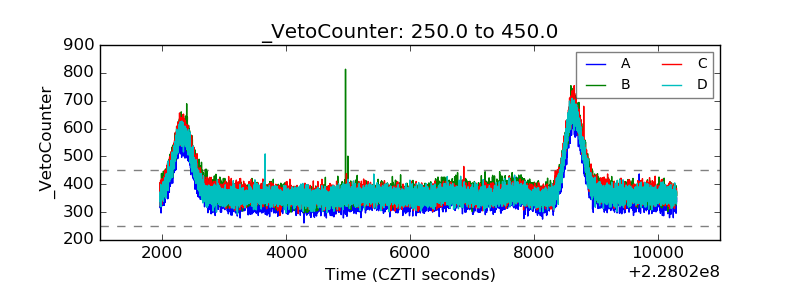 |