| Param | Original file | Final file |
|---|---|---|
| Filename | modeM0/AS1G05_246T02_9000001106_08047cztM0_level2.evt | modeM0/AS1G05_246T02_9000001106_08047cztM0_level2_quad_clean.evt |
| Size (bytes) | 3,483,069,120 | 632,831,040 |
| Size | 3.2 GB | 603.5 MB |
| Events in quadrant A | 25,137,471 | 3,985,125 |
| Events in quadrant B | 25,369,365 | 4,065,440 |
| Events in quadrant C | 23,246,181 | 3,982,653 |
| Events in quadrant D | 28,429,300 | 3,775,938 |
| Mode M0 | |||
|---|---|---|---|
| Quadrant | BADHDUFLAG | Total packets | Discarded packets |
| A | 0 | 108195 | 8 |
| B | 0 | 107816 | 6 |
| C | 0 | 103448 | 6 |
| D | 0 | 119596 | 6 |
| Mode SS | |||
|---|---|---|---|
| Quadrant | BADHDUFLAG | Total packets | Discarded packets |
| A | 0 | 986 | 0 |
| B | 0 | 986 | 0 |
| C | 0 | 986 | 0 |
| D | 0 | 986 | 0 |
| Mode M9 | |||
|---|---|---|---|
| Quadrant | BADHDUFLAG | Total packets | Discarded packets |
| A | 0 | 45 | 0 |
| B | 0 | 45 | 0 |
| C | 0 | 45 | 0 |
| D | 0 | 45 | 0 |
| Quadrant | Total seconds | Saturated seconds | Saturation percentage |
|---|---|---|---|
| A | 48941 | 1277 | 2.609264% |
| B | 48941 | 1369 | 2.797246% |
| C | 48941 | 1011 | 2.065753% |
| D | 48941 | 2520 | 5.149057% |
Noise dominated data is calculated using 1-second bins in cleaned event files. If a bin has >2000 counts, and if more than 50% of those come from <1% of pixels, then it is considered to be noise-dominated and hence unusable.
| Quadrant | # 1 sec bins | Bins with >0 counts | Bins with >2000 counts | High rate bins dominated by noise | Noise dominated (total time) | Noise dominated (detector-on time) | Marked lightcurve |
|---|---|---|---|---|---|---|---|
| A | 66985 | 48949 | 262 | 262 | 0.39% | 0.54% | 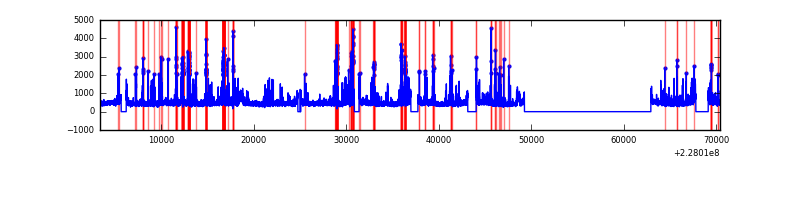 |
| B | 66985 | 48949 | 265 | 265 | 0.40% | 0.54% | 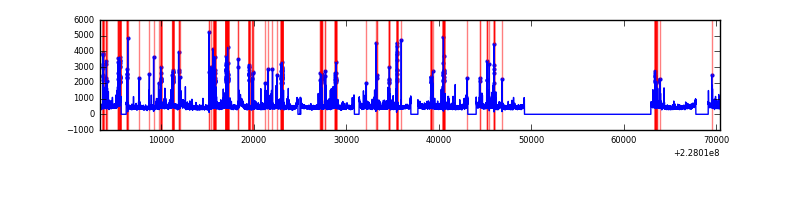 |
| C | 66985 | 48949 | 189 | 189 | 0.28% | 0.39% | 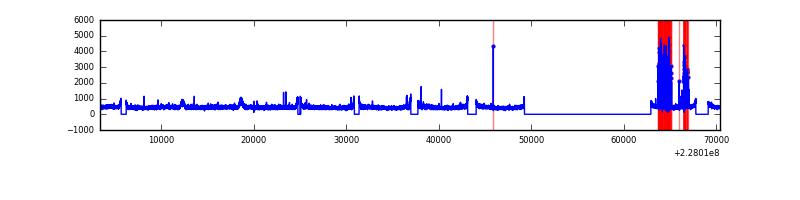 |
| D | 66985 | 48949 | 1563 | 1563 | 2.33% | 3.19% | 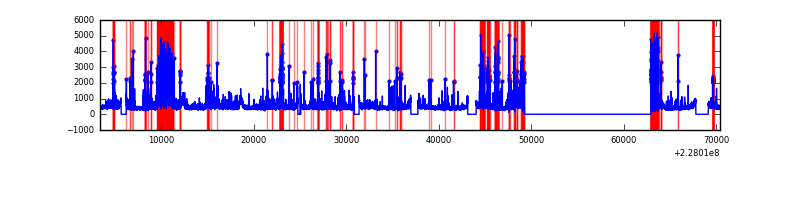 |
Top three noisy pixels from each quadrant. If the there are fewer than three noisy pixels in the level2.evt file, extra rows are filled as -1
| Pixel properties | Quadrant properties | ||||||
|---|---|---|---|---|---|---|---|
| Quadrant | DetID | PixID | Counts | Sigma | Mean | Median | Sigma |
| A | 4 | 2 | 2513954 | 2146.5 | 5757 | 5630 | 1168.6 |
| A | 0 | 128 | 224562 | 187.35 | 5757 | 5630 | 1168.6 |
| A | 15 | 79 | 222096 | 185.24 | 5757 | 5630 | 1168.6 |
| B | 4 | 239 | 1287289 | 1170.37 | 5800 | 5660 | 1095.1 |
| B | 10 | 16 | 354930 | 318.95 | 5800 | 5660 | 1095.1 |
| B | 11 | 51 | 340401 | 305.68 | 5800 | 5660 | 1095.1 |
| C | 4 | 254 | 992458 | 756.4 | 5643 | 5665 | 1304.6 |
| C | 1 | 16 | 211084 | 157.46 | 5643 | 5665 | 1304.6 |
| C | 13 | 61 | 42908 | 28.55 | 5643 | 5665 | 1304.6 |
| D | 13 | 169 | 4642656 | 3260.05 | 5481 | 5348 | 1422.5 |
| D | 1 | 52 | 2036753 | 1428.09 | 5481 | 5348 | 1422.5 |
| D | 12 | 233 | 280661 | 193.55 | 5481 | 5348 | 1422.5 |
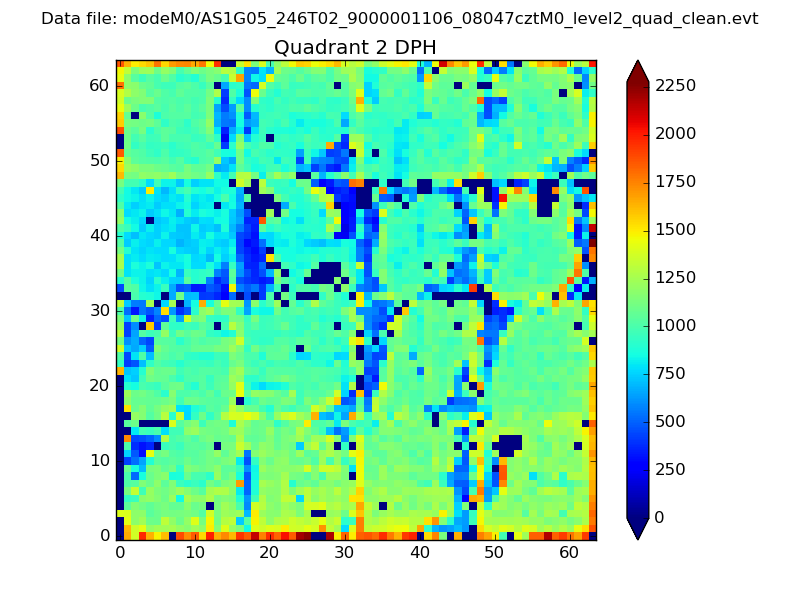
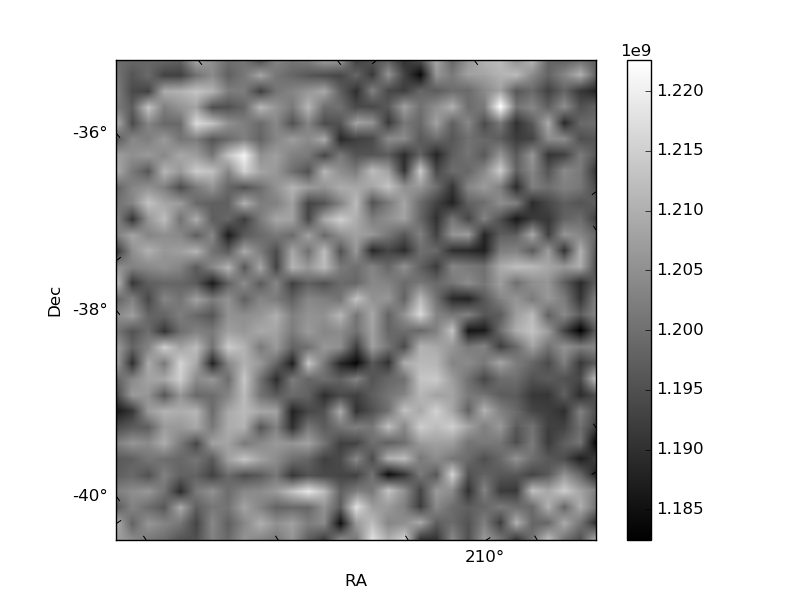
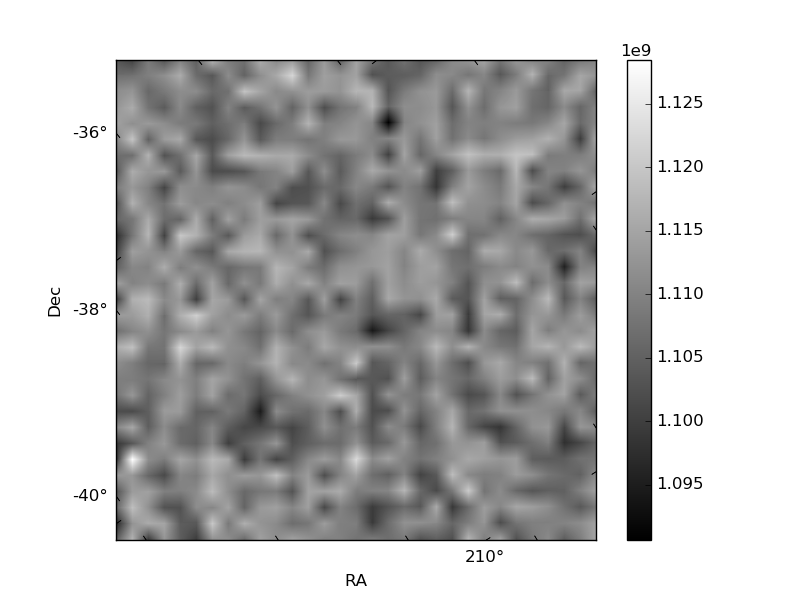
Histogram calculated using DETX and DETY for each event in the final _common_clean file
| Quadrant A | 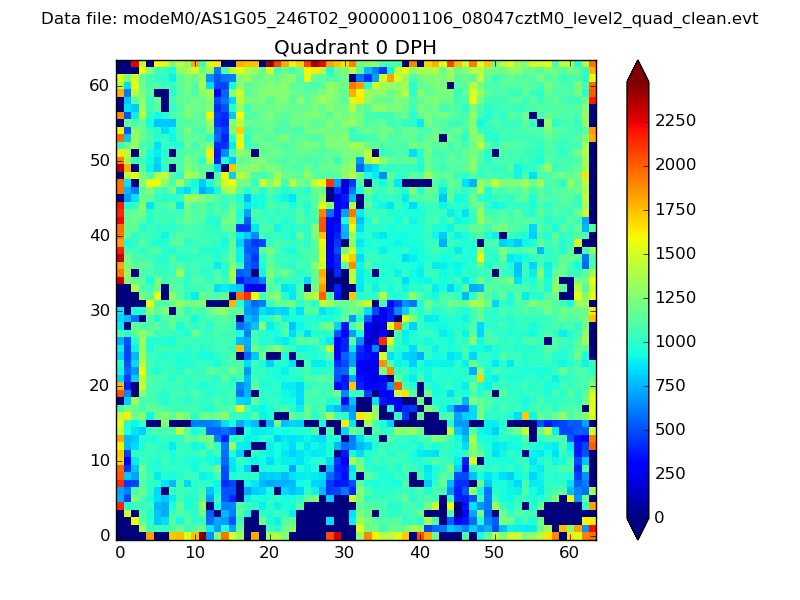 |
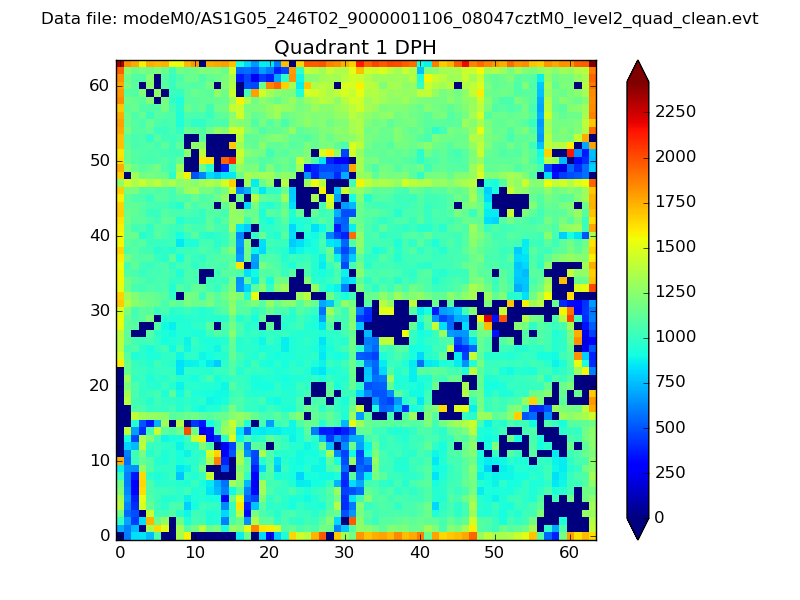 |
Quadrant B |
|---|---|---|---|
| Quadrant D | 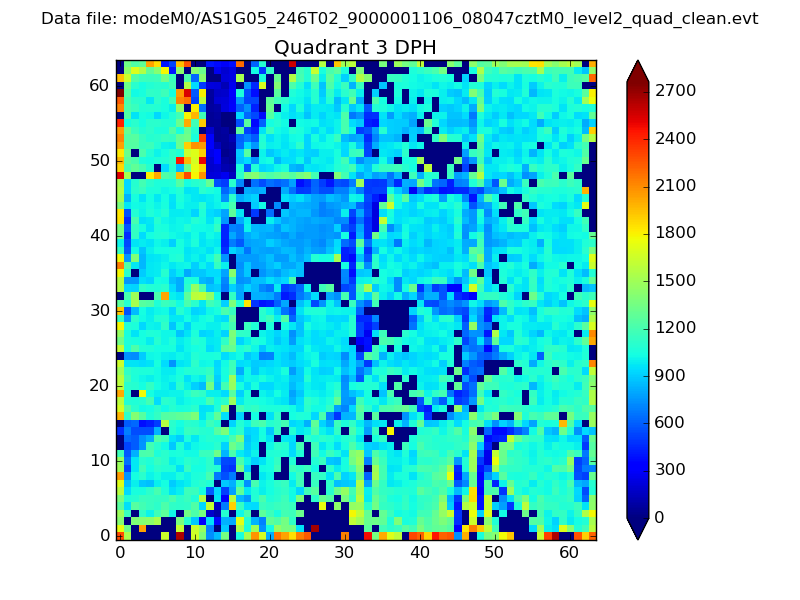 |
 |
Quadrant C |
| Plot type | Count rate plots | Images |
|---|---|---|
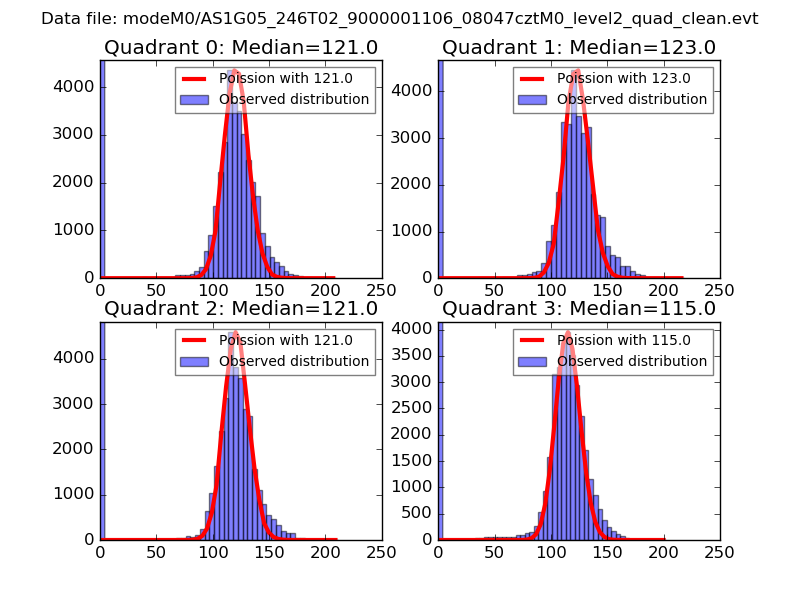
| Comparison with Poisson distribution Blue bars denote a histogram of data divided into 1 sec bins. Red curve is a Poisson curve with rate = median count rate of data. |
 |
 |
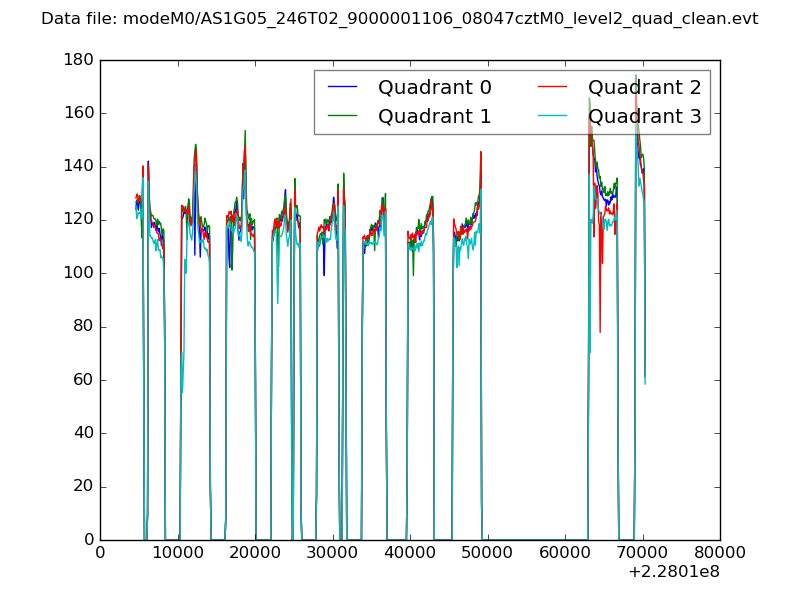
| Quadrant-wise count rates Data is divided into 100 sec bins |
 |
|
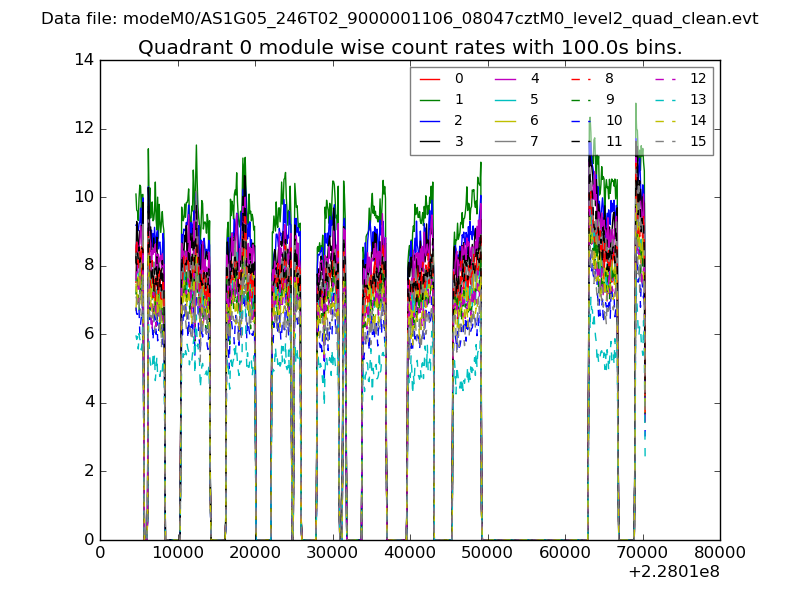
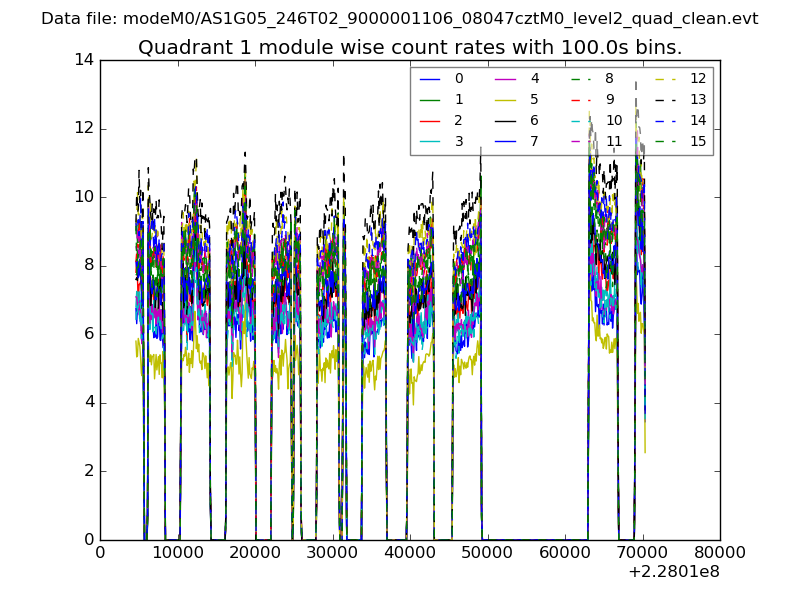
| Module-wise count rates for Quadrant A Data is divided into 100 sec bins |
 |
 |
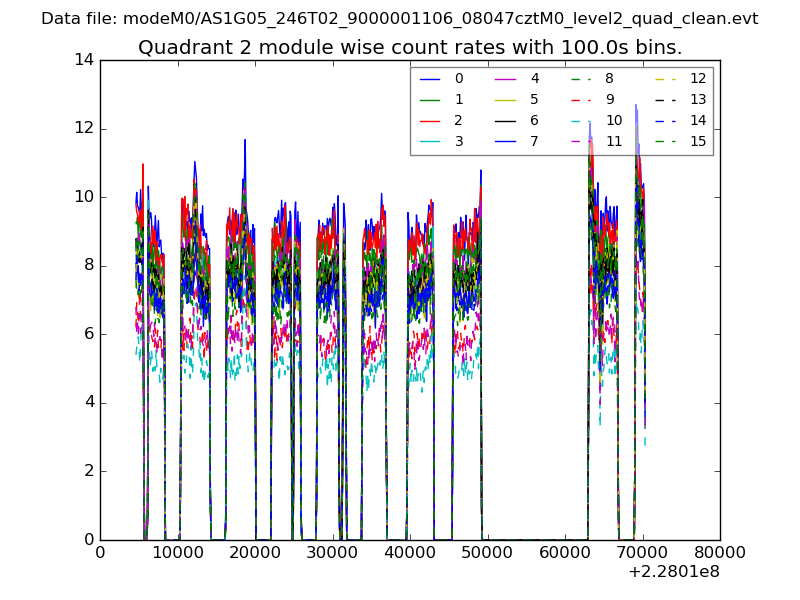
| Module-wise count rates for Quadrant B Data is divided into 100 sec bins |
 |
 |
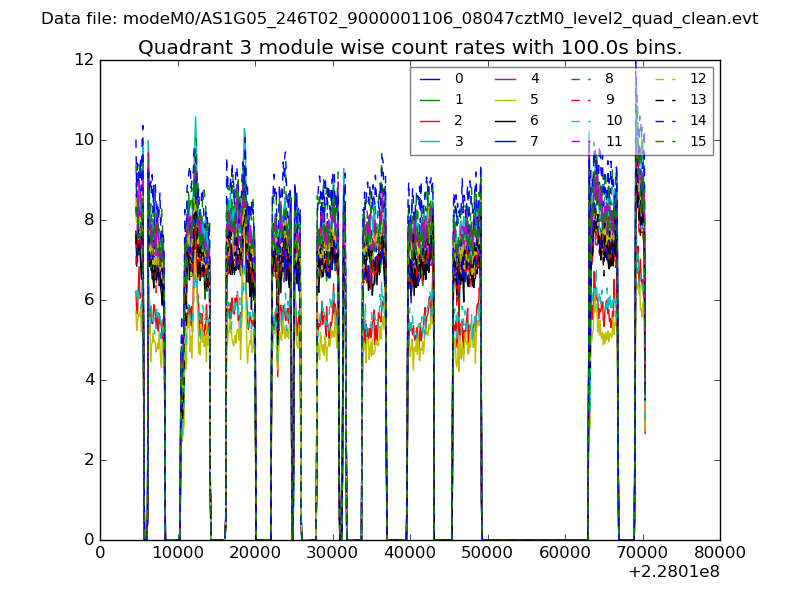
| Module-wise count rates for Quadrant C Data is divided into 100 sec bins |
 |
 |
| Module-wise count rates for Quadrant D Data is divided into 100 sec bins |
 |
 |
| Parameter | Plot |
|---|---|
| CZT HV Monitor |  |
| D_VDD | 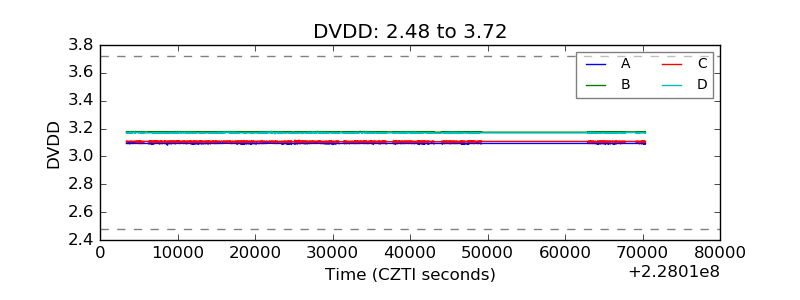 |
| Temperature 1 | 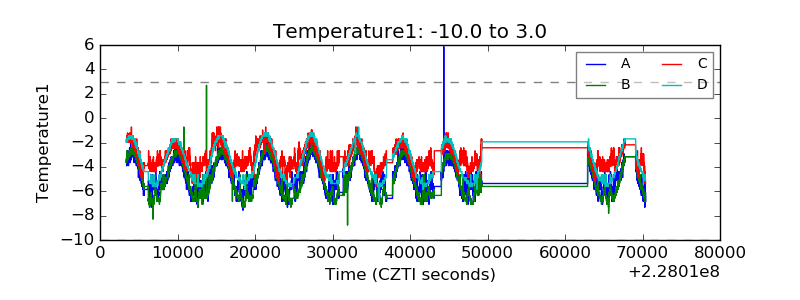 |
| Veto HV Monitor | 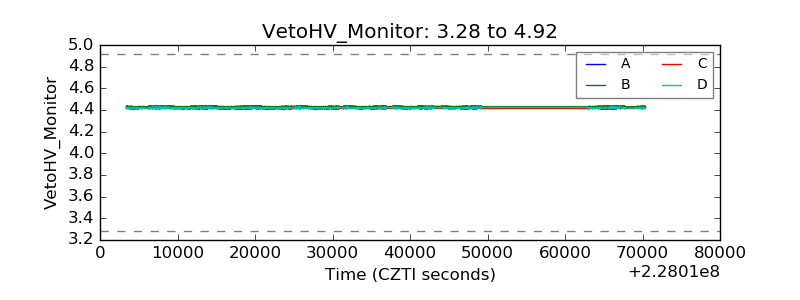 |
| Veto LLD | 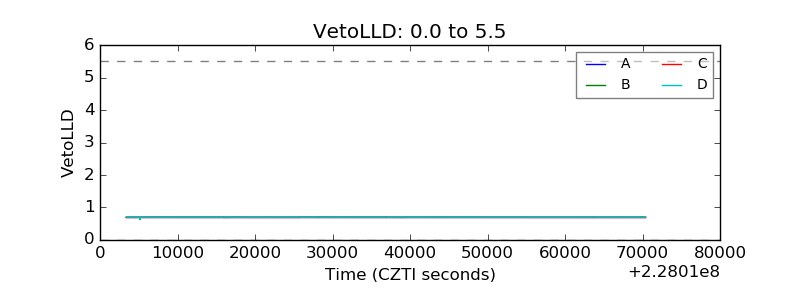 |
| Alpha Counter | 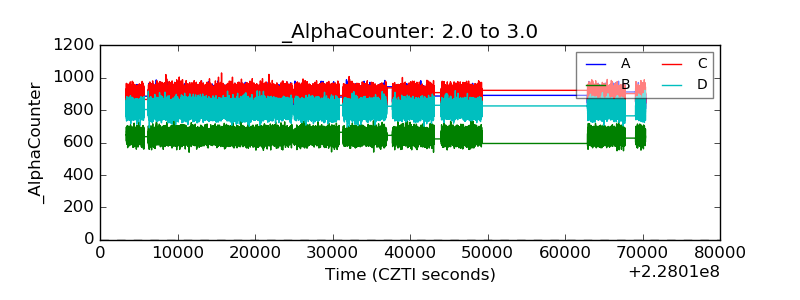 |
| _CPM_Rate | 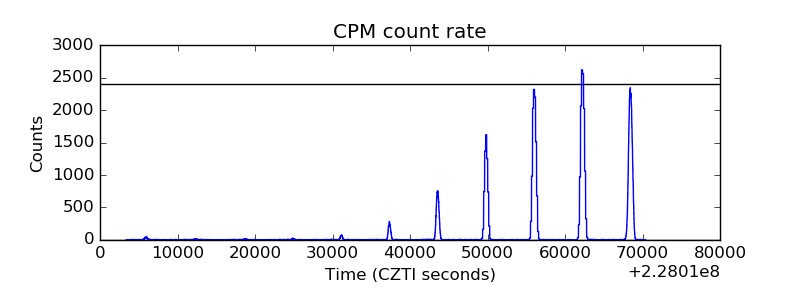 |
| CZT Counter | 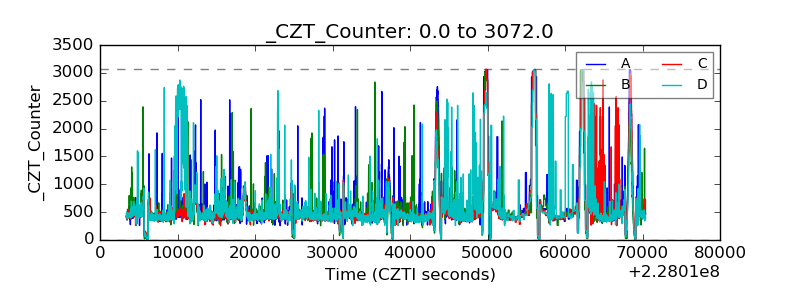 |
| +2.5 Volts monitor |  |
| +5 Volts monitor |  |
| _ROLL_ROT | 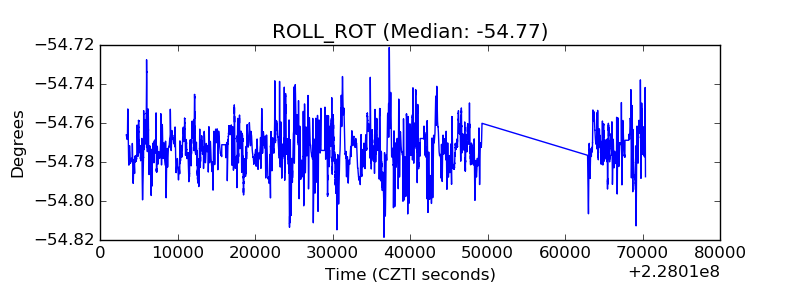 |
| _Roll_DEC | 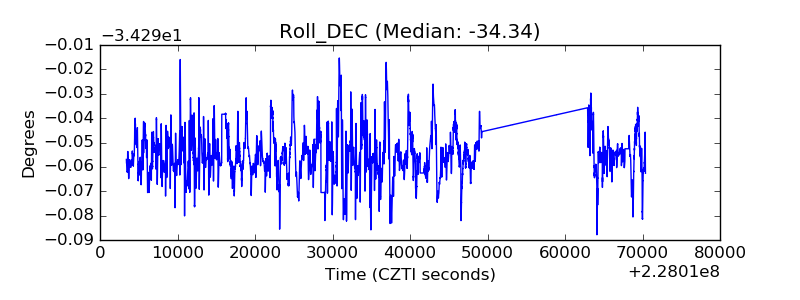 |
| _Roll_RA | 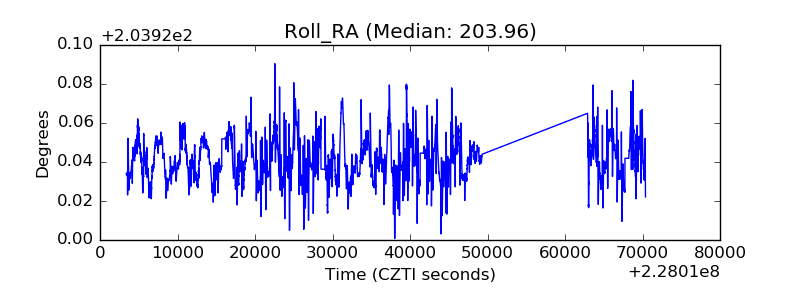 |
| Veto Counter | 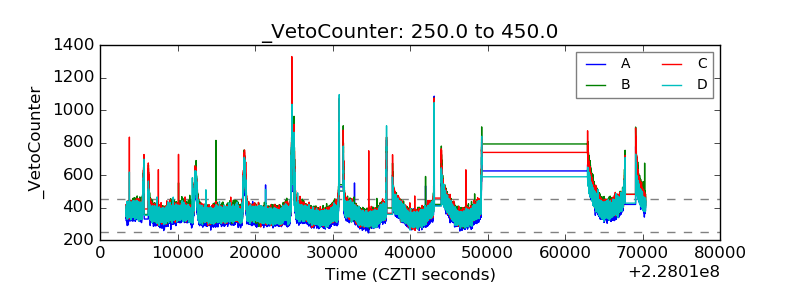 |