| Param | Original file | Final file |
|---|---|---|
| Filename | modeM0/AS1G05_246T02_9000001106_08048cztM0_level2.evt | modeM0/AS1G05_246T02_9000001106_08048cztM0_level2_quad_clean.evt |
| Size (bytes) | 1,523,364,480 | 320,541,120 |
| Size | 1.4 GB | 305.7 MB |
| Events in quadrant A | 11,166,164 | 2,112,749 |
| Events in quadrant B | 10,516,283 | 2,171,130 |
| Events in quadrant C | 10,584,078 | 2,068,997 |
| Events in quadrant D | 12,474,871 | 1,935,400 |
| Mode M0 | |||
|---|---|---|---|
| Quadrant | BADHDUFLAG | Total packets | Discarded packets |
| A | 0 | 47016 | 5 |
| B | 0 | 44852 | 4 |
| C | 0 | 45476 | 4 |
| D | 0 | 51669 | 4 |
| Mode SS | |||
|---|---|---|---|
| Quadrant | BADHDUFLAG | Total packets | Discarded packets |
| A | 0 | 420 | 0 |
| B | 0 | 420 | 0 |
| C | 0 | 420 | 0 |
| D | 0 | 420 | 0 |
| Mode M9 | |||
|---|---|---|---|
| Quadrant | BADHDUFLAG | Total packets | Discarded packets |
| A | 0 | 52 | 0 |
| B | 0 | 52 | 0 |
| C | 0 | 52 | 0 |
| D | 0 | 52 | 0 |
| Quadrant | Total seconds | Saturated seconds | Saturation percentage |
|---|---|---|---|
| A | 20634 | 450 | 2.180867% |
| B | 20634 | 339 | 1.642919% |
| C | 20634 | 397 | 1.924009% |
| D | 20634 | 937 | 4.541049% |
Noise dominated data is calculated using 1-second bins in cleaned event files. If a bin has >2000 counts, and if more than 50% of those come from <1% of pixels, then it is considered to be noise-dominated and hence unusable.
| Quadrant | # 1 sec bins | Bins with >0 counts | Bins with >2000 counts | High rate bins dominated by noise | Noise dominated (total time) | Noise dominated (detector-on time) | Marked lightcurve |
|---|---|---|---|---|---|---|---|
| A | 25779 | 20638 | 125 | 125 | 0.48% | 0.61% | 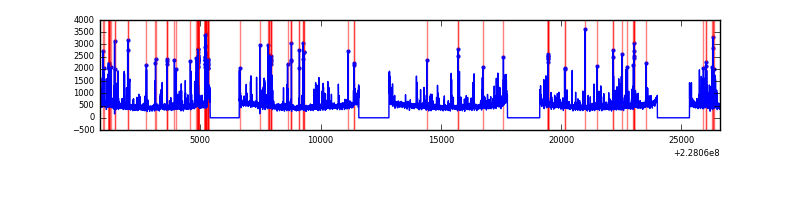 |
| B | 25779 | 20638 | 51 | 51 | 0.20% | 0.25% | 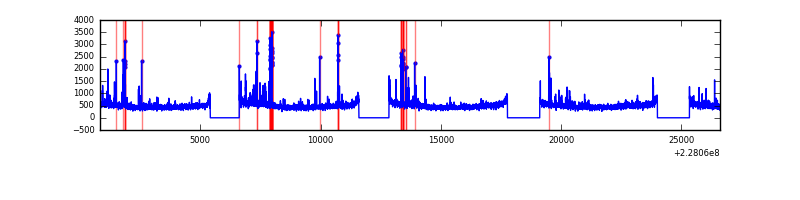 |
| C | 25779 | 20638 | 188 | 188 | 0.73% | 0.91% | 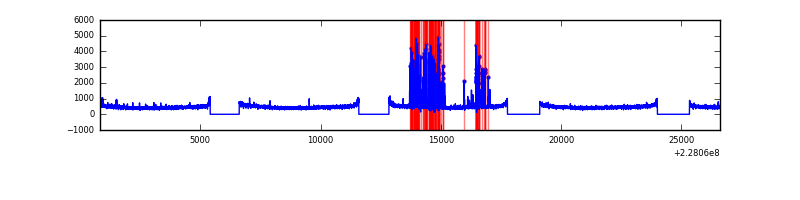 |
| D | 25779 | 20638 | 721 | 721 | 2.80% | 3.49% | 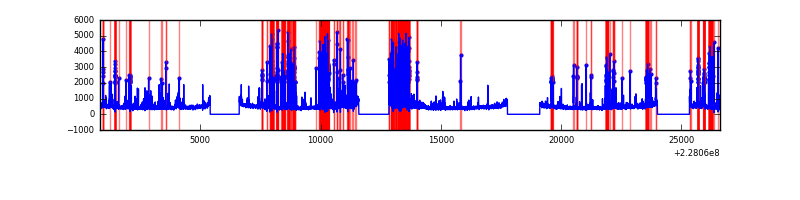 |
Top three noisy pixels from each quadrant. If the there are fewer than three noisy pixels in the level2.evt file, extra rows are filled as -1
| Pixel properties | Quadrant properties | ||||||
|---|---|---|---|---|---|---|---|
| Quadrant | DetID | PixID | Counts | Sigma | Mean | Median | Sigma |
| A | 4 | 2 | 1057961 | 2124.59 | 2488 | 2446 | 496.8 |
| A | 15 | 79 | 488182 | 977.71 | 2488 | 2446 | 496.8 |
| A | 0 | 128 | 53778 | 103.32 | 2488 | 2446 | 496.8 |
| B | 4 | 239 | 376802 | 792.29 | 2537 | 2477 | 472.5 |
| B | 4 | 81 | 119424 | 247.53 | 2537 | 2477 | 472.5 |
| B | 5 | 250 | 94104 | 193.94 | 2537 | 2477 | 472.5 |
| C | 4 | 254 | 987145 | 1778.11 | 2421 | 2437 | 553.8 |
| C | 1 | 16 | 143007 | 253.83 | 2421 | 2437 | 553.8 |
| C | 13 | 61 | 18438 | 28.89 | 2421 | 2437 | 553.8 |
| D | 1 | 52 | 2793625 | 4550.03 | 2341 | 2285 | 613.5 |
| D | 2 | 136 | 223851 | 361.16 | 2341 | 2285 | 613.5 |
| D | 13 | 169 | 206756 | 333.3 | 2341 | 2285 | 613.5 |
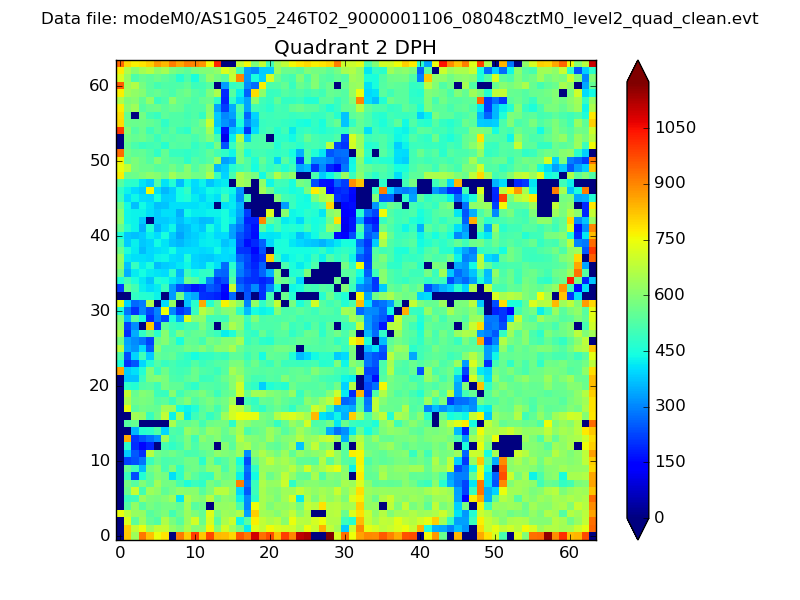
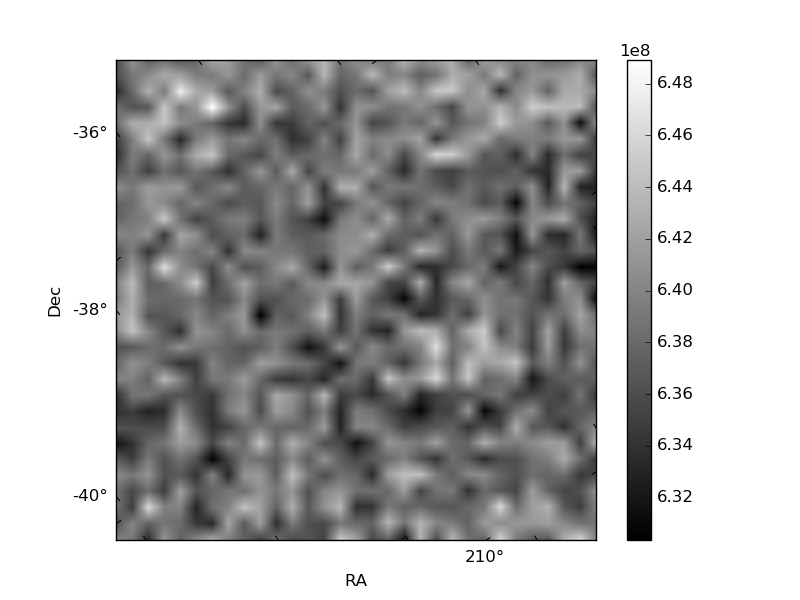
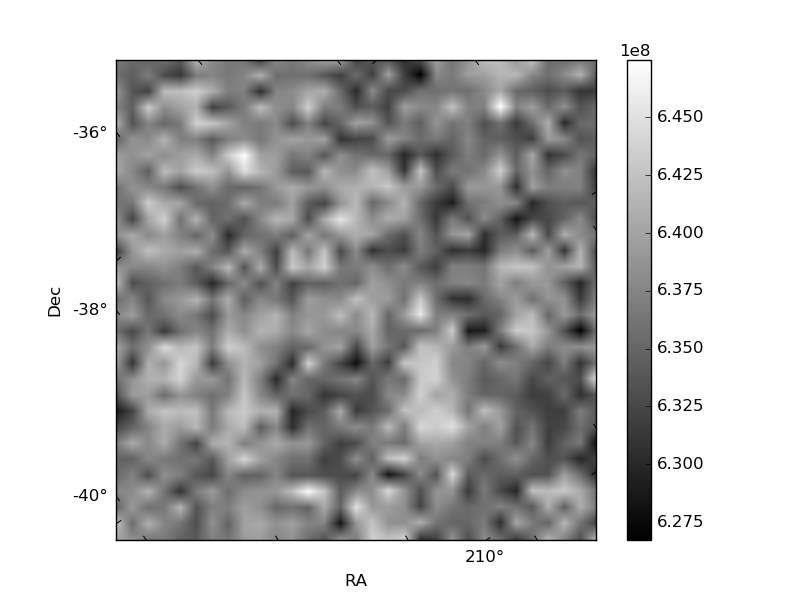
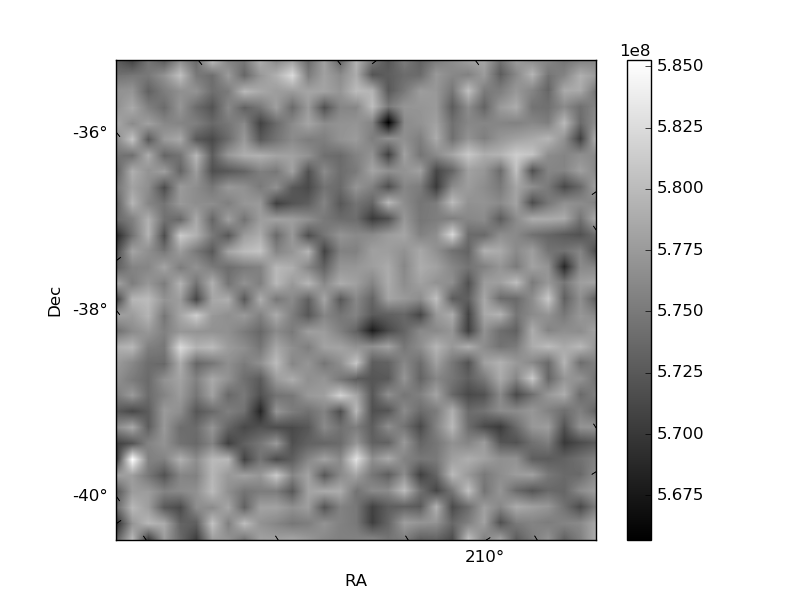
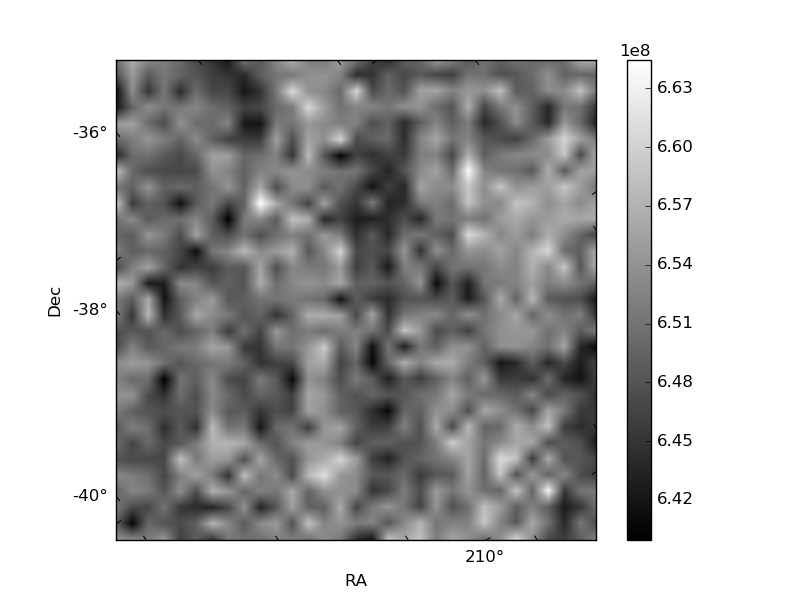
Histogram calculated using DETX and DETY for each event in the final _common_clean file
| Quadrant A | 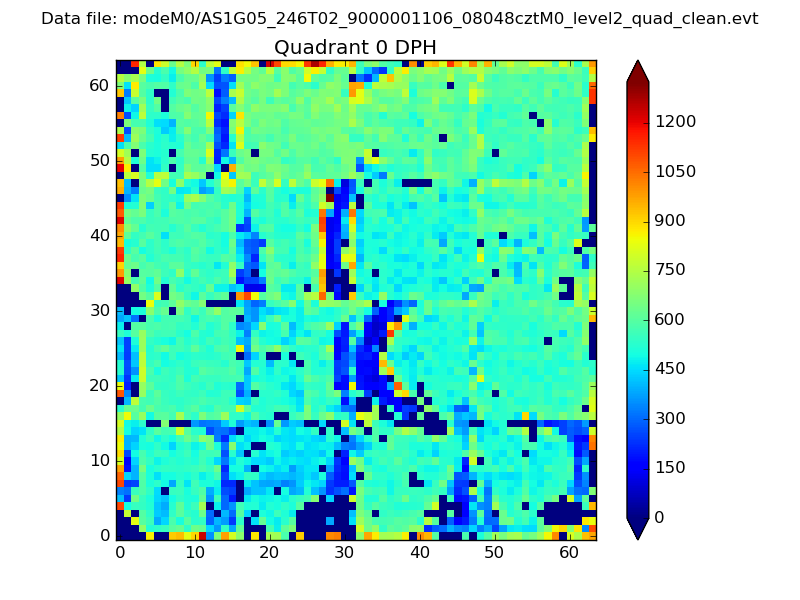 |
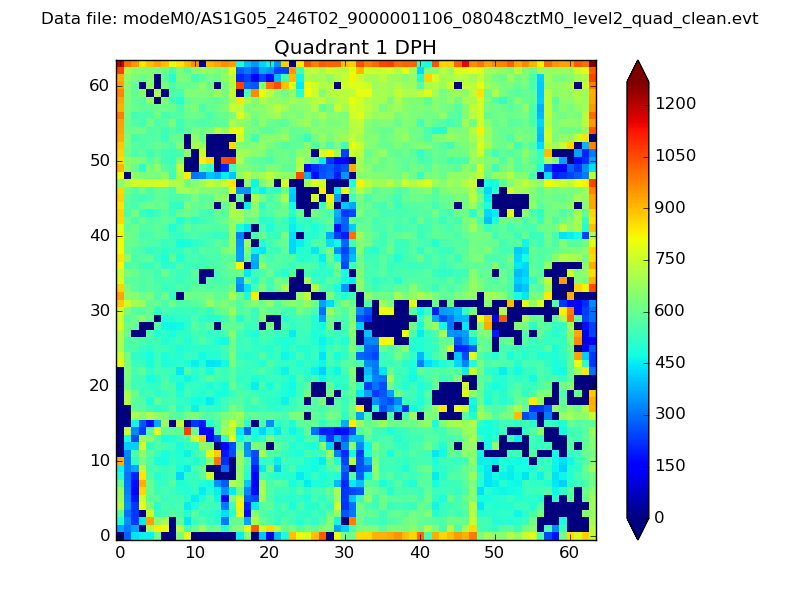 |
Quadrant B |
|---|---|---|---|
| Quadrant D | 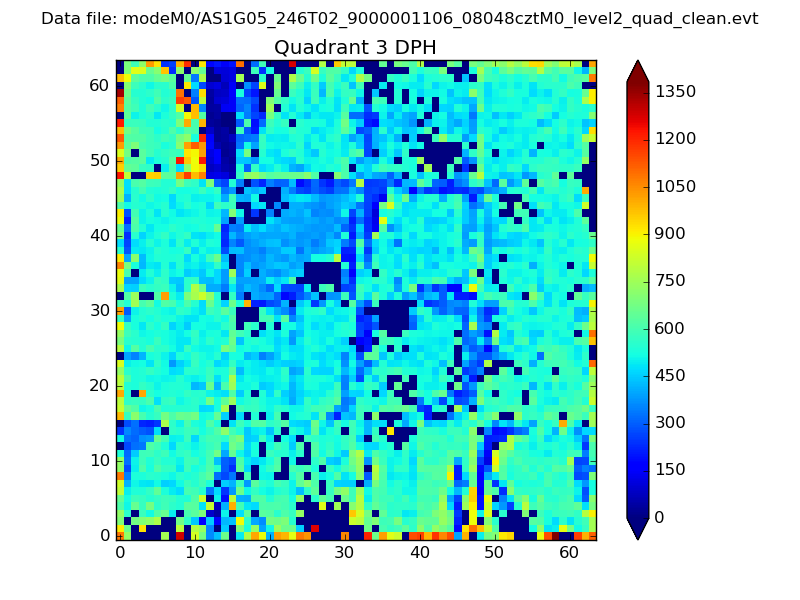 |
 |
Quadrant C |
| Plot type | Count rate plots | Images |
|---|---|---|
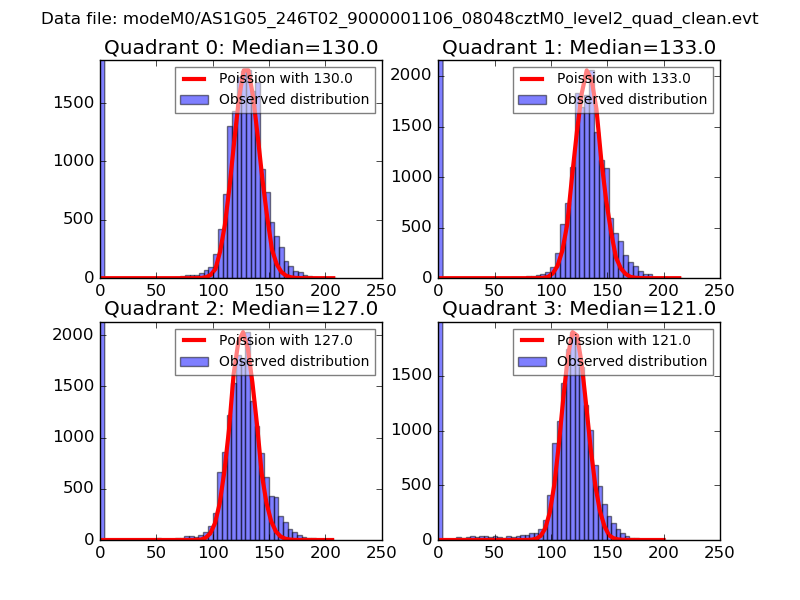
| Comparison with Poisson distribution Blue bars denote a histogram of data divided into 1 sec bins. Red curve is a Poisson curve with rate = median count rate of data. |
 |
 |
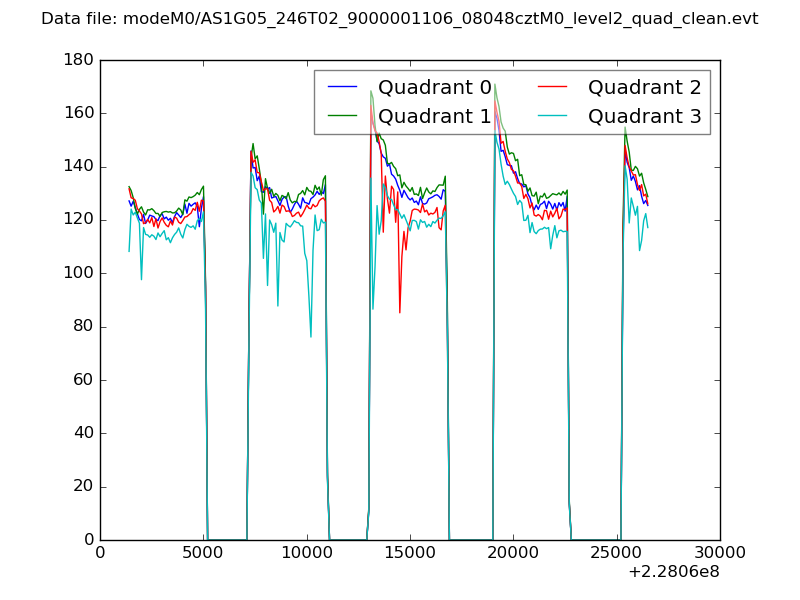
| Quadrant-wise count rates Data is divided into 100 sec bins |
 |
|
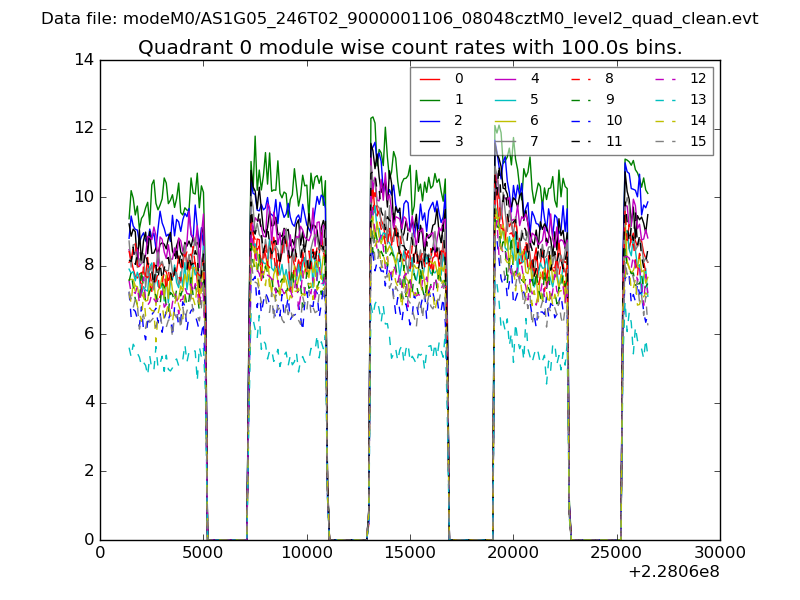
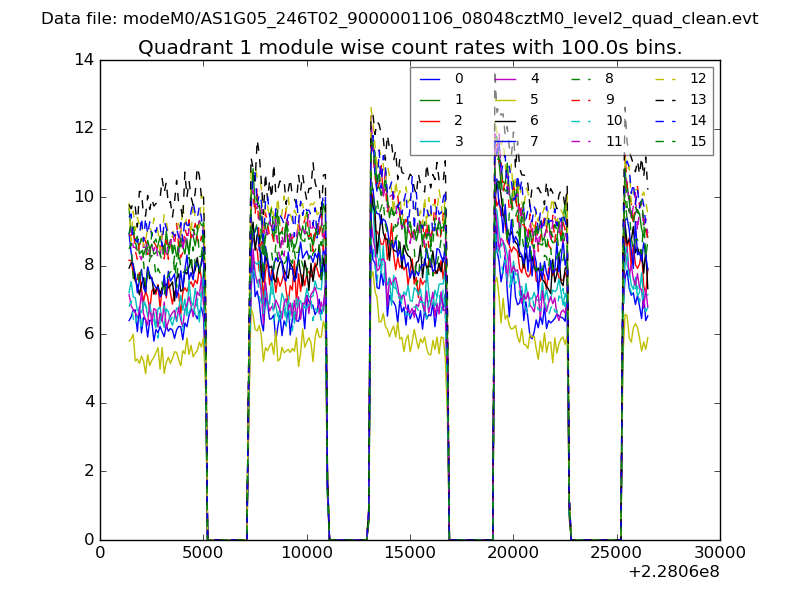
| Module-wise count rates for Quadrant A Data is divided into 100 sec bins |
 |
 |
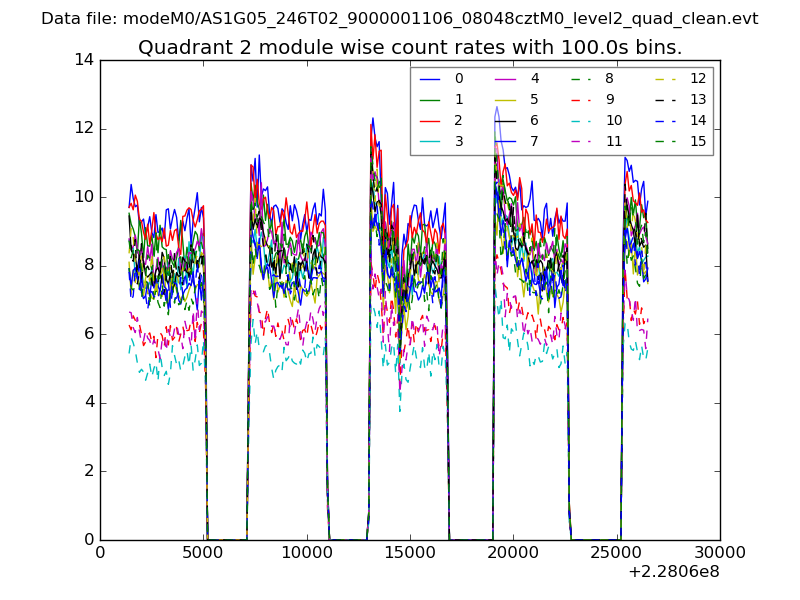
| Module-wise count rates for Quadrant B Data is divided into 100 sec bins |
 |
 |
| Module-wise count rates for Quadrant C Data is divided into 100 sec bins |
 |
 |
| Module-wise count rates for Quadrant D Data is divided into 100 sec bins |
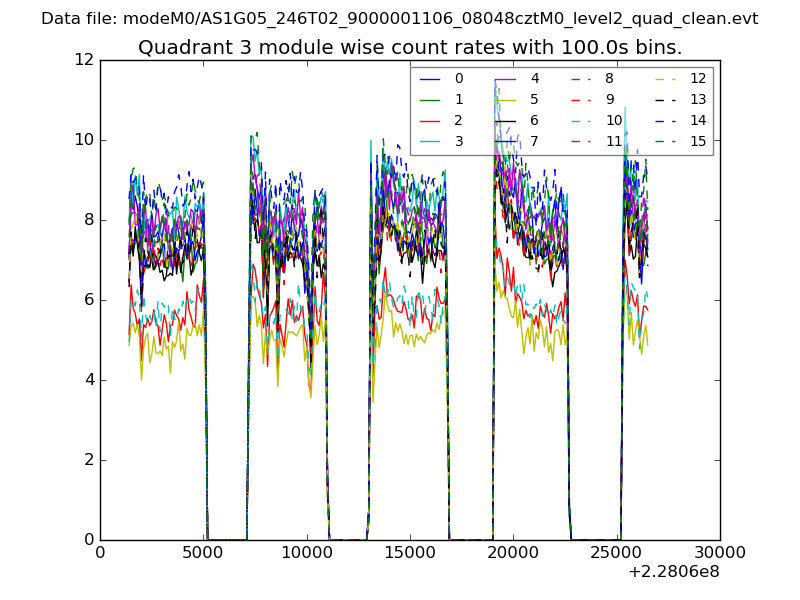 |
 |
| Parameter | Plot |
|---|---|
| CZT HV Monitor | 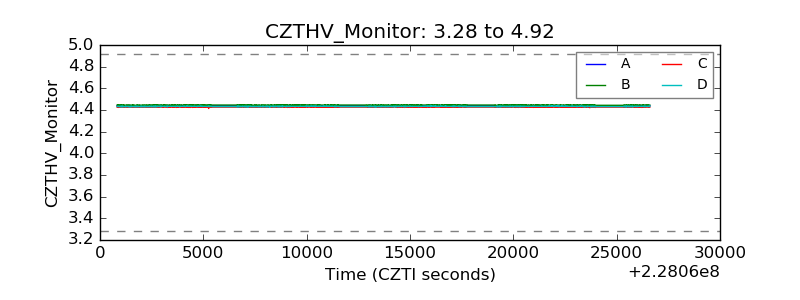 |
| D_VDD | 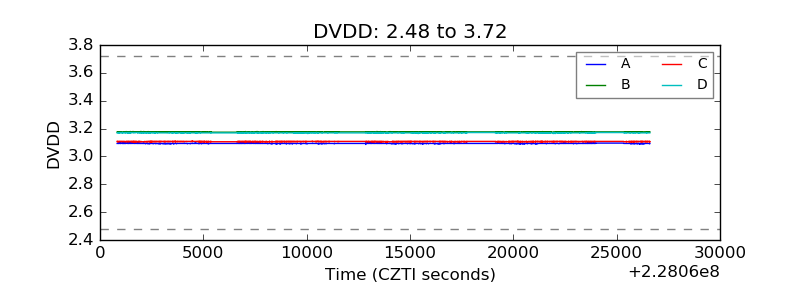 |
| Temperature 1 | 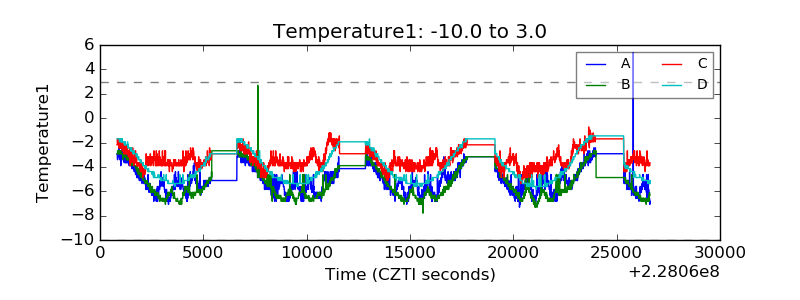 |
| Veto HV Monitor | 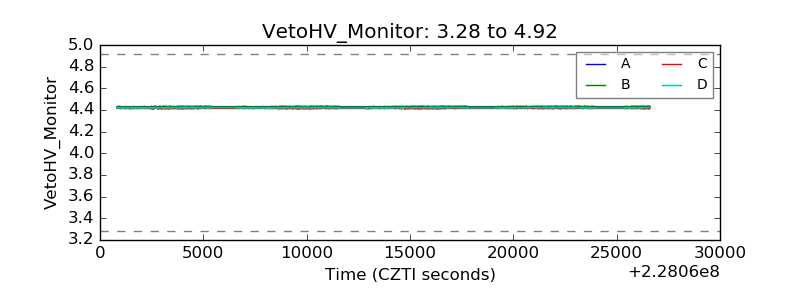 |
| Veto LLD | 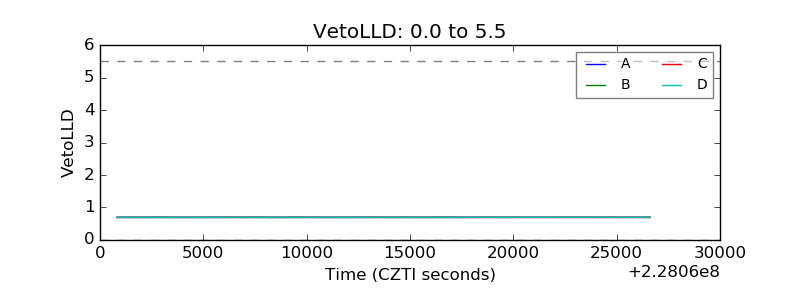 |
| Alpha Counter | 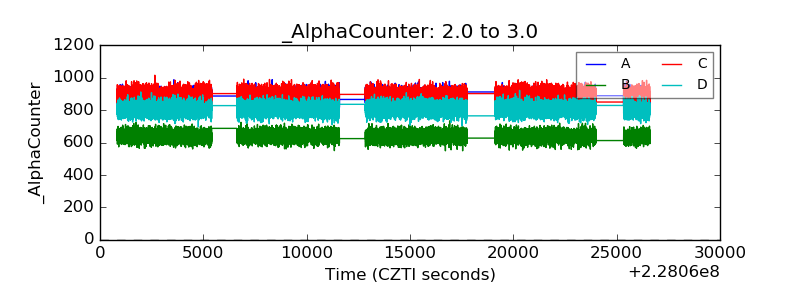 |
| _CPM_Rate | 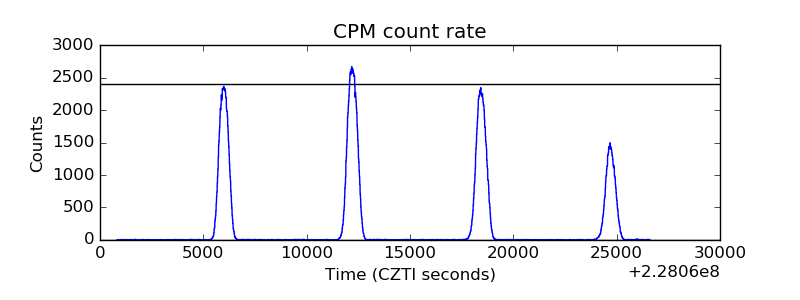 |
| CZT Counter | 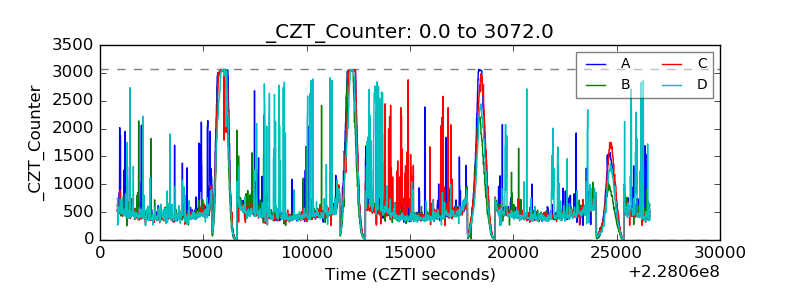 |
| +2.5 Volts monitor |  |
| +5 Volts monitor |  |
| _ROLL_ROT | 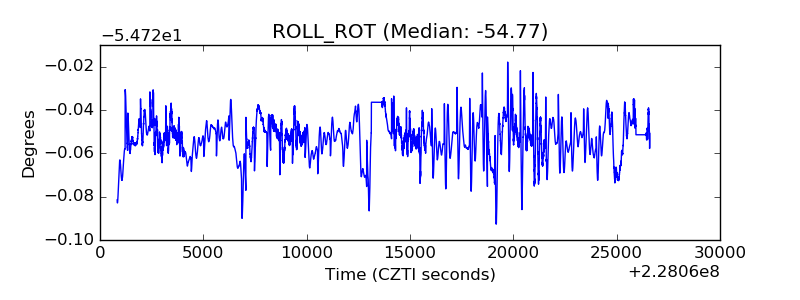 |
| _Roll_DEC | 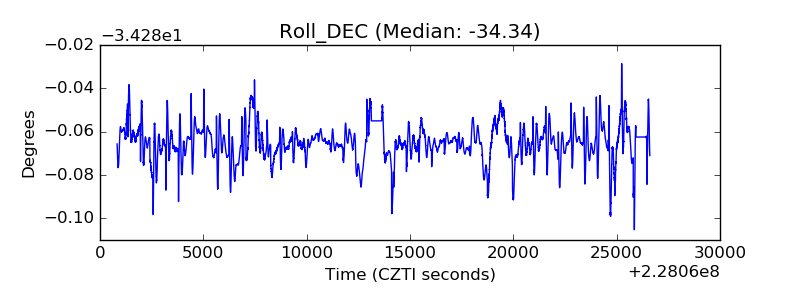 |
| _Roll_RA | 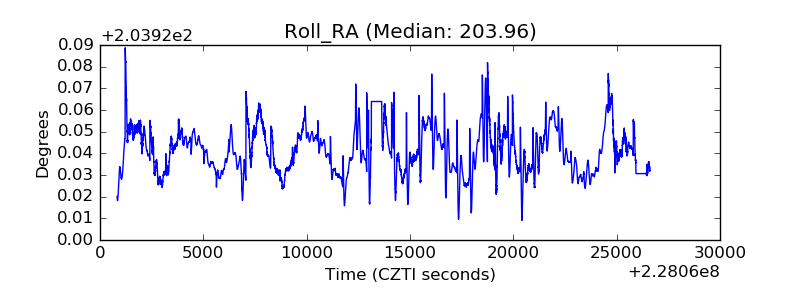 |
| Veto Counter | 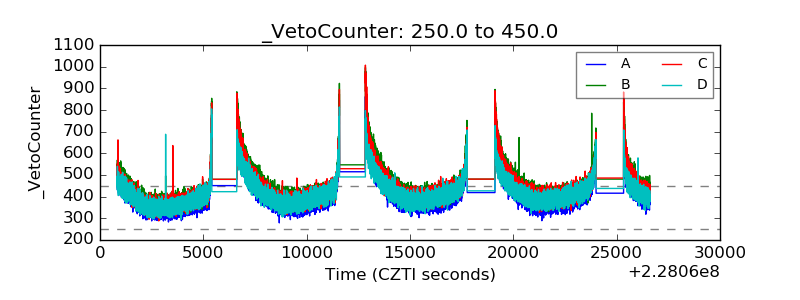 |