| Param | Original file | Final file |
|---|---|---|
| Filename | modeM0/AS1G05_246T02_9000001106_08050cztM0_level2.evt | modeM0/AS1G05_246T02_9000001106_08050cztM0_level2_quad_clean.evt |
| Size (bytes) | 1,805,970,240 | 382,832,640 |
| Size | 1.7 GB | 365.1 MB |
| Events in quadrant A | 13,118,601 | 2,524,102 |
| Events in quadrant B | 12,453,686 | 2,589,020 |
| Events in quadrant C | 12,332,338 | 2,476,521 |
| Events in quadrant D | 15,133,290 | 2,319,284 |
| Mode M0 | |||
|---|---|---|---|
| Quadrant | BADHDUFLAG | Total packets | Discarded packets |
| A | 0 | 55634 | 5 |
| B | 0 | 53122 | 5 |
| C | 0 | 53587 | 5 |
| D | 0 | 62467 | 5 |
| Mode SS | |||
|---|---|---|---|
| Quadrant | BADHDUFLAG | Total packets | Discarded packets |
| A | 0 | 500 | 0 |
| B | 0 | 500 | 0 |
| C | 0 | 500 | 0 |
| D | 0 | 500 | 0 |
| Mode M9 | |||
|---|---|---|---|
| Quadrant | BADHDUFLAG | Total packets | Discarded packets |
| A | 0 | 63 | 0 |
| B | 0 | 63 | 0 |
| C | 0 | 63 | 0 |
| D | 0 | 63 | 0 |
| Quadrant | Total seconds | Saturated seconds | Saturation percentage |
|---|---|---|---|
| A | 24526 | 495 | 2.018266% |
| B | 24526 | 396 | 1.614613% |
| C | 24526 | 429 | 1.749164% |
| D | 24526 | 1204 | 4.909076% |
Noise dominated data is calculated using 1-second bins in cleaned event files. If a bin has >2000 counts, and if more than 50% of those come from <1% of pixels, then it is considered to be noise-dominated and hence unusable.
| Quadrant | # 1 sec bins | Bins with >0 counts | Bins with >2000 counts | High rate bins dominated by noise | Noise dominated (total time) | Noise dominated (detector-on time) | Marked lightcurve |
|---|---|---|---|---|---|---|---|
| A | 30761 | 24531 | 130 | 130 | 0.42% | 0.53% | 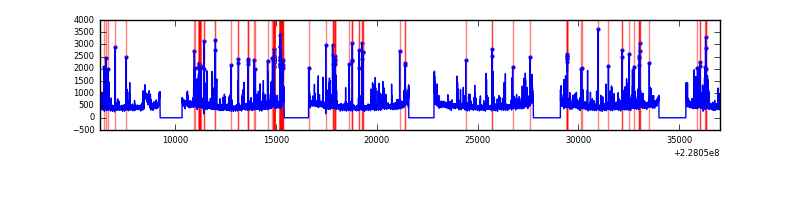 |
| B | 30761 | 24531 | 57 | 57 | 0.19% | 0.23% | 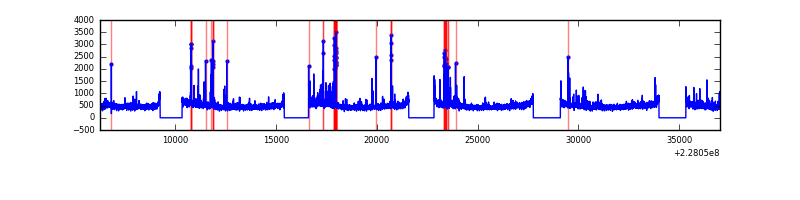 |
| C | 30761 | 24531 | 188 | 188 | 0.61% | 0.77% | 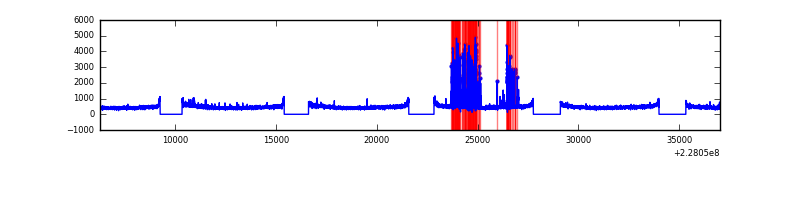 |
| D | 30761 | 24531 | 888 | 888 | 2.89% | 3.62% | 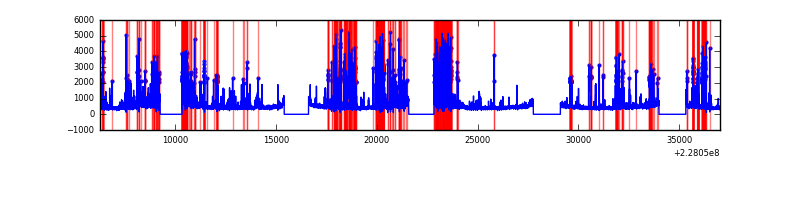 |
Top three noisy pixels from each quadrant. If the there are fewer than three noisy pixels in the level2.evt file, extra rows are filled as -1
| Pixel properties | Quadrant properties | ||||||
|---|---|---|---|---|---|---|---|
| Quadrant | DetID | PixID | Counts | Sigma | Mean | Median | Sigma |
| A | 4 | 2 | 1114476 | 1896.64 | 2938 | 2887 | 586.1 |
| A | 15 | 79 | 488798 | 829.08 | 2938 | 2887 | 586.1 |
| A | 0 | 128 | 220660 | 371.57 | 2938 | 2887 | 586.1 |
| B | 4 | 239 | 401571 | 714.82 | 2992 | 2924 | 557.7 |
| B | 5 | 255 | 143181 | 251.5 | 2992 | 2924 | 557.7 |
| B | 4 | 81 | 141078 | 247.72 | 2992 | 2924 | 557.7 |
| C | 4 | 254 | 987881 | 1501.92 | 2863 | 2882 | 655.8 |
| C | 1 | 16 | 170157 | 255.06 | 2863 | 2882 | 655.8 |
| C | 13 | 61 | 21737 | 28.75 | 2863 | 2882 | 655.8 |
| D | 1 | 52 | 3565039 | 4986.96 | 2756 | 2692 | 714.3 |
| D | 13 | 169 | 428102 | 595.53 | 2756 | 2692 | 714.3 |
| D | 2 | 136 | 226885 | 313.85 | 2756 | 2692 | 714.3 |
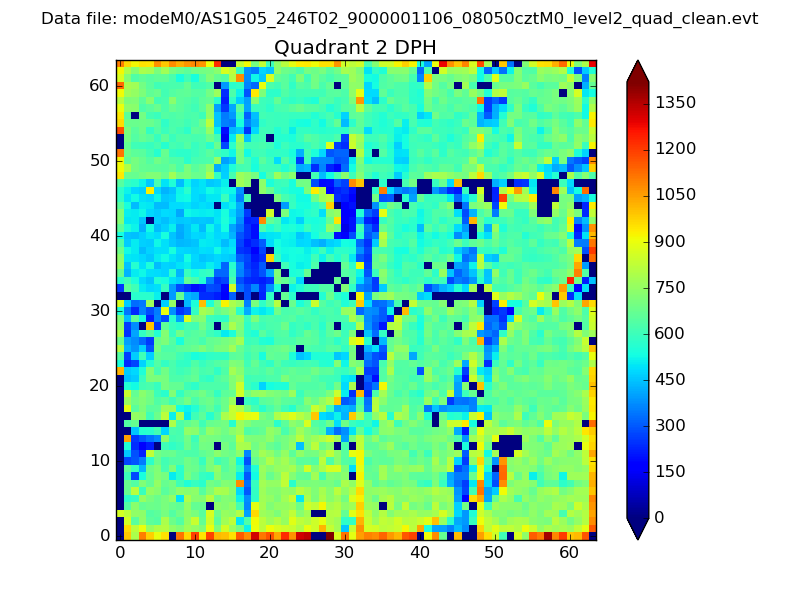
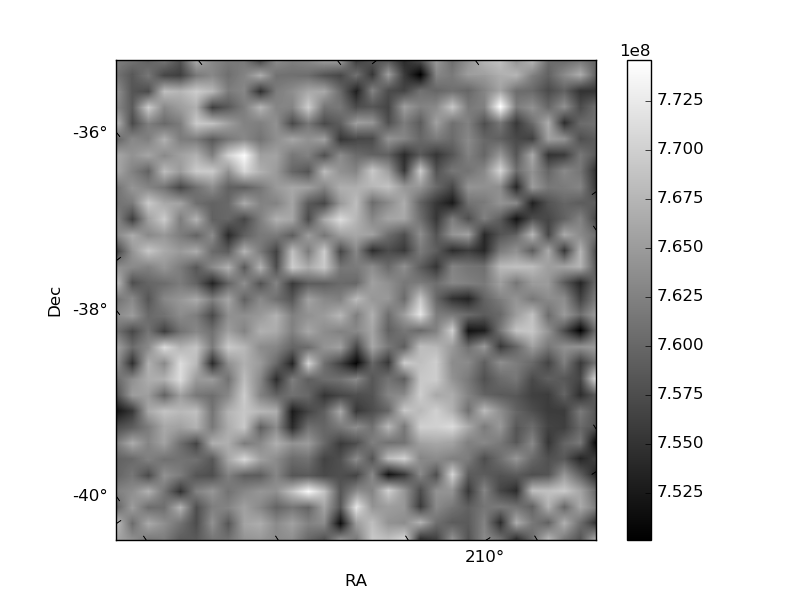
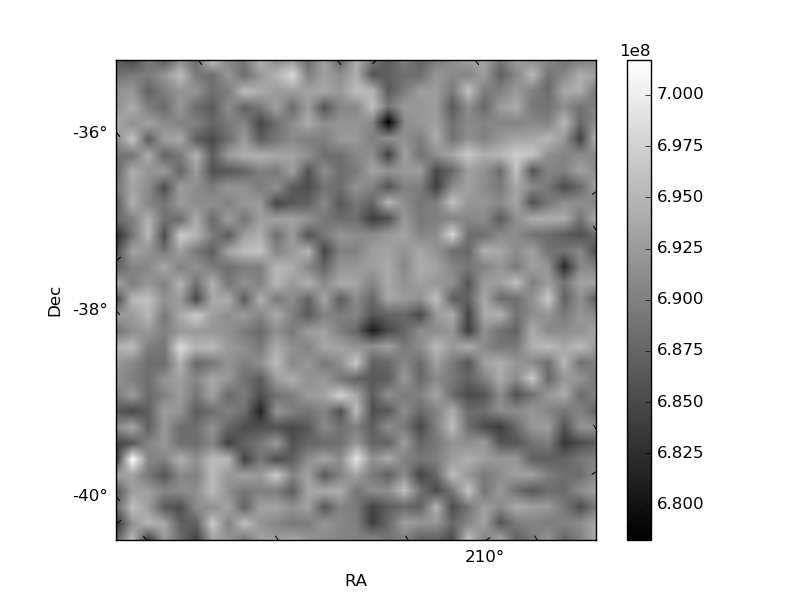
Histogram calculated using DETX and DETY for each event in the final _common_clean file
| Quadrant A | 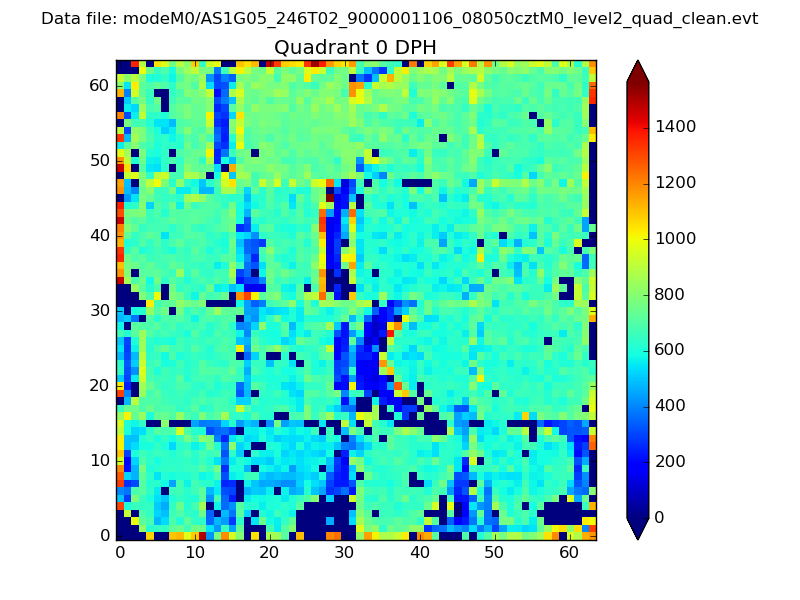 |
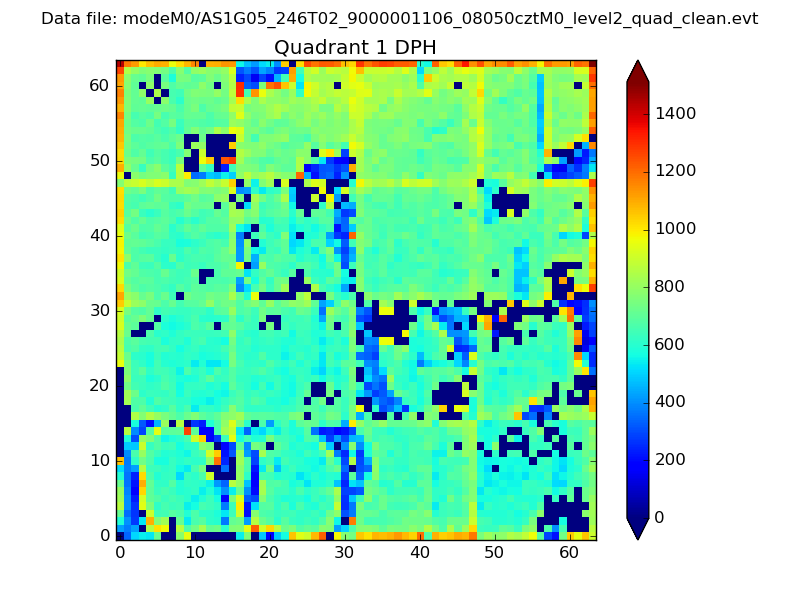 |
Quadrant B |
|---|---|---|---|
| Quadrant D | 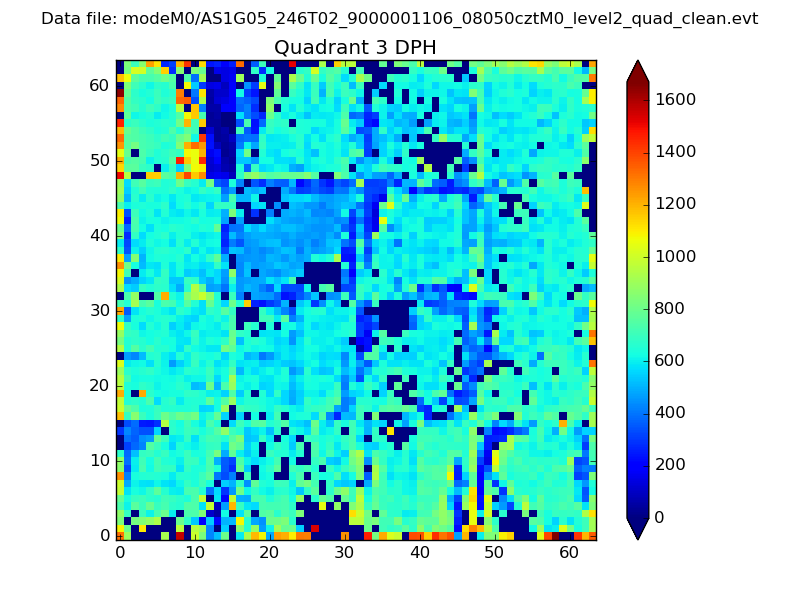 |
 |
Quadrant C |
| Plot type | Count rate plots | Images |
|---|---|---|
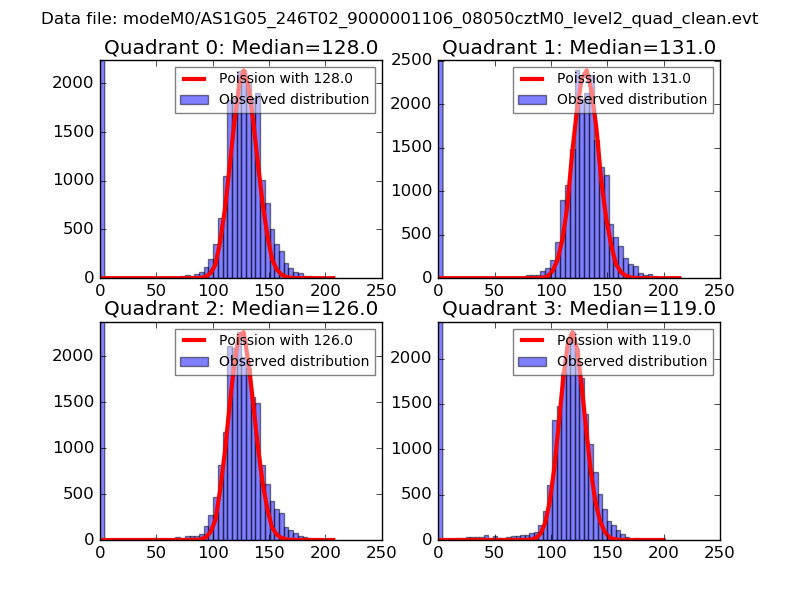
| Comparison with Poisson distribution Blue bars denote a histogram of data divided into 1 sec bins. Red curve is a Poisson curve with rate = median count rate of data. |
 |
 |
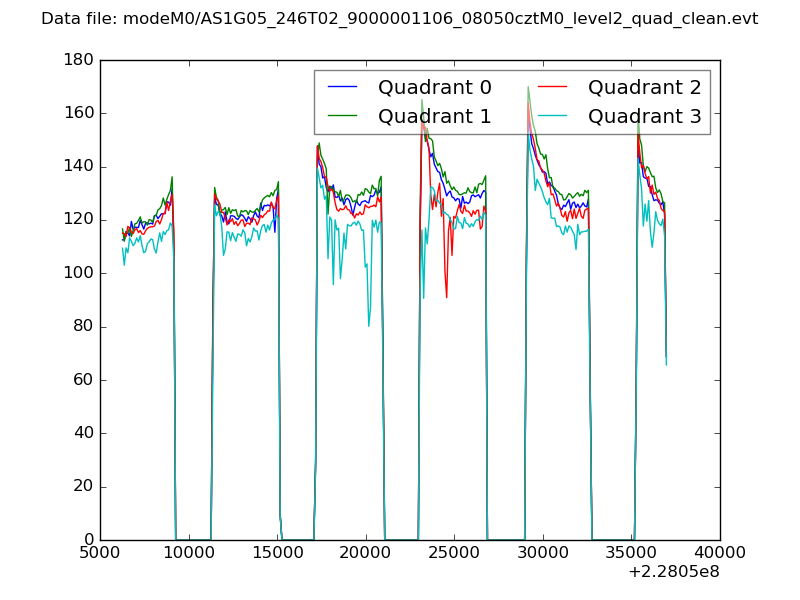
| Quadrant-wise count rates Data is divided into 100 sec bins |
 |
|
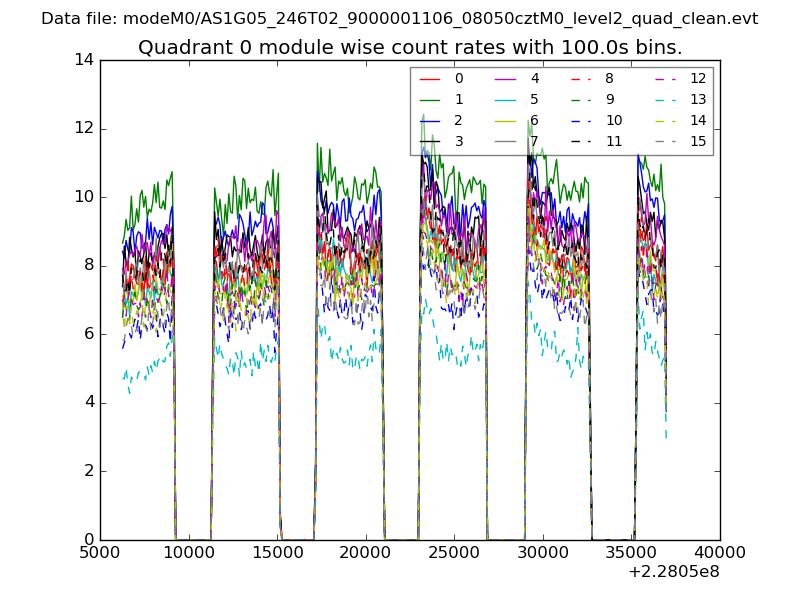
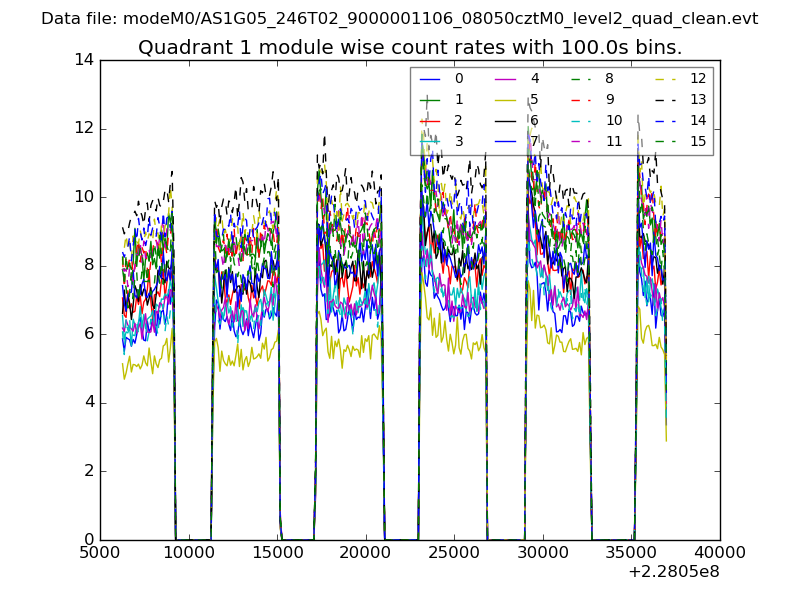
| Module-wise count rates for Quadrant A Data is divided into 100 sec bins |
 |
 |
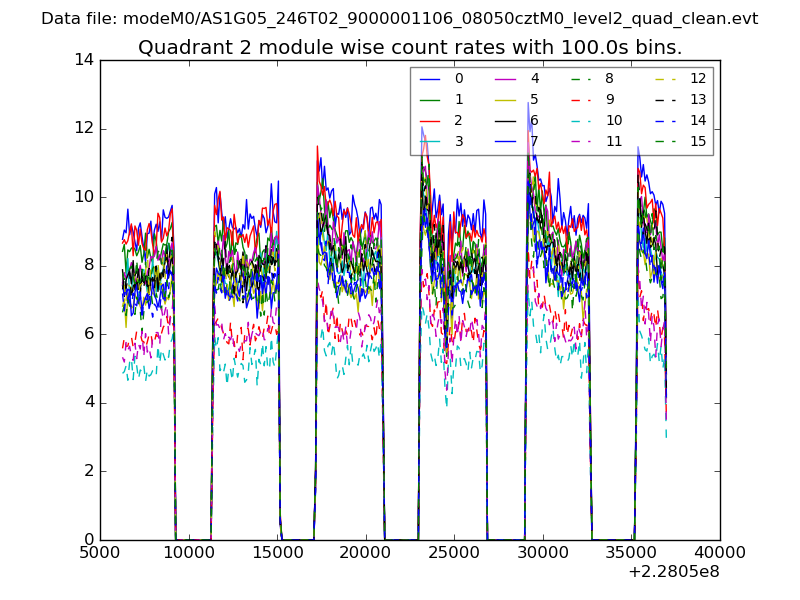
| Module-wise count rates for Quadrant B Data is divided into 100 sec bins |
 |
 |
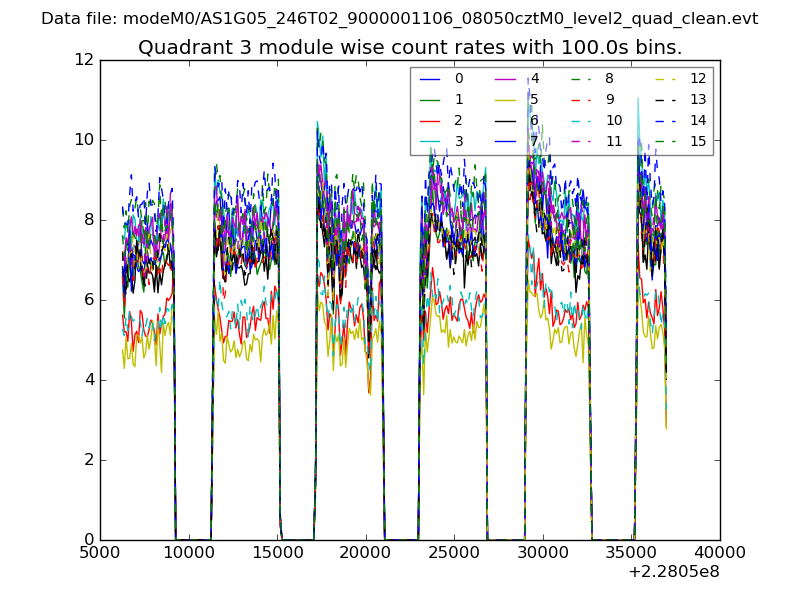
| Module-wise count rates for Quadrant C Data is divided into 100 sec bins |
 |
 |
| Module-wise count rates for Quadrant D Data is divided into 100 sec bins |
 |
 |
| Parameter | Plot |
|---|---|
| CZT HV Monitor | 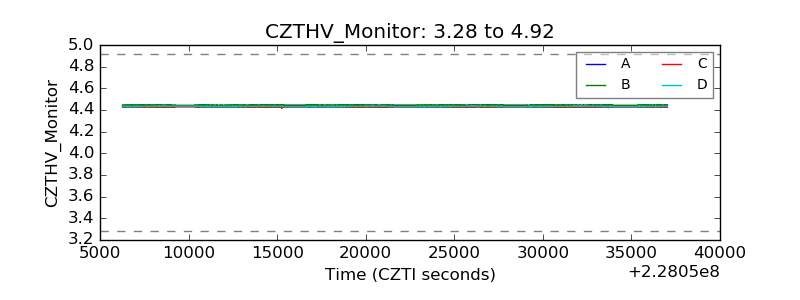 |
| D_VDD |  |
| Temperature 1 | 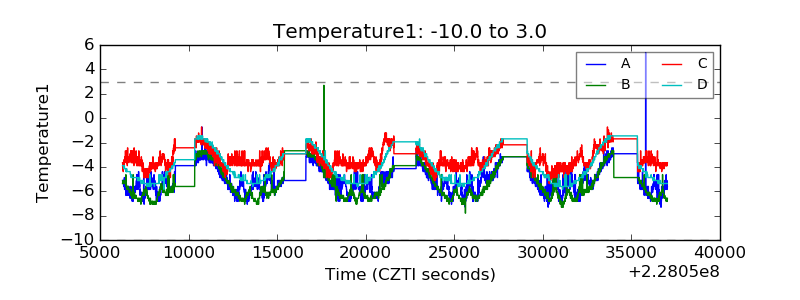 |
| Veto HV Monitor | 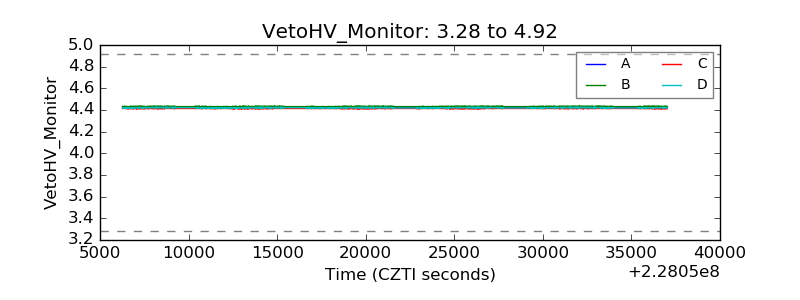 |
| Veto LLD | 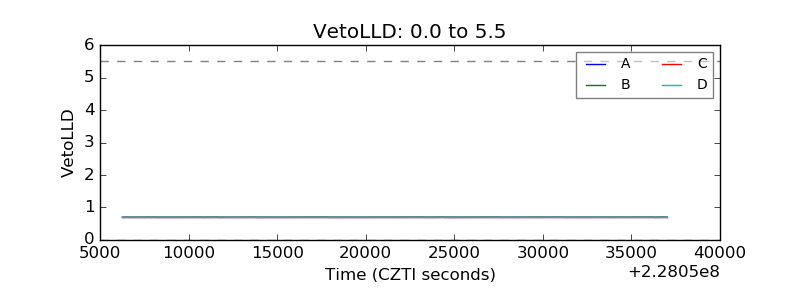 |
| Alpha Counter | 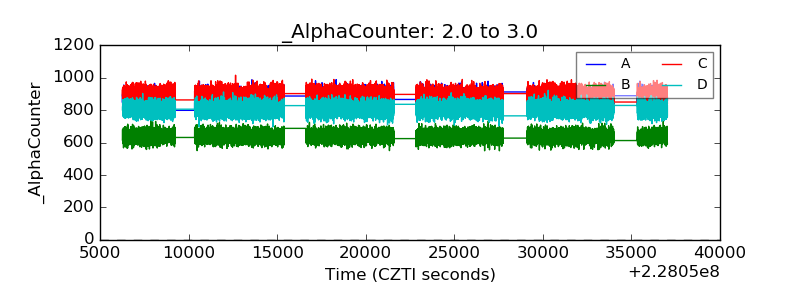 |
| _CPM_Rate | 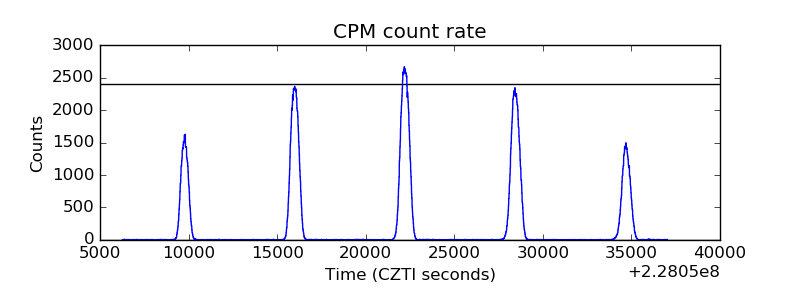 |
| CZT Counter |  |
| +2.5 Volts monitor |  |
| +5 Volts monitor |  |
| _ROLL_ROT | 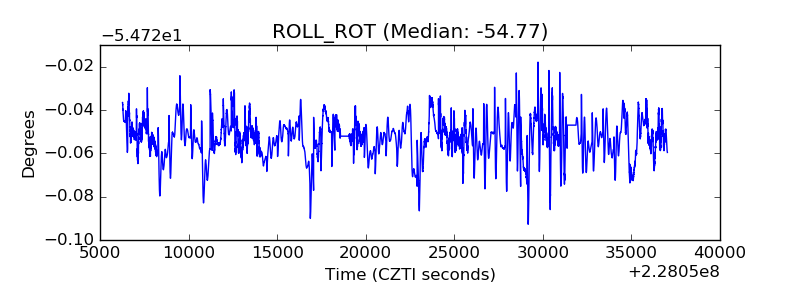 |
| _Roll_DEC | 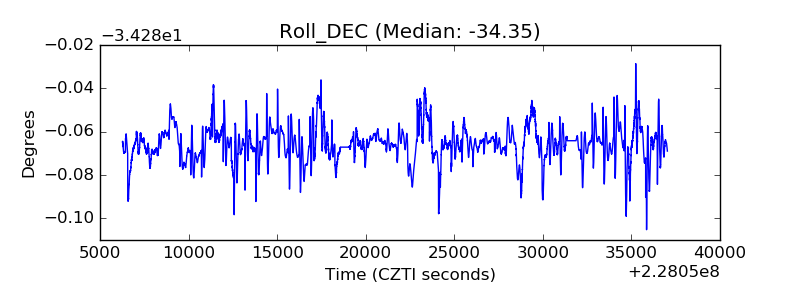 |
| _Roll_RA |  |
| Veto Counter | 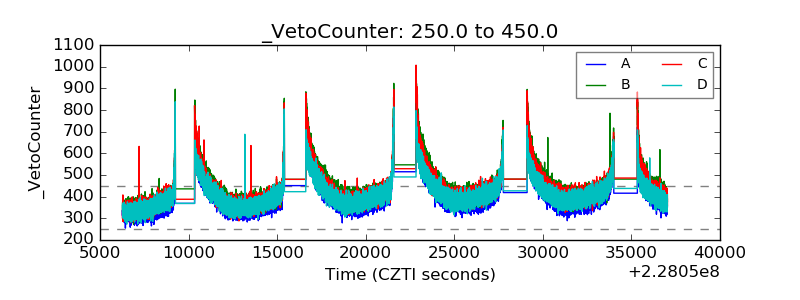 |