| Param | Original file | Final file |
|---|---|---|
| Filename | modeM0/AS1G06_168T22_9000001108cztM0_level2.fits | modeM0/AS1G06_168T22_9000001108cztM0_level2_quad_clean.evt |
| Size (bytes) | 58,098,240 | 61,027,200 |
| Size | 55.4 MB | 58.2 MB |
| Events in quadrant A | 344,870 | 363,787 |
| Events in quadrant B | 339,658 | 372,909 |
| Events in quadrant C | 347,326 | 367,171 |
| Events in quadrant D | 282,788 | 298,605 |
| Mode M0 | |||
|---|---|---|---|
| Quadrant | BADHDUFLAG | Total packets | Discarded packets |
| A | 0 | 15613 | 0 |
| B | 0 | 14004 | 0 |
| C | 0 | 13005 | 0 |
| D | 0 | 18676 | 0 |
| Mode SS | |||
|---|---|---|---|
| Quadrant | BADHDUFLAG | Total packets | Discarded packets |
| A | 0 | 130 | 0 |
| B | 0 | 130 | 0 |
| C | 0 | 130 | 0 |
| D | 0 | 130 | 0 |
| Mode M9 | |||
|---|---|---|---|
| Quadrant | BADHDUFLAG | Total packets | Discarded packets |
| A | 0 | 12 | 0 |
| B | 0 | 12 | 0 |
| C | 0 | 12 | 0 |
| D | 0 | 12 | 0 |
| Quadrant | Total seconds | Saturated seconds | Saturation percentage |
|---|---|---|---|
| A | 6375 | 99 | 1.552941% |
| B | 6375 | 99 | 1.552941% |
| C | 6375 | 11 | 0.172549% |
| D | 6375 | 514 | 8.062745% |
Noise dominated data is calculated using 1-second bins in cleaned event files. If a bin has >2000 counts, and if more than 50% of those come from <1% of pixels, then it is considered to be noise-dominated and hence unusable.
| Quadrant | # 1 sec bins | Bins with >0 counts | Bins with >2000 counts | High rate bins dominated by noise | Noise dominated (total time) | Noise dominated (detector-on time) | Marked lightcurve |
|---|---|---|---|---|---|---|---|
| A | 7580 | 6375 | 0 | 0 | 0.00% | 0.00% |  |
| B | 7580 | 6375 | 0 | 0 | 0.00% | 0.00% | 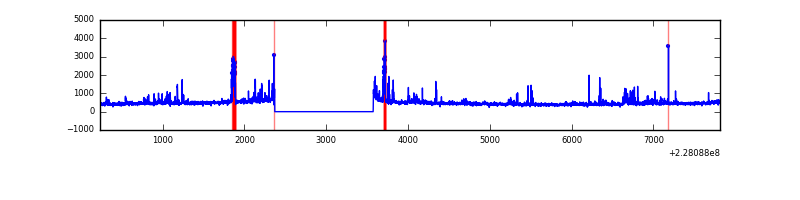 |
| C | 7580 | 6375 | 0 | 0 | 0.00% | 0.00% | 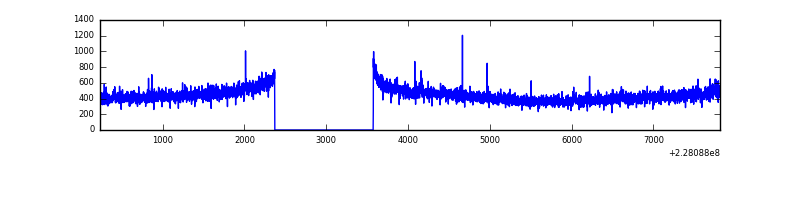 |
| D | 7580 | 6288 | 0 | 0 | 0.00% | 0.00% | 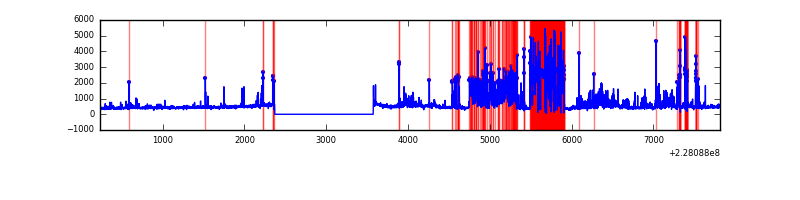 |
Top three noisy pixels from each quadrant. If the there are fewer than three noisy pixels in the level2.evt file, extra rows are filled as -1
| Pixel properties | Quadrant properties | ||||||
|---|---|---|---|---|---|---|---|
| Quadrant | DetID | PixID | Counts | Sigma | Mean | Median | Sigma |
| A | 0 | 29 | 365 | 11.47 | 89 | 84 | 24.5 |
| A | 7 | 110 | 289 | 8.36 | 89 | 84 | 24.5 |
| A | 0 | 30 | 283 | 8.12 | 89 | 84 | 24.5 |
| B | 2 | 9 | 325 | 12.31 | 89 | 85 | 19.5 |
| B | 14 | 254 | 230 | 7.44 | 89 | 85 | 19.5 |
| B | 4 | 227 | 227 | 7.28 | 89 | 85 | 19.5 |
| C | 2 | 191 | 260 | 6.76 | 91 | 85 | 25.9 |
| C | 12 | 241 | 252 | 6.45 | 91 | 85 | 25.9 |
| C | 1 | 65 | 243 | 6.1 | 91 | 85 | 25.9 |
| D | 7 | 3 | 218 | 6.29 | 80 | 73 | 23.1 |
| D | 3 | 14 | 215 | 6.16 | 80 | 73 | 23.1 |
| D | 6 | 67 | 213 | 6.07 | 80 | 73 | 23.1 |
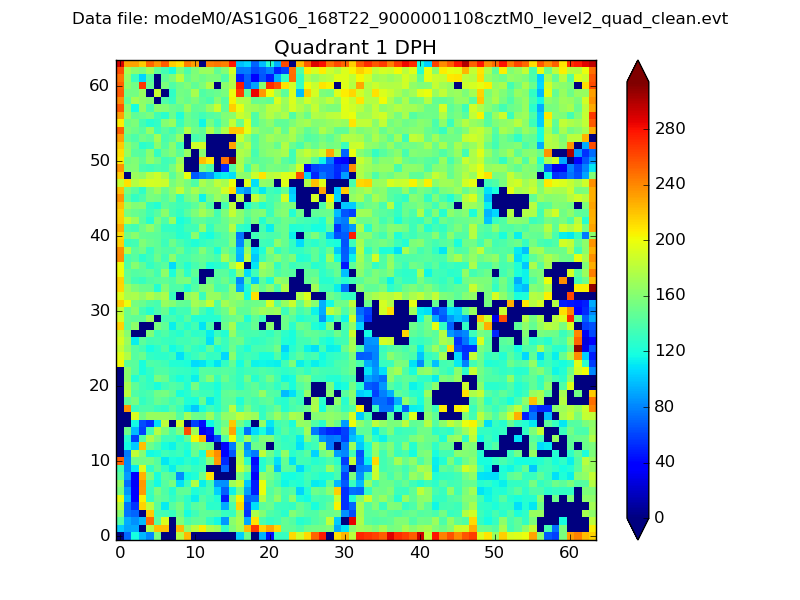
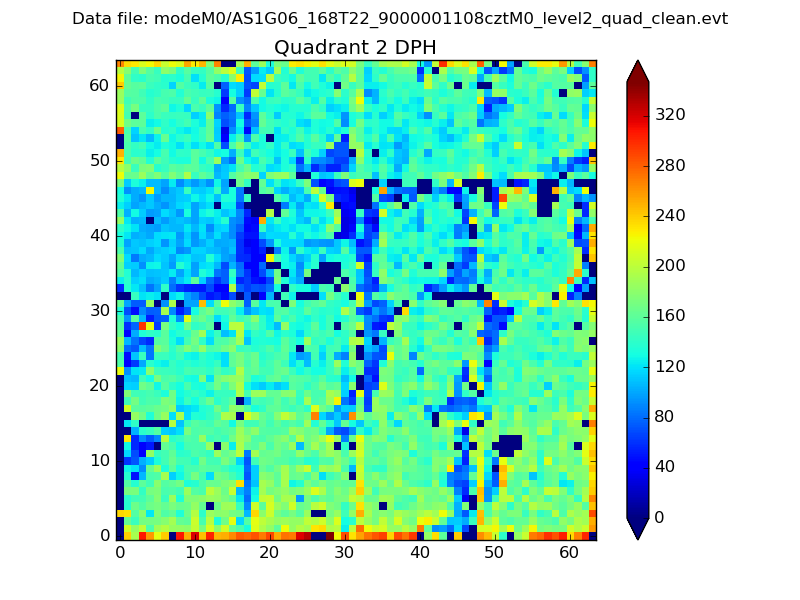
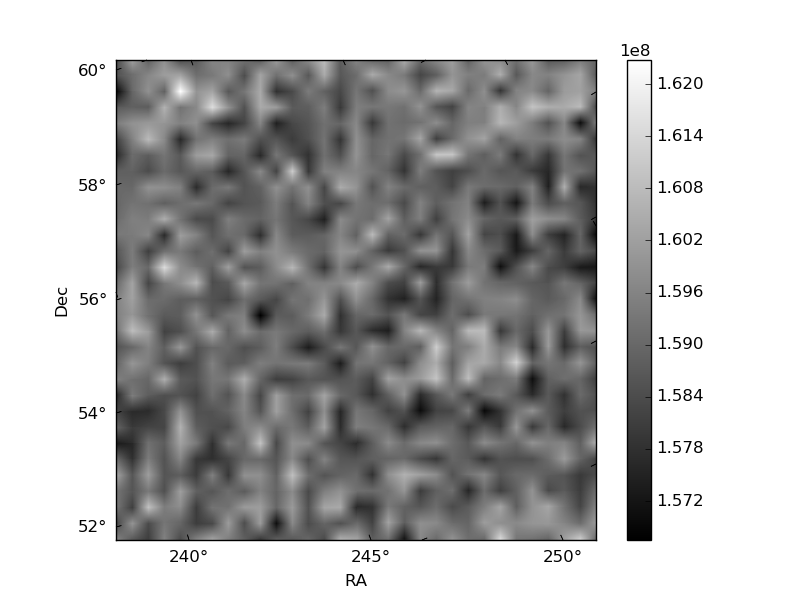
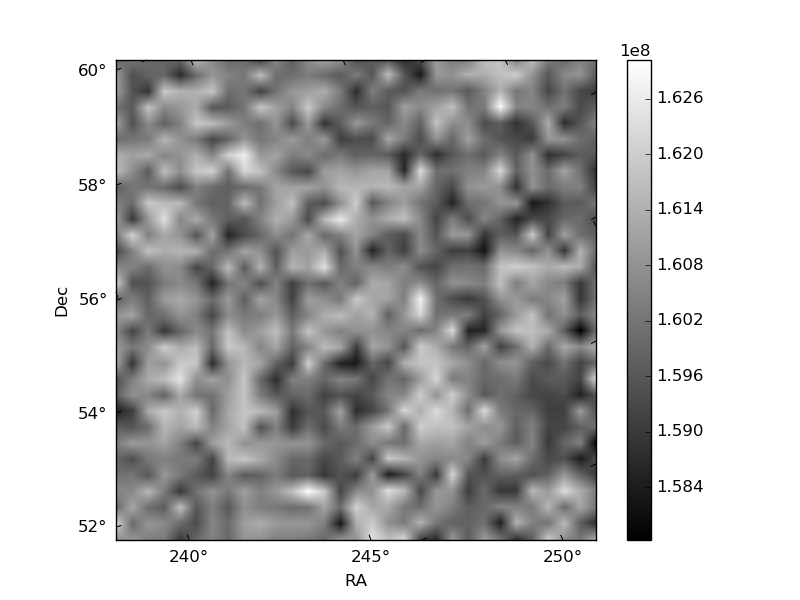
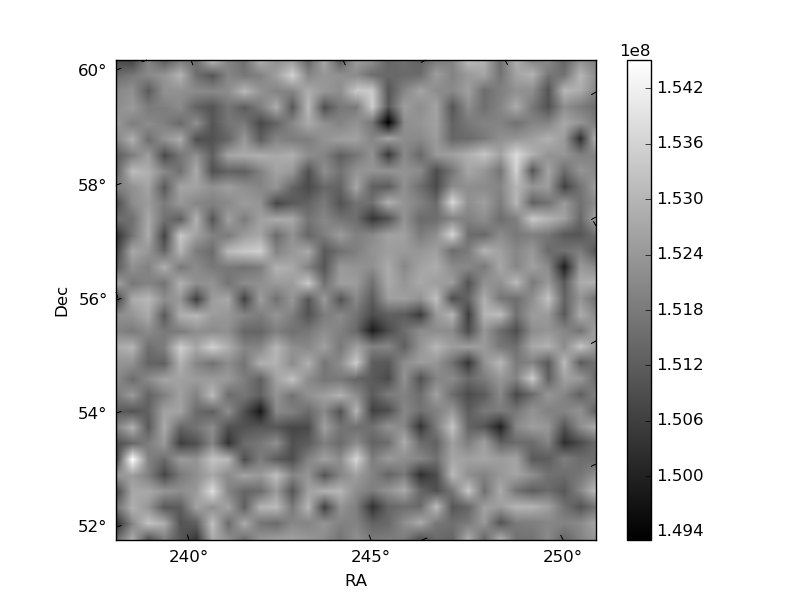
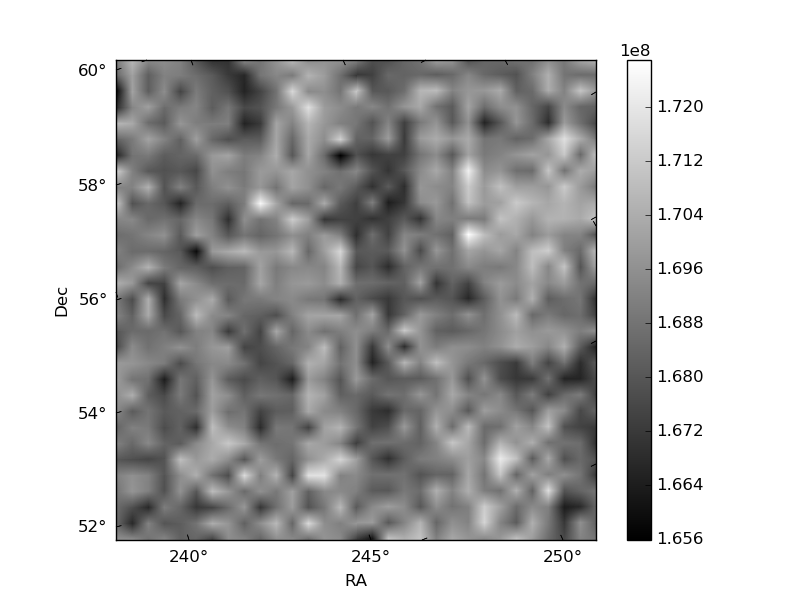
Histogram calculated using DETX and DETY for each event in the final _common_clean file
| Quadrant A | 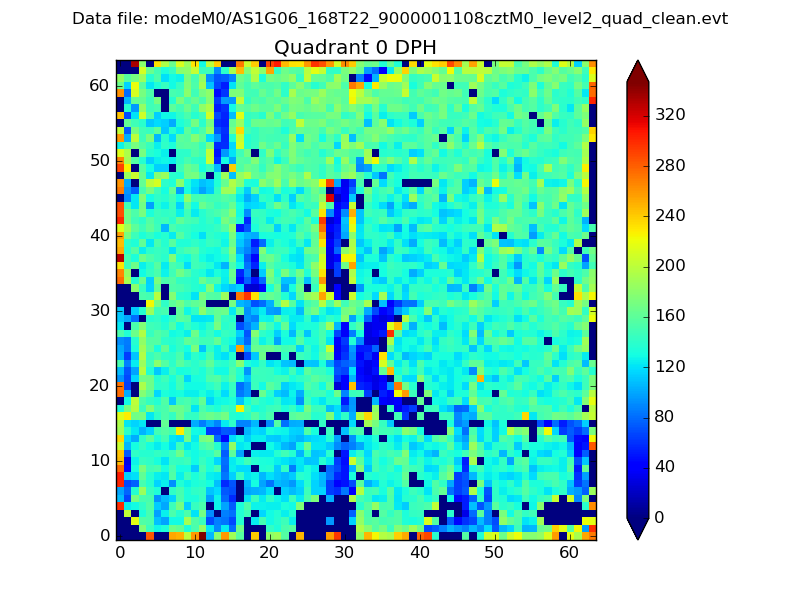 |
 |
Quadrant B |
|---|---|---|---|
| Quadrant D | 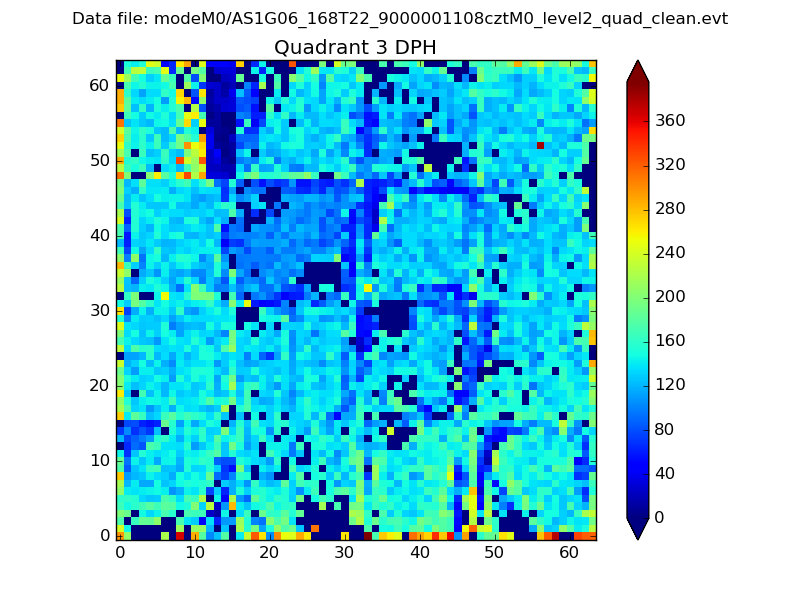 |
 |
Quadrant C |
| Plot type | Count rate plots | Images |
|---|---|---|
| Comparison with Poisson distribution Blue bars denote a histogram of data divided into 1 sec bins. Red curve is a Poisson curve with rate = median count rate of data. |
 |
 |
| Quadrant-wise count rates Data is divided into 100 sec bins |
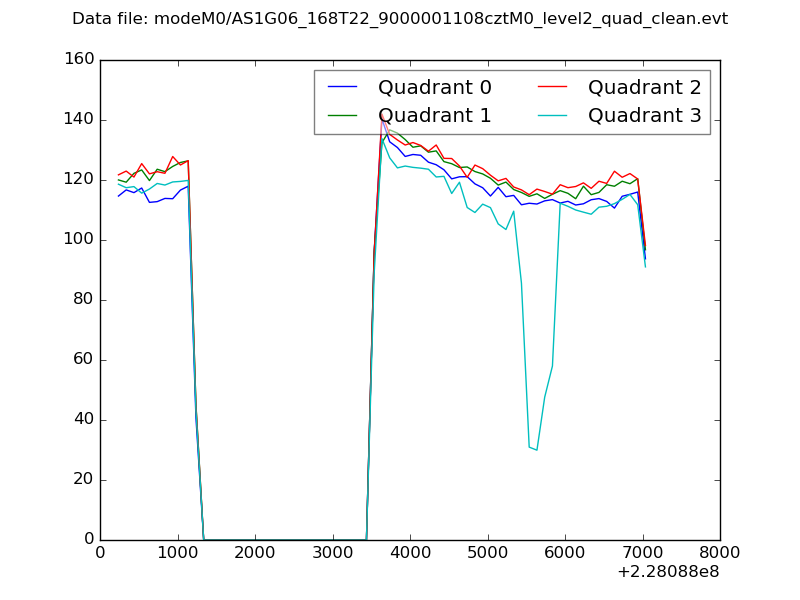 |
|
| Module-wise count rates for Quadrant A Data is divided into 100 sec bins |
 |
 |
| Module-wise count rates for Quadrant B Data is divided into 100 sec bins |
 |
 |
| Module-wise count rates for Quadrant C Data is divided into 100 sec bins |
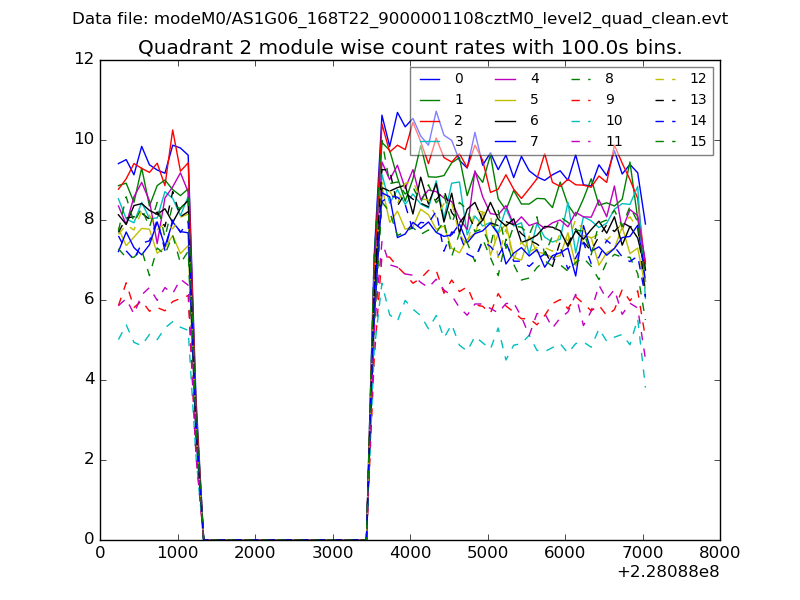 |
 |
| Module-wise count rates for Quadrant D Data is divided into 100 sec bins |
 |
 |
| Parameter | Plot |
|---|---|
| CZT HV Monitor | 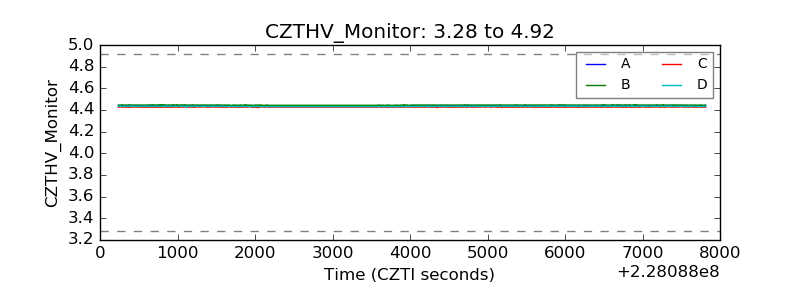 |
| D_VDD | 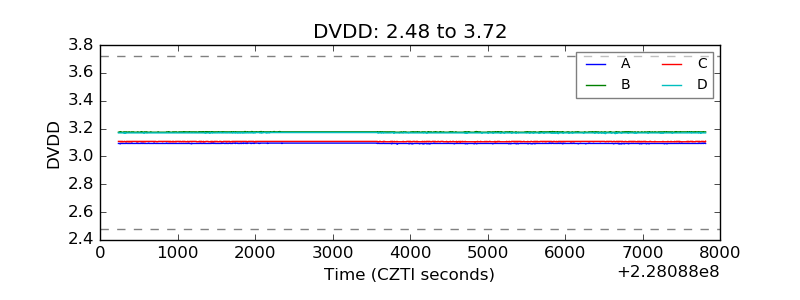 |
| Temperature 1 |  |
| Veto HV Monitor |  |
| Veto LLD | 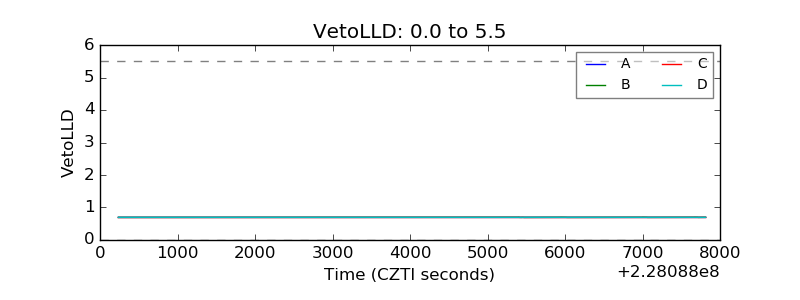 |
| Alpha Counter | 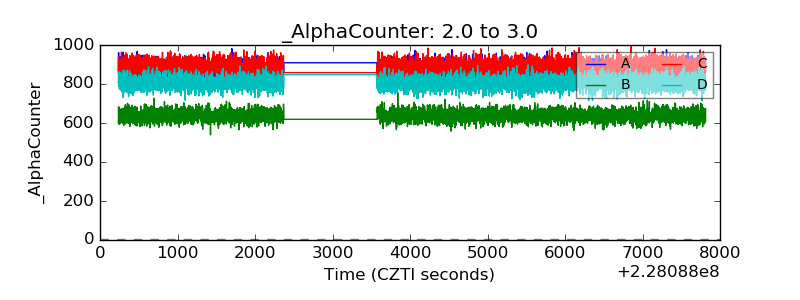 |
| _CPM_Rate | 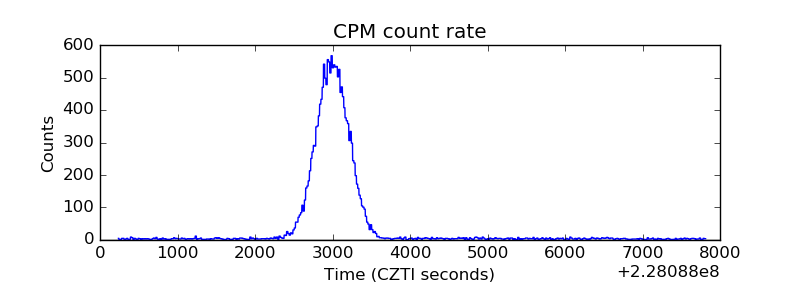 |
| CZT Counter | 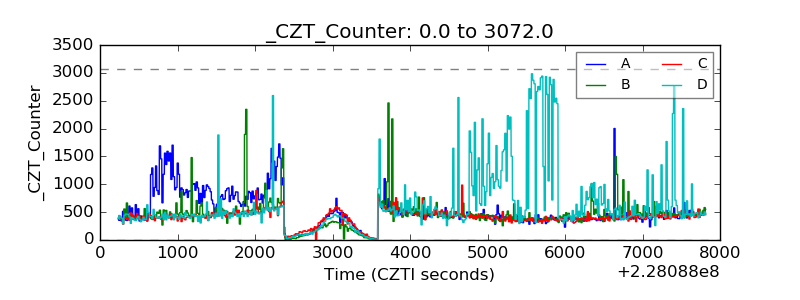 |
| +2.5 Volts monitor | 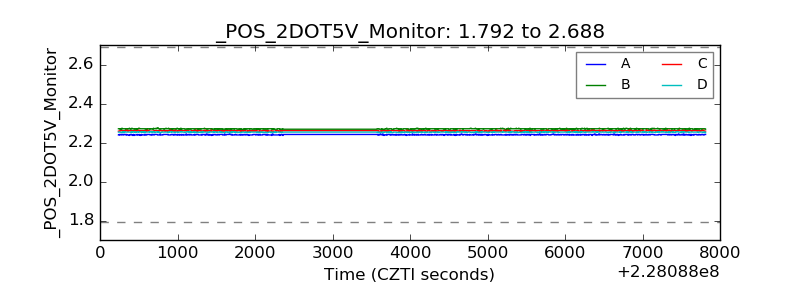 |
| +5 Volts monitor | 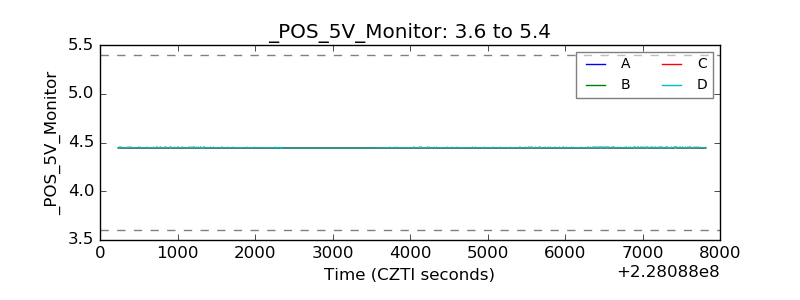 |
| _ROLL_ROT | 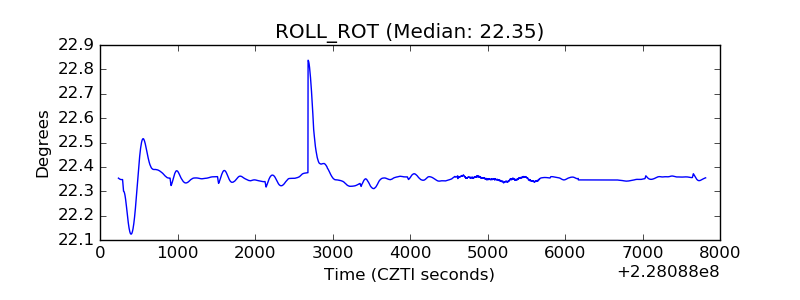 |
| _Roll_DEC | 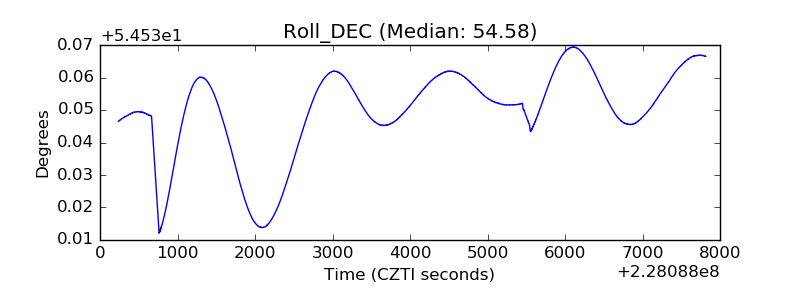 |
| _Roll_RA | 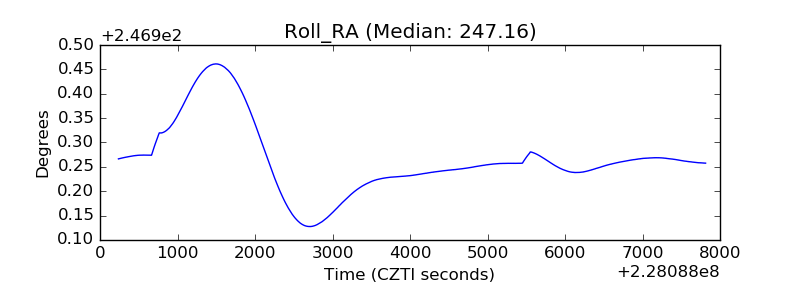 |
| Veto Counter | 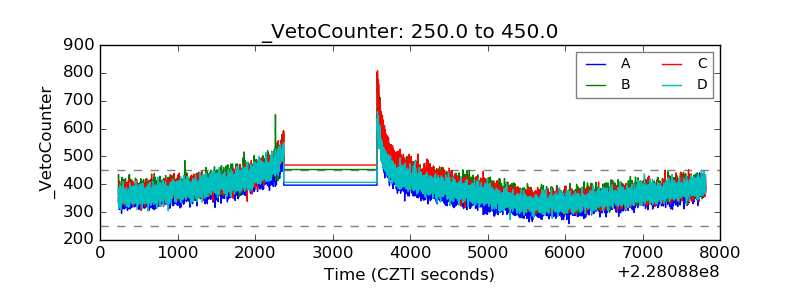 |