| Param | Original file | Final file |
|---|---|---|
| Filename | modeM0/AS1G06_168T22_9000001108_08050cztM0_level2.evt | modeM0/AS1G06_168T22_9000001108_08050cztM0_level2_quad_clean.evt |
| Size (bytes) | 491,037,120 | 86,351,040 |
| Size | 468.3 MB | 82.4 MB |
| Events in quadrant A | 3,637,043 | 541,489 |
| Events in quadrant B | 3,218,505 | 561,163 |
| Events in quadrant C | 2,793,990 | 566,791 |
| Events in quadrant D | 4,788,564 | 500,492 |
| Mode M0 | |||
|---|---|---|---|
| Quadrant | BADHDUFLAG | Total packets | Discarded packets |
| A | 0 | 15614 | 1 |
| B | 0 | 14005 | 1 |
| C | 0 | 13006 | 1 |
| D | 0 | 18677 | 1 |
| Mode SS | |||
|---|---|---|---|
| Quadrant | BADHDUFLAG | Total packets | Discarded packets |
| A | 0 | 130 | 0 |
| B | 0 | 130 | 0 |
| C | 0 | 130 | 0 |
| D | 0 | 130 | 0 |
| Mode M9 | |||
|---|---|---|---|
| Quadrant | BADHDUFLAG | Total packets | Discarded packets |
| A | 0 | 12 | 0 |
| B | 0 | 12 | 0 |
| C | 0 | 12 | 0 |
| D | 0 | 12 | 0 |
| Quadrant | Total seconds | Saturated seconds | Saturation percentage |
|---|---|---|---|
| A | 6375 | 99 | 1.552941% |
| B | 6375 | 99 | 1.552941% |
| C | 6375 | 11 | 0.172549% |
| D | 6375 | 514 | 8.062745% |
Noise dominated data is calculated using 1-second bins in cleaned event files. If a bin has >2000 counts, and if more than 50% of those come from <1% of pixels, then it is considered to be noise-dominated and hence unusable.
| Quadrant | # 1 sec bins | Bins with >0 counts | Bins with >2000 counts | High rate bins dominated by noise | Noise dominated (total time) | Noise dominated (detector-on time) | Marked lightcurve |
|---|---|---|---|---|---|---|---|
| A | 7580 | 6376 | 8 | 8 | 0.11% | 0.13% | 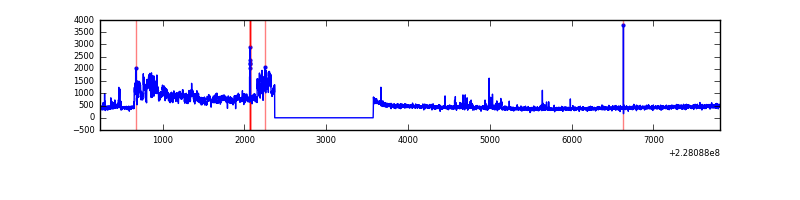 |
| B | 7580 | 6376 | 35 | 35 | 0.46% | 0.55% | 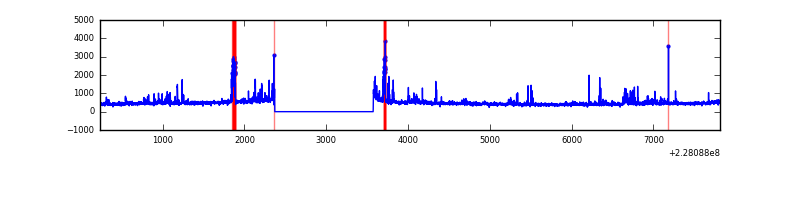 |
| C | 7580 | 6376 | 0 | 0 | 0.00% | 0.00% | 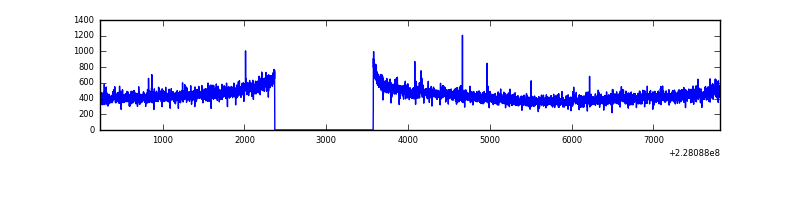 |
| D | 7580 | 6376 | 477 | 477 | 6.29% | 7.48% | 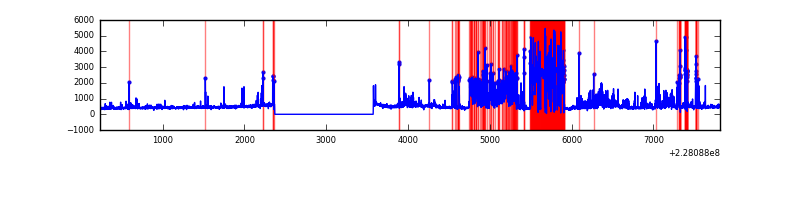 |
Top three noisy pixels from each quadrant. If the there are fewer than three noisy pixels in the level2.evt file, extra rows are filled as -1
| Pixel properties | Quadrant properties | ||||||
|---|---|---|---|---|---|---|---|
| Quadrant | DetID | PixID | Counts | Sigma | Mean | Median | Sigma |
| A | 15 | 79 | 793976 | 5439.81 | 716 | 700 | 145.8 |
| A | 4 | 2 | 79526 | 540.54 | 716 | 700 | 145.8 |
| A | 13 | 14 | 7224 | 44.74 | 716 | 700 | 145.8 |
| B | 4 | 239 | 173118 | 1255.22 | 723 | 706 | 137.4 |
| B | 4 | 81 | 135193 | 979.11 | 723 | 706 | 137.4 |
| B | 5 | 250 | 48983 | 351.47 | 723 | 706 | 137.4 |
| C | 1 | 16 | 47451 | 288.65 | 703 | 706 | 161.9 |
| C | 13 | 61 | 5308 | 28.42 | 703 | 706 | 161.9 |
| C | 12 | 4 | 2764 | 12.71 | 703 | 706 | 161.9 |
| D | 1 | 52 | 1913228 | 10939.41 | 665 | 647 | 174.8 |
| D | 2 | 136 | 119983 | 682.57 | 665 | 647 | 174.8 |
| D | 2 | 14 | 89421 | 507.76 | 665 | 647 | 174.8 |
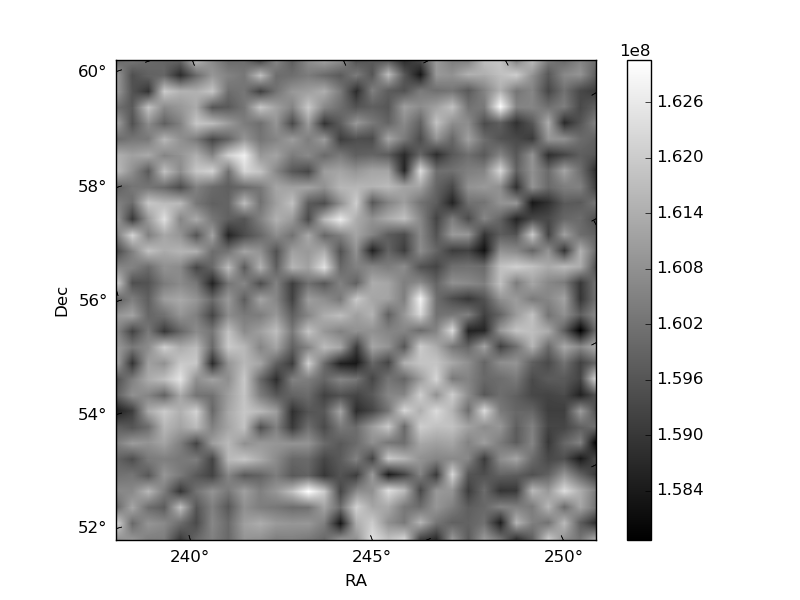
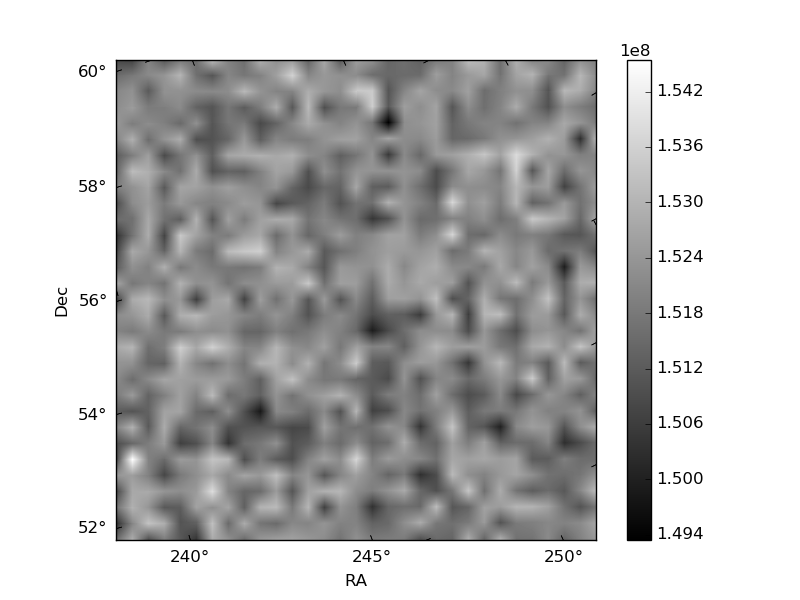
Histogram calculated using DETX and DETY for each event in the final _common_clean file
| Quadrant A | 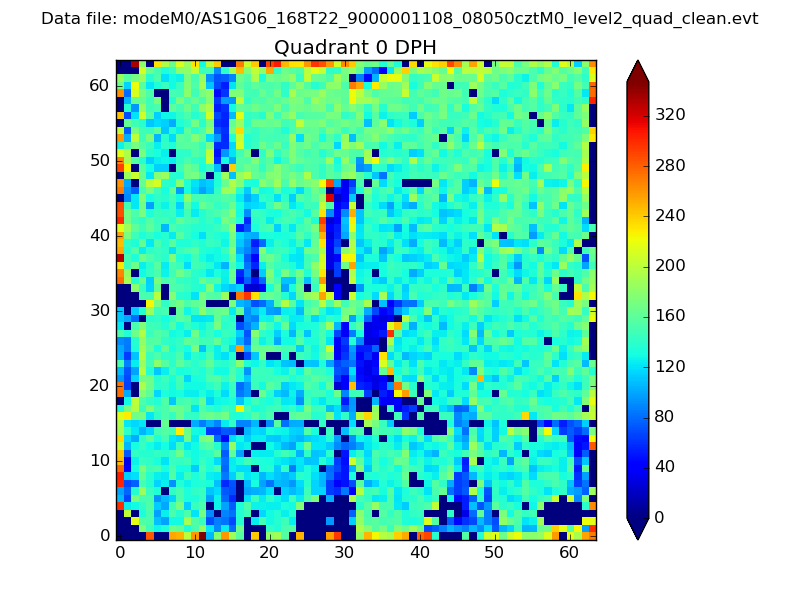 |
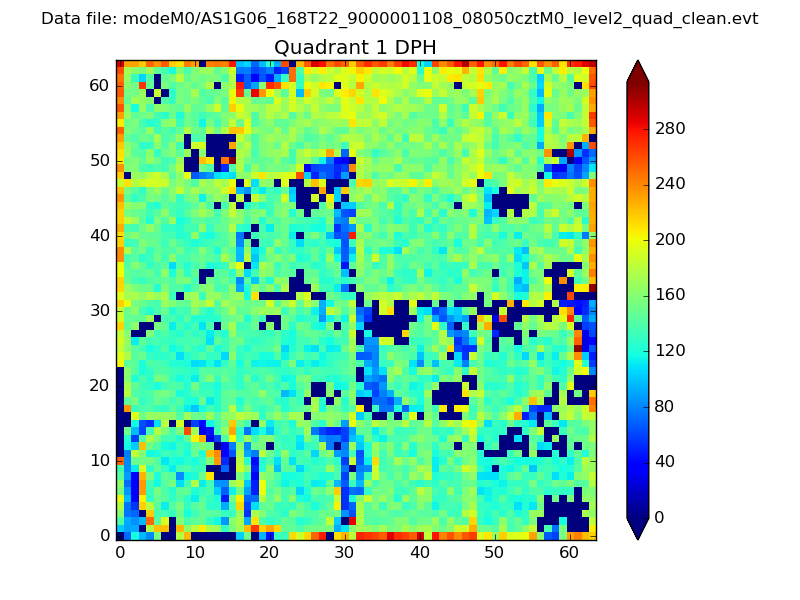 |
Quadrant B |
|---|---|---|---|
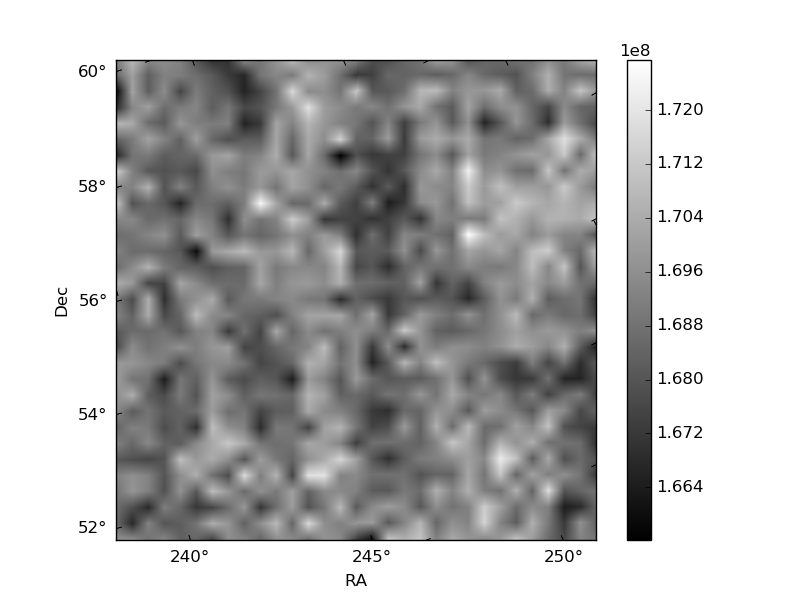
| Quadrant D | 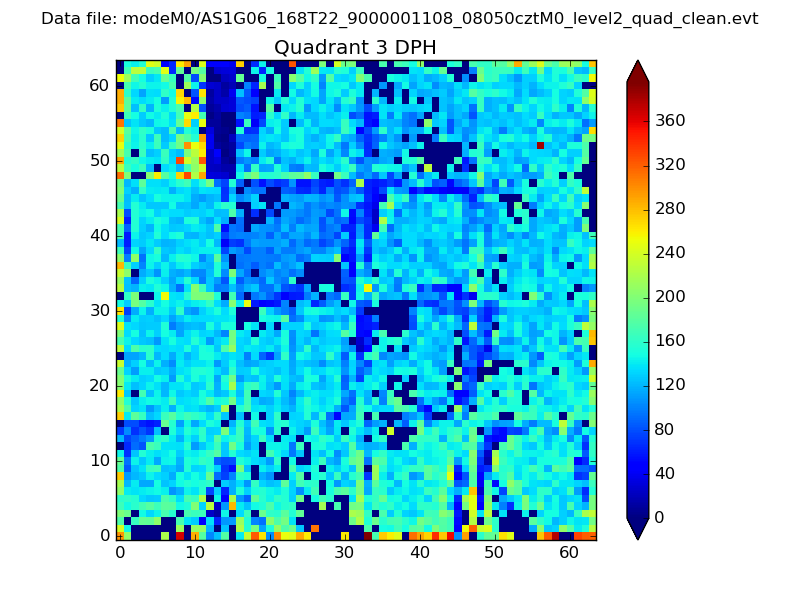 |
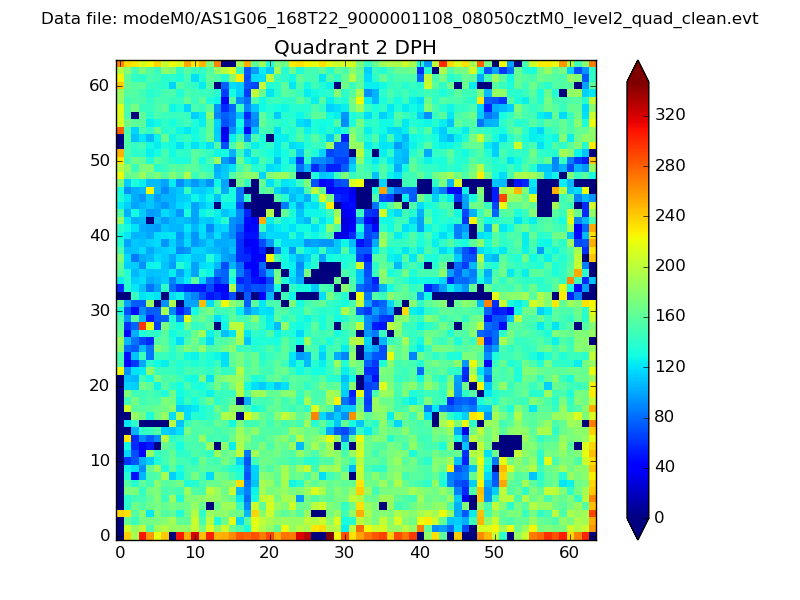 |
Quadrant C |
| Plot type | Count rate plots | Images |
|---|---|---|
| Comparison with Poisson distribution Blue bars denote a histogram of data divided into 1 sec bins. Red curve is a Poisson curve with rate = median count rate of data. |
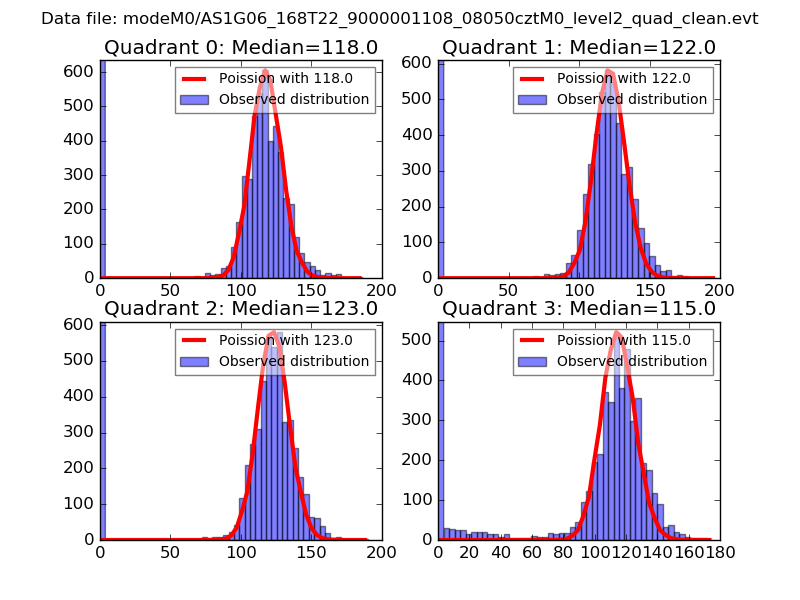 |
 |
| Quadrant-wise count rates Data is divided into 100 sec bins |
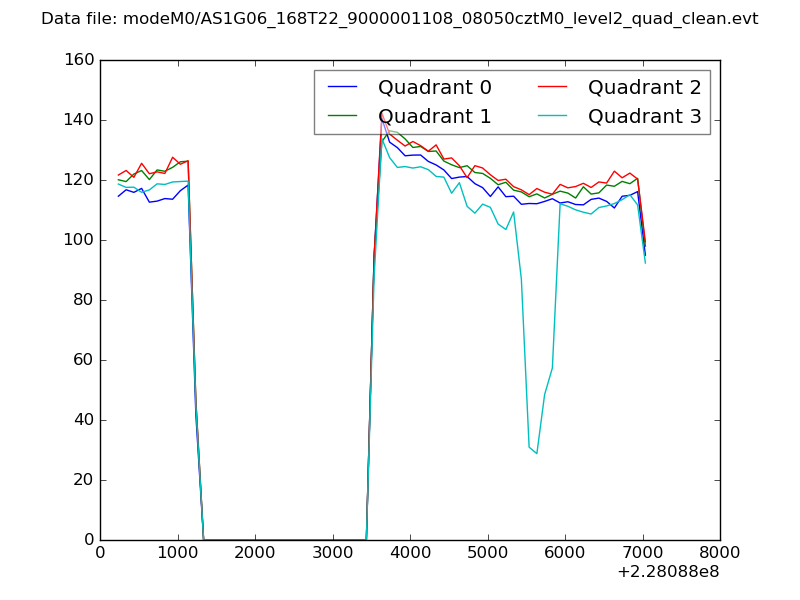 |
|
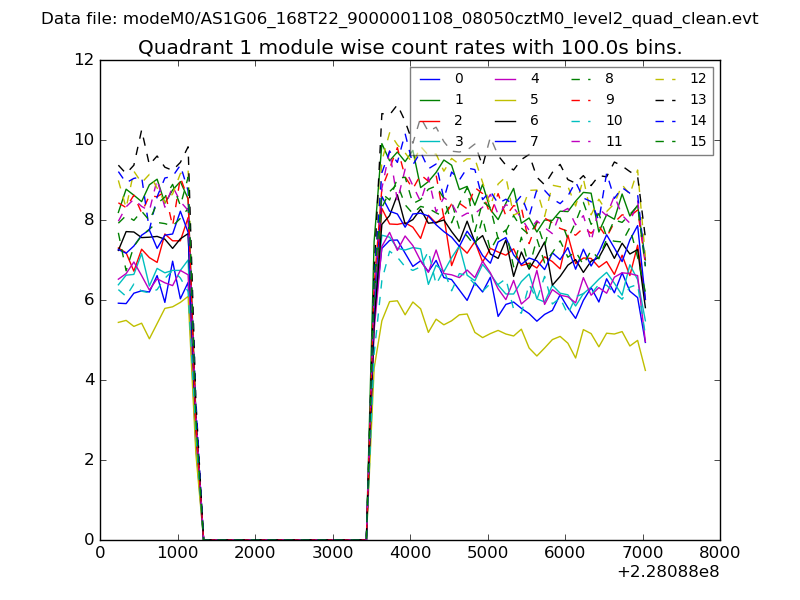
| Module-wise count rates for Quadrant A Data is divided into 100 sec bins |
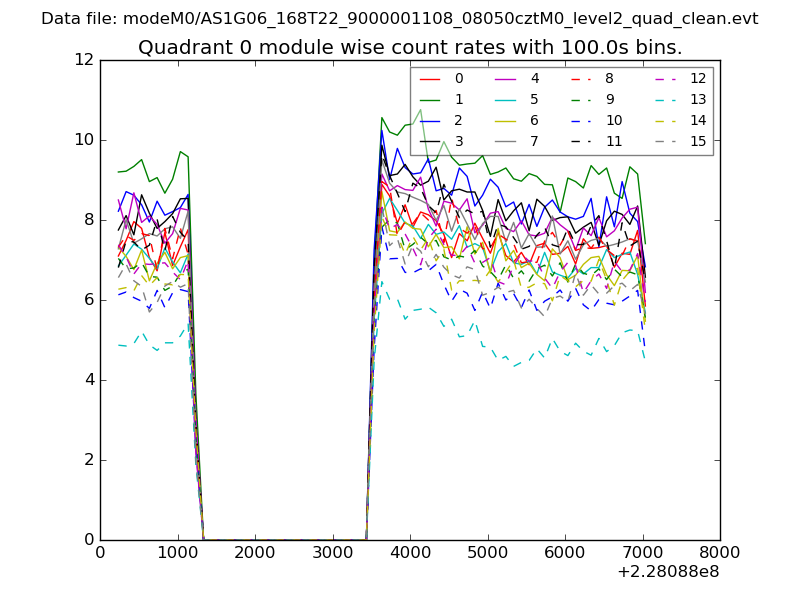 |
 |
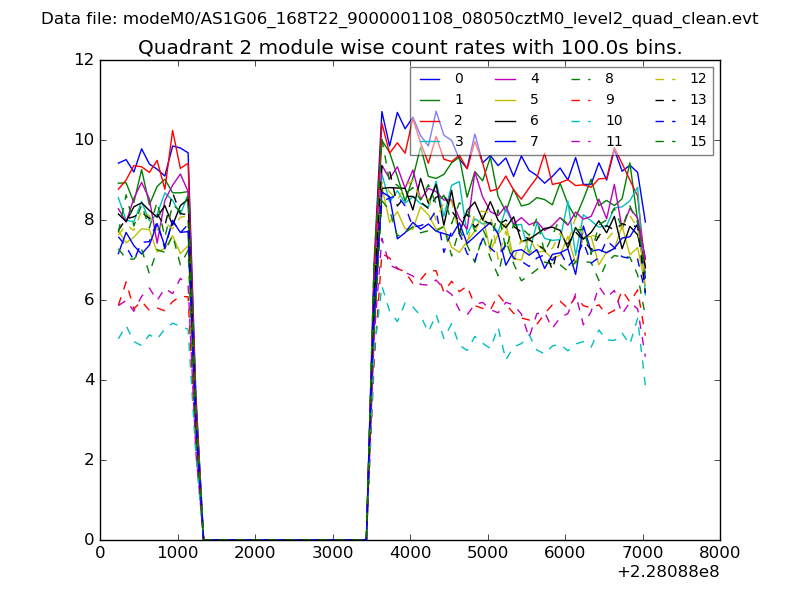
| Module-wise count rates for Quadrant B Data is divided into 100 sec bins |
 |
 |
| Module-wise count rates for Quadrant C Data is divided into 100 sec bins |
 |
 |
| Module-wise count rates for Quadrant D Data is divided into 100 sec bins |
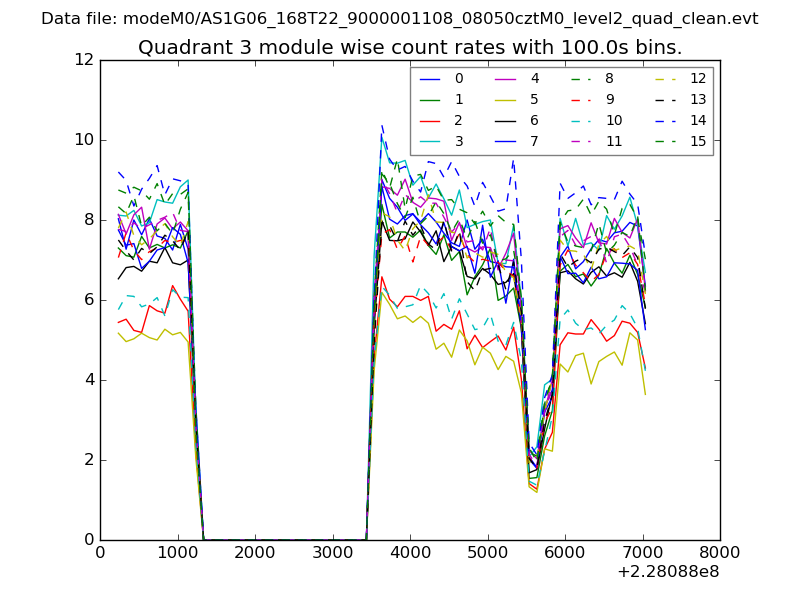 |
 |
| Parameter | Plot |
|---|---|
| CZT HV Monitor | 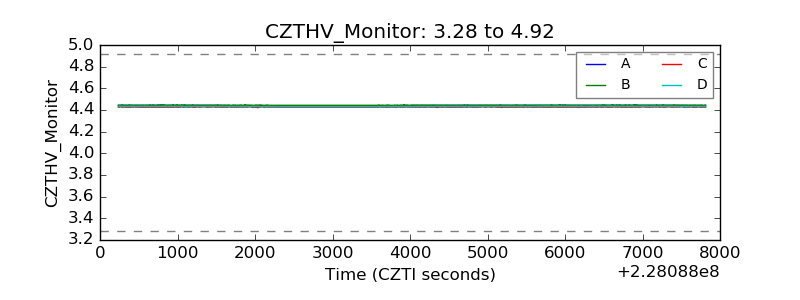 |
| D_VDD |  |
| Temperature 1 | 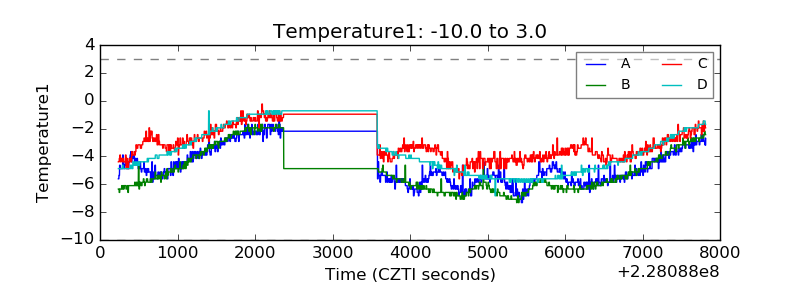 |
| Veto HV Monitor | 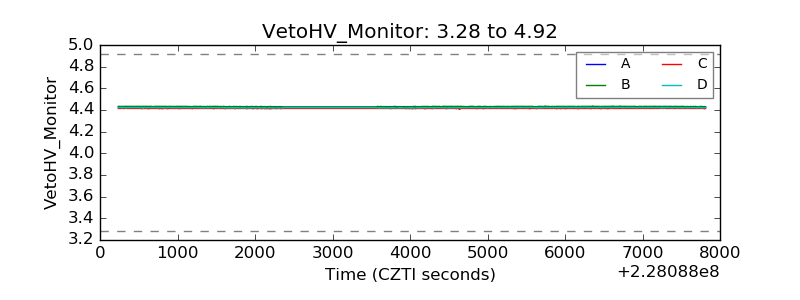 |
| Veto LLD | 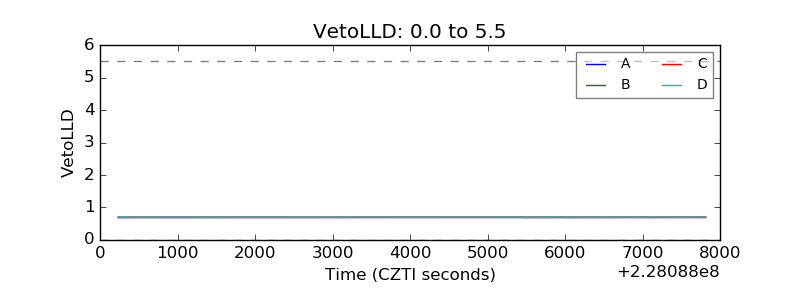 |
| Alpha Counter | 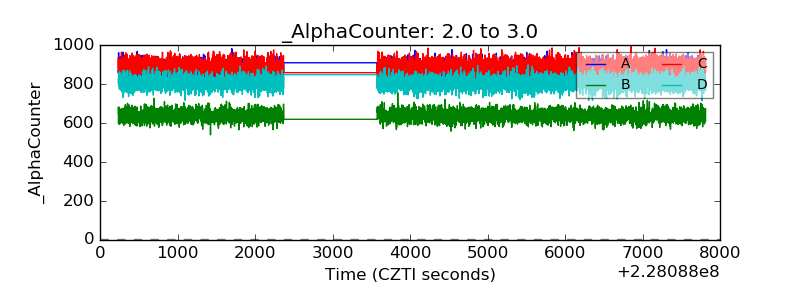 |
| _CPM_Rate | 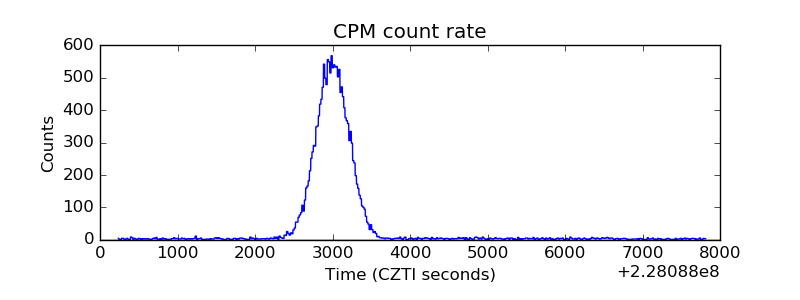 |
| CZT Counter | 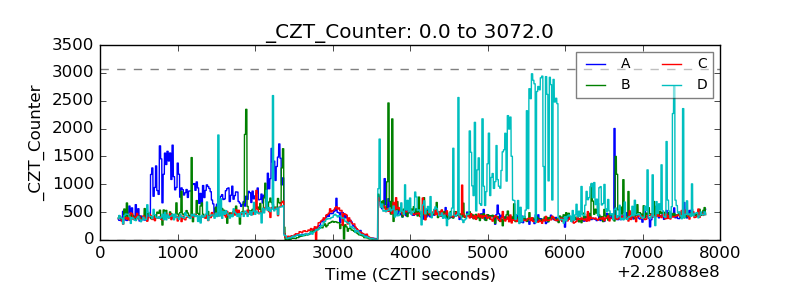 |
| +2.5 Volts monitor |  |
| +5 Volts monitor |  |
| _ROLL_ROT | 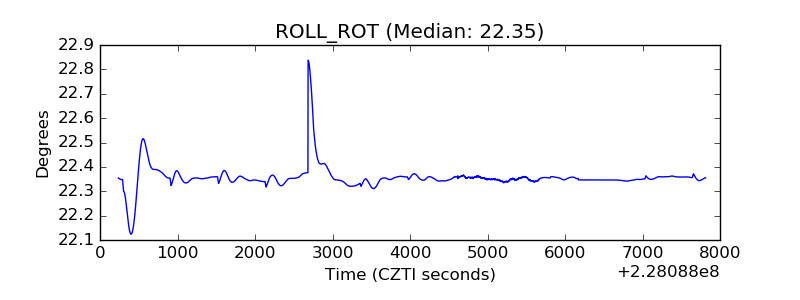 |
| _Roll_DEC | 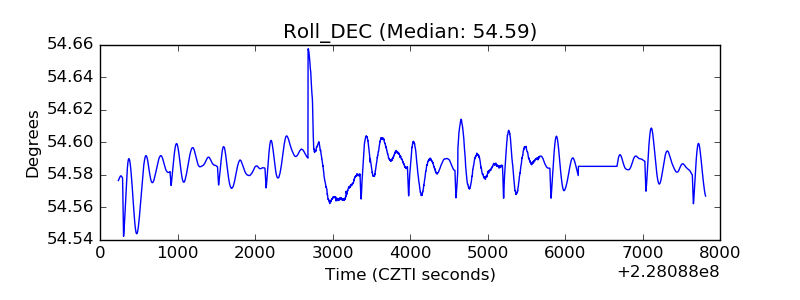 |
| _Roll_RA |  |
| Veto Counter | 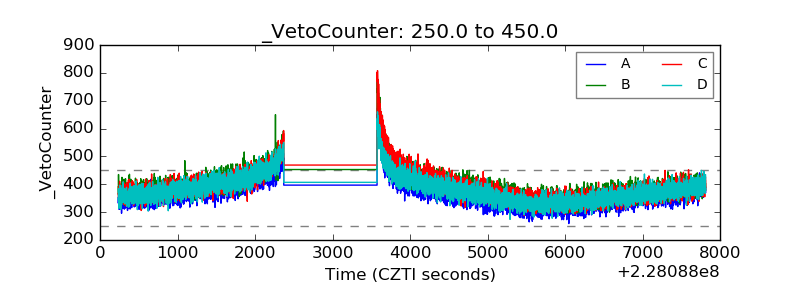 |