| Param | Original file | Final file |
|---|---|---|
| Filename | modeM0/AS1A02_055T01_9000001114_08053cztM0_level2.evt | modeM0/AS1A02_055T01_9000001114_08053cztM0_level2_quad_clean.evt |
| Size (bytes) | 113,886,720 | 31,095,360 |
| Size | 108.6 MB | 29.7 MB |
| Events in quadrant A | 758,055 | 199,949 |
| Events in quadrant B | 849,644 | 206,929 |
| Events in quadrant C | 748,979 | 209,410 |
| Events in quadrant D | 971,329 | 197,481 |
| Mode M0 | |||
|---|---|---|---|
| Quadrant | BADHDUFLAG | Total packets | Discarded packets |
| A | 0 | 3627 | 2 |
| B | 0 | 3768 | 1 |
| C | 0 | 3602 | 1 |
| D | 0 | 4205 | 1 |
| Mode M9 | |||
|---|---|---|---|
| Quadrant | BADHDUFLAG | Total packets | Discarded packets |
| A | 0 | 1 | 0 |
| B | 0 | 1 | 0 |
| C | 0 | 1 | 0 |
| D | 0 | 1 | 0 |
| Mode SS | |||
|---|---|---|---|
| Quadrant | BADHDUFLAG | Total packets | Discarded packets |
| A | 0 | 34 | 0 |
| B | 0 | 34 | 0 |
| C | 0 | 34 | 0 |
| D | 0 | 34 | 0 |
| Quadrant | Total seconds | Saturated seconds | Saturation percentage |
|---|---|---|---|
| A | 1740 | 56 | 3.218391% |
| B | 1740 | 60 | 3.448276% |
| C | 1740 | 33 | 1.896552% |
| D | 1740 | 47 | 2.701149% |
Noise dominated data is calculated using 1-second bins in cleaned event files. If a bin has >2000 counts, and if more than 50% of those come from <1% of pixels, then it is considered to be noise-dominated and hence unusable.
| Quadrant | # 1 sec bins | Bins with >0 counts | Bins with >2000 counts | High rate bins dominated by noise | Noise dominated (total time) | Noise dominated (detector-on time) | Marked lightcurve |
|---|---|---|---|---|---|---|---|
| A | 1740 | 1740 | 0 | 0 | 0.00% | 0.00% | 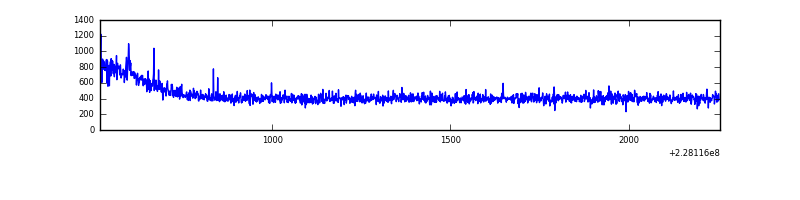 |
| B | 1740 | 1740 | 0 | 0 | 0.00% | 0.00% | 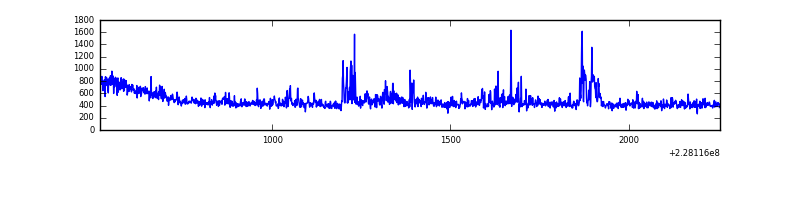 |
| C | 1740 | 1740 | 0 | 0 | 0.00% | 0.00% | 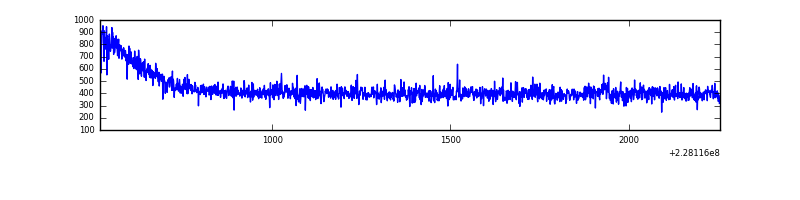 |
| D | 1740 | 1740 | 9 | 9 | 0.52% | 0.52% | 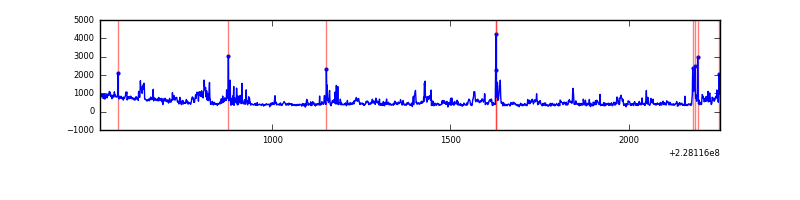 |
Top three noisy pixels from each quadrant. If the there are fewer than three noisy pixels in the level2.evt file, extra rows are filled as -1
| Pixel properties | Quadrant properties | ||||||
|---|---|---|---|---|---|---|---|
| Quadrant | DetID | PixID | Counts | Sigma | Mean | Median | Sigma |
| A | 4 | 2 | 7320 | 169.98 | 195 | 190 | 41.9 |
| A | 0 | 226 | 1769 | 37.64 | 195 | 190 | 41.9 |
| A | 12 | 194 | 1726 | 36.62 | 195 | 190 | 41.9 |
| B | 4 | 81 | 70499 | 1747.52 | 197 | 192 | 40.2 |
| B | 5 | 255 | 11548 | 282.26 | 197 | 192 | 40.2 |
| B | 12 | 111 | 4288 | 101.81 | 197 | 192 | 40.2 |
| C | 1 | 16 | 4227 | 88.31 | 190 | 191 | 45.7 |
| C | 13 | 61 | 1466 | 27.9 | 190 | 191 | 45.7 |
| C | 8 | 222 | 746 | 12.14 | 190 | 191 | 45.7 |
| D | 13 | 105 | 103425 | 2165.3 | 186 | 180 | 47.7 |
| D | 4 | 95 | 65627 | 1372.58 | 186 | 180 | 47.7 |
| D | 1 | 52 | 47035 | 982.66 | 186 | 180 | 47.7 |
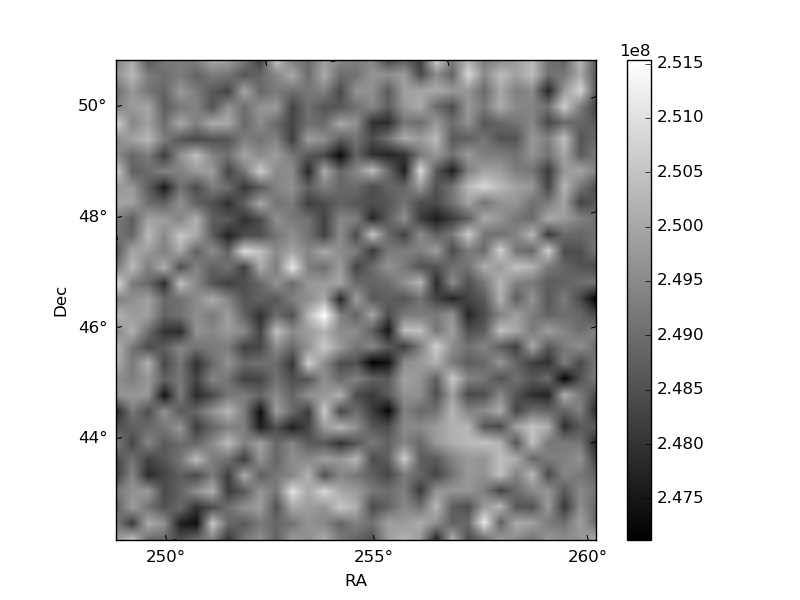
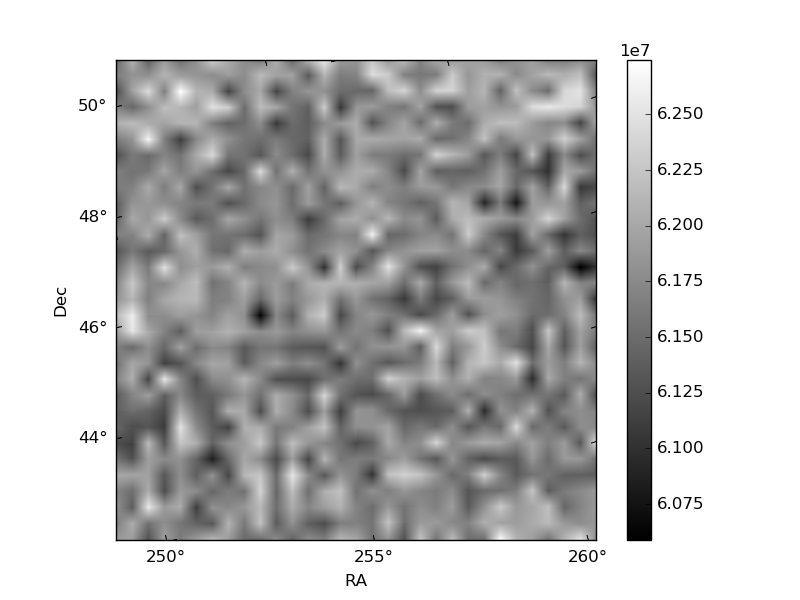
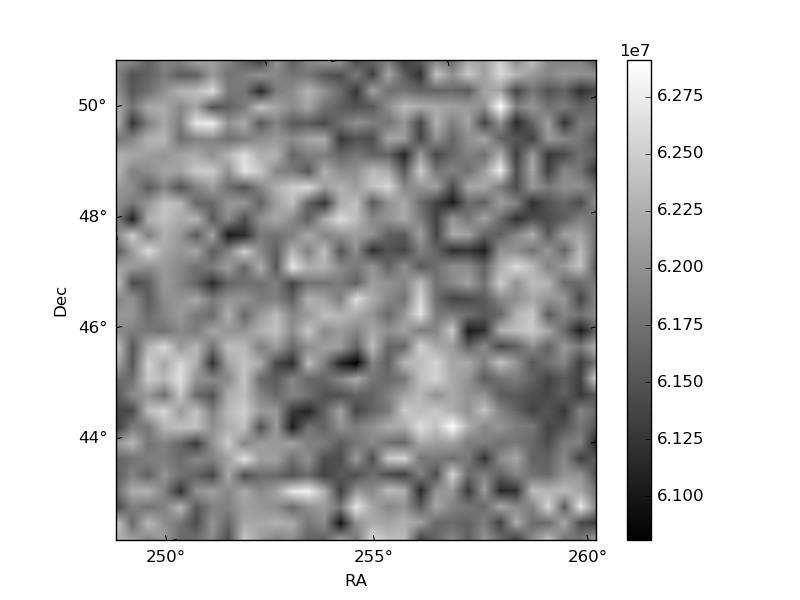
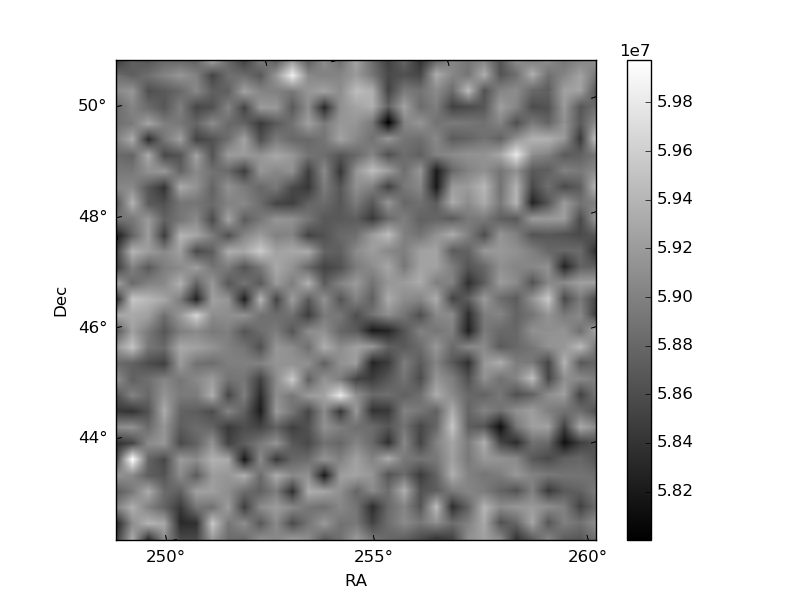
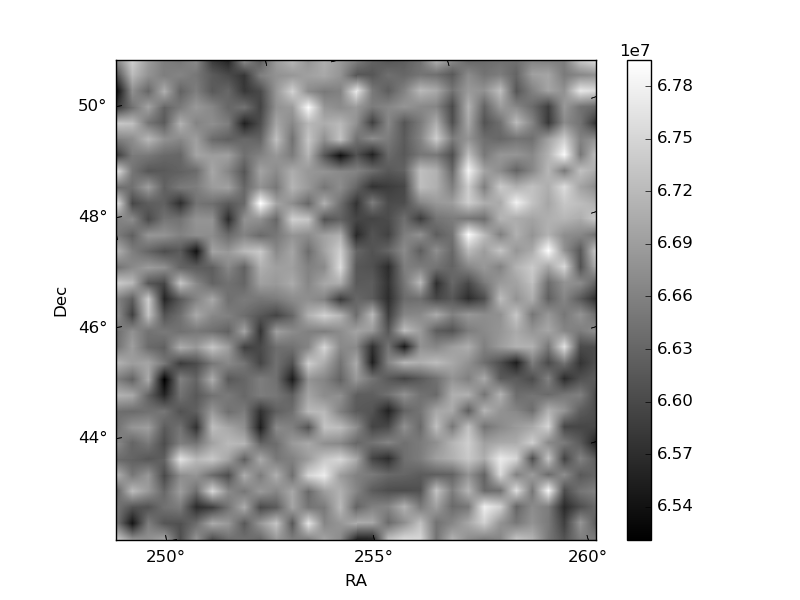
Histogram calculated using DETX and DETY for each event in the final _common_clean file
| Quadrant A | 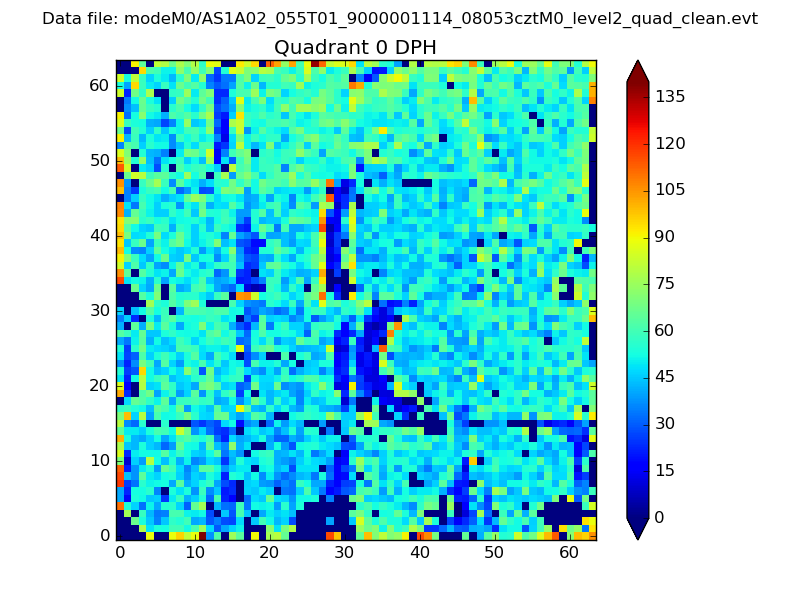 |
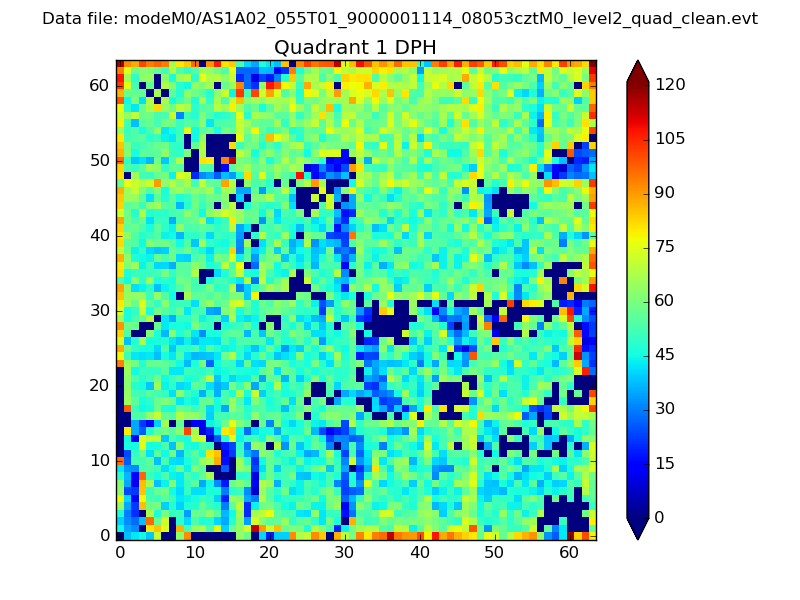 |
Quadrant B |
|---|---|---|---|
| Quadrant D | 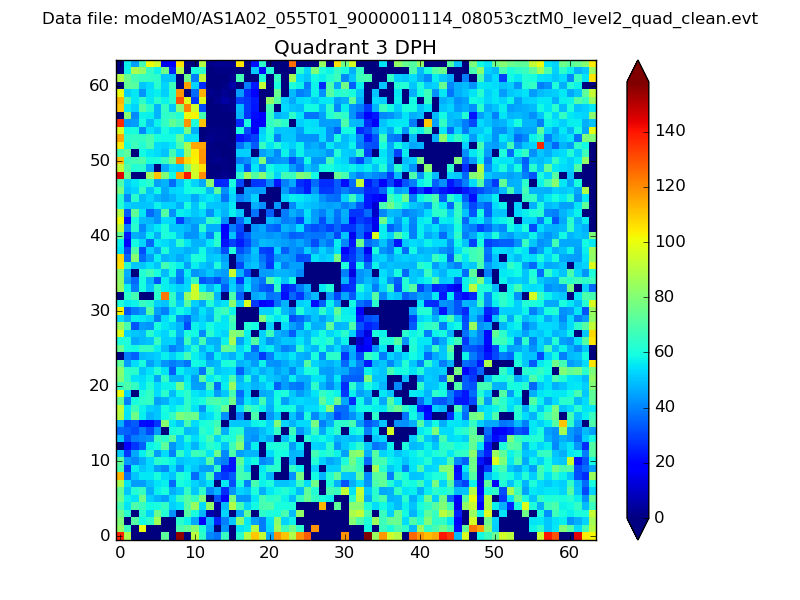 |
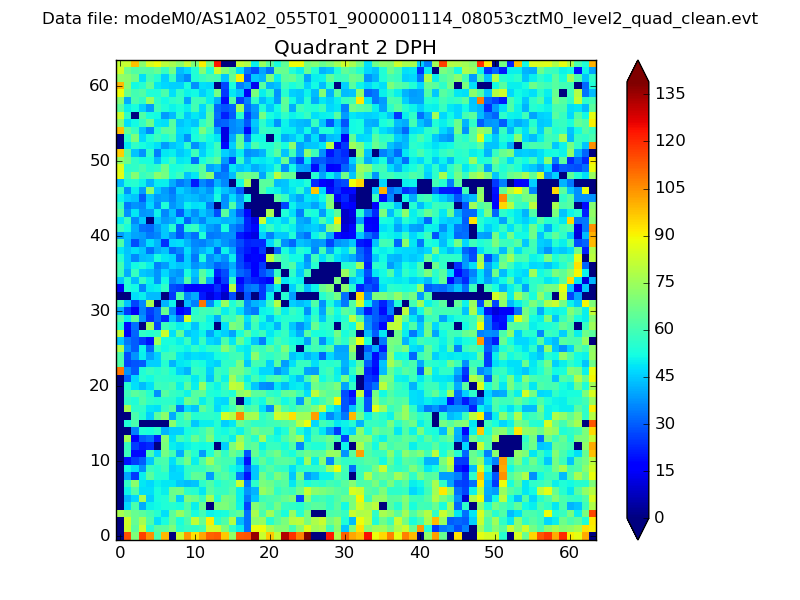 |
Quadrant C |
| Plot type | Count rate plots | Images |
|---|---|---|
| Comparison with Poisson distribution Blue bars denote a histogram of data divided into 1 sec bins. Red curve is a Poisson curve with rate = median count rate of data. |
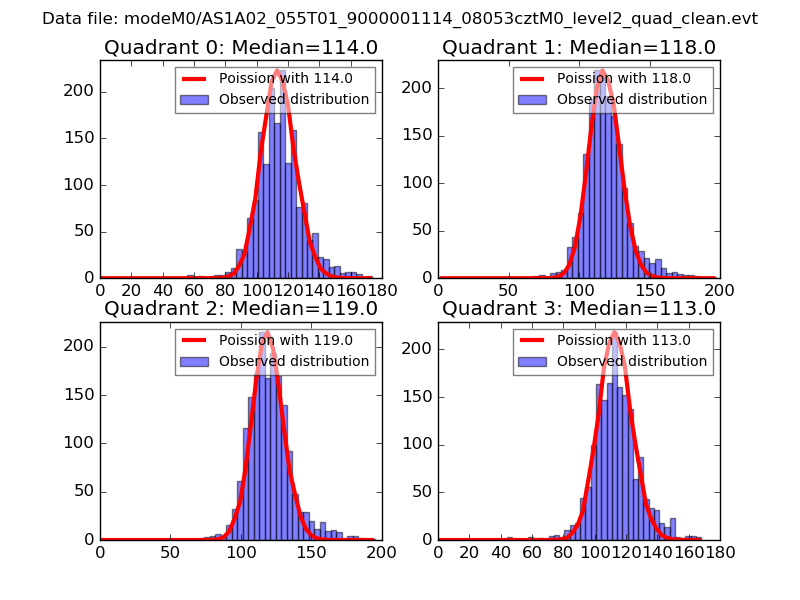 |
 |
| Quadrant-wise count rates Data is divided into 100 sec bins |
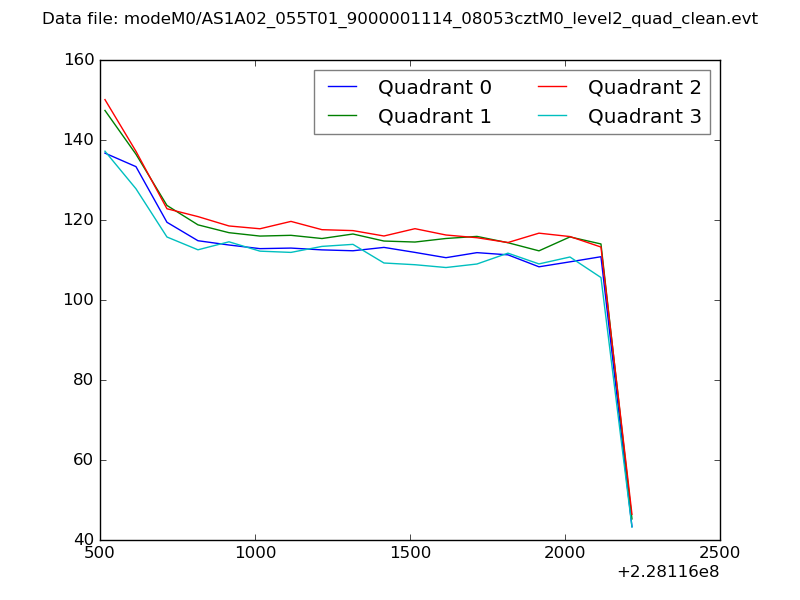 |
|
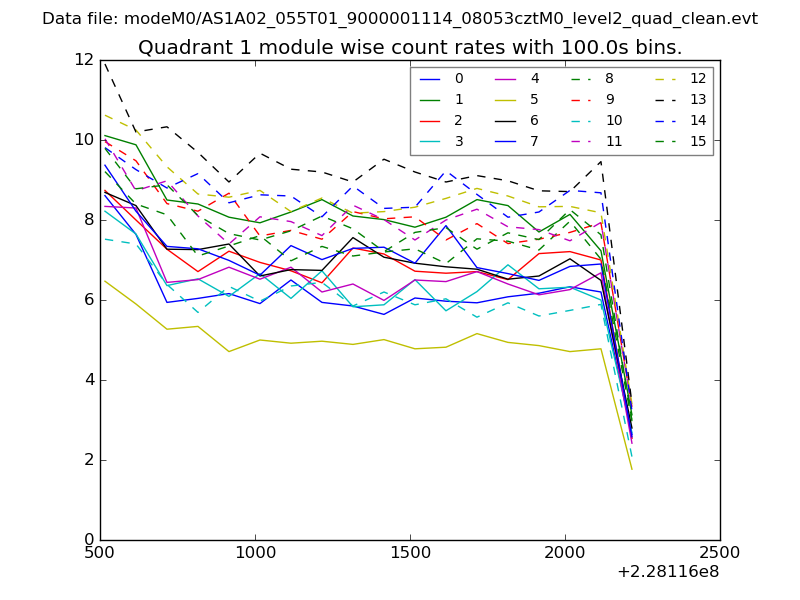
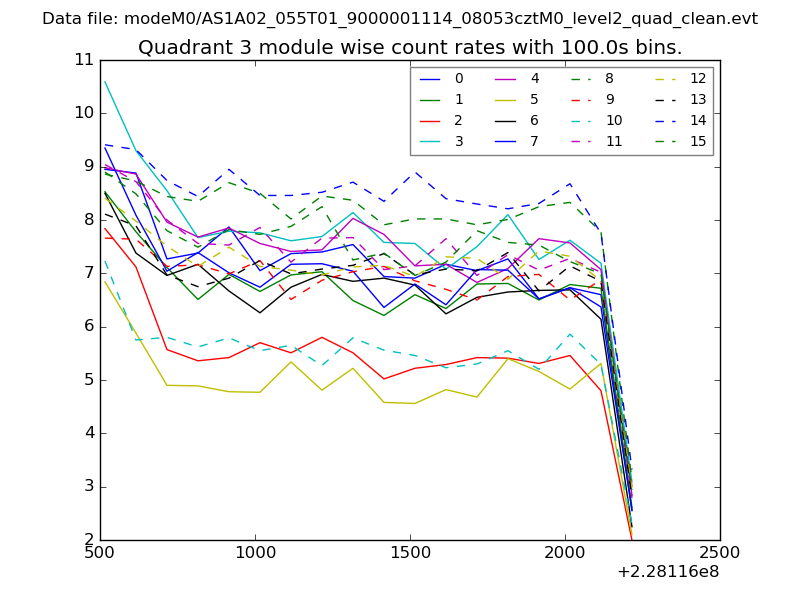
| Module-wise count rates for Quadrant A Data is divided into 100 sec bins |
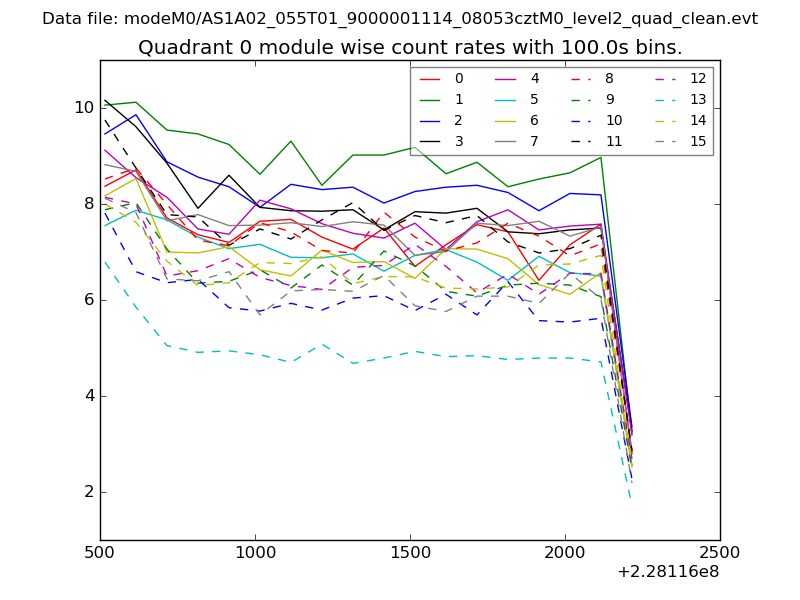 |
 |
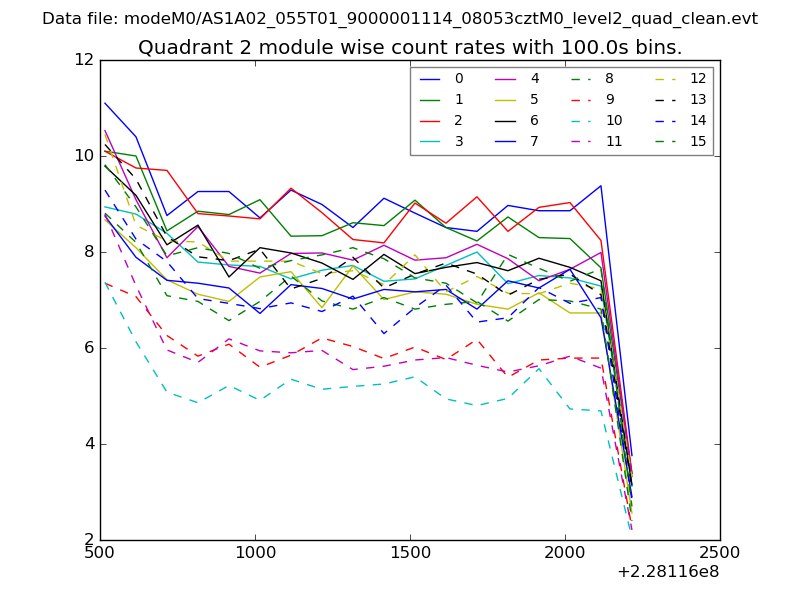
| Module-wise count rates for Quadrant B Data is divided into 100 sec bins |
 |
 |
| Module-wise count rates for Quadrant C Data is divided into 100 sec bins |
 |
 |
| Module-wise count rates for Quadrant D Data is divided into 100 sec bins |
 |
 |
| Parameter | Plot |
|---|---|
| CZT HV Monitor | 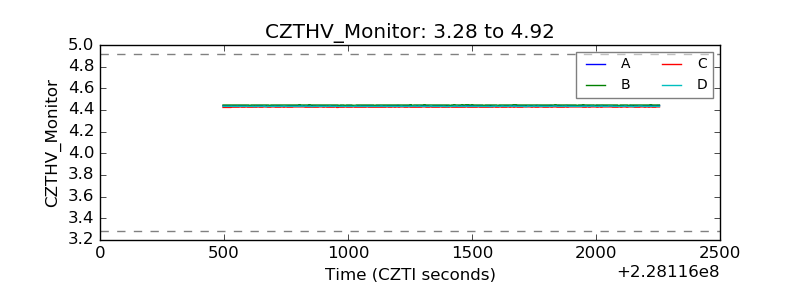 |
| D_VDD | 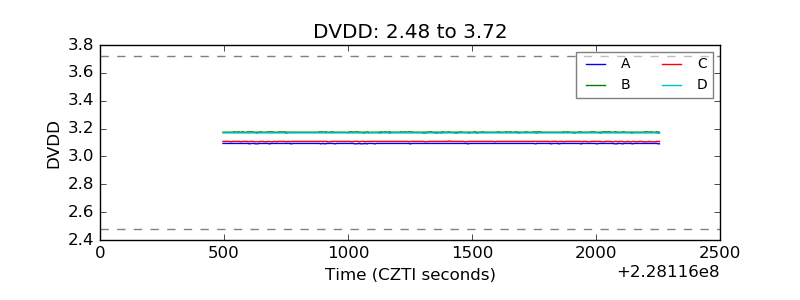 |
| Temperature 1 | 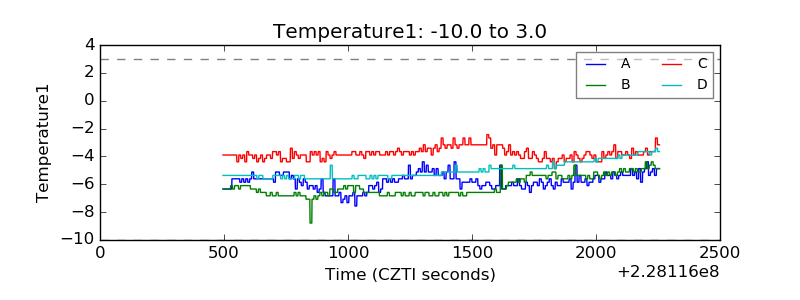 |
| Veto HV Monitor | 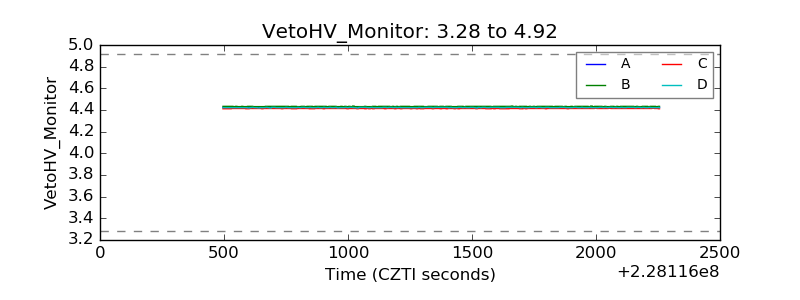 |
| Veto LLD | 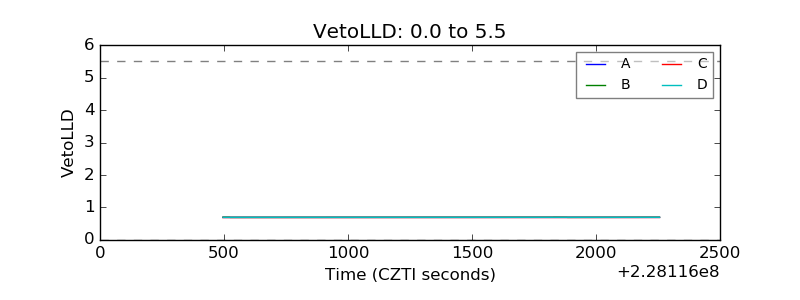 |
| Alpha Counter | 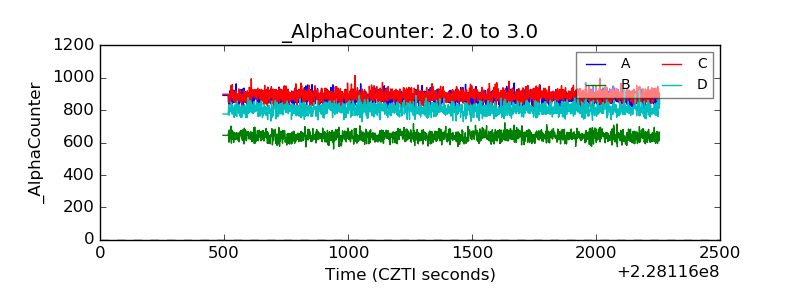 |
| _CPM_Rate | 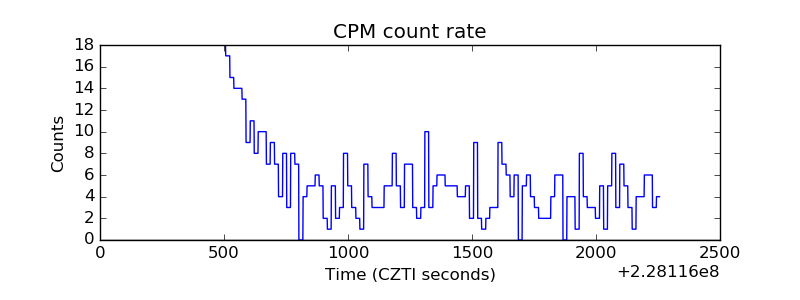 |
| CZT Counter | 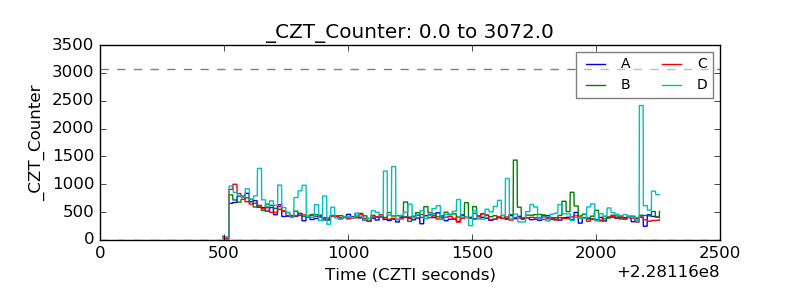 |
| +2.5 Volts monitor |  |
| +5 Volts monitor |  |
| _ROLL_ROT | 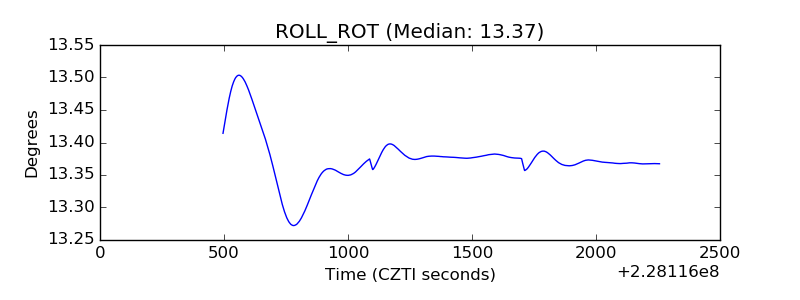 |
| _Roll_DEC | 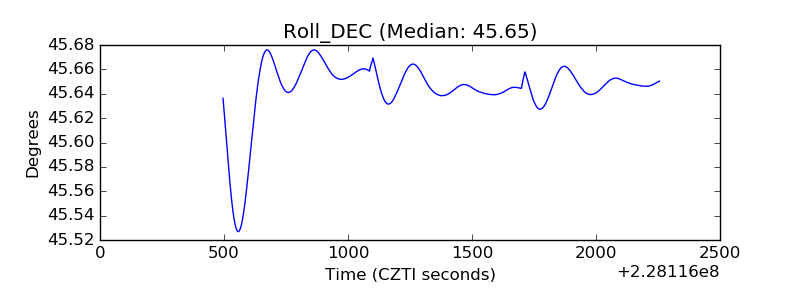 |
| _Roll_RA | 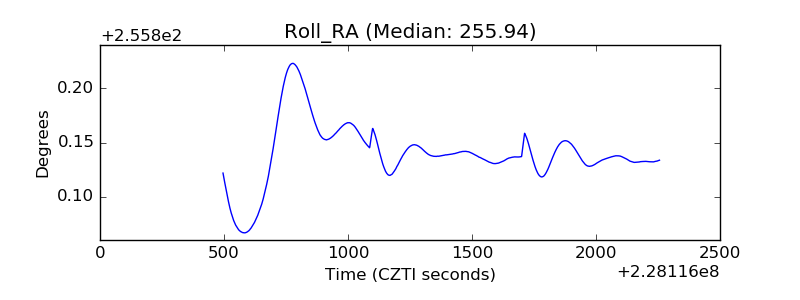 |
| Veto Counter | 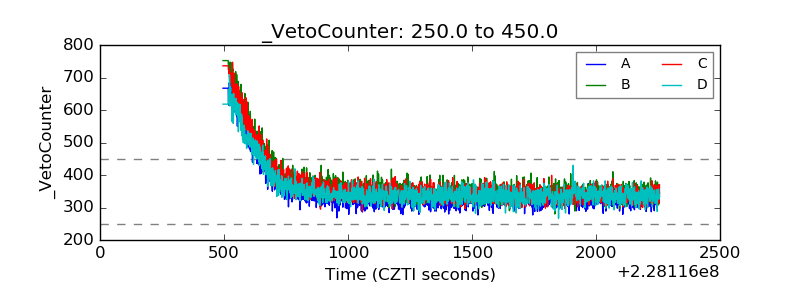 |