| Param | Original file | Final file |
|---|---|---|
| Filename | modeM0/AS1A02_055T01_9000001114_08055cztM0_level2.evt | modeM0/AS1A02_055T01_9000001114_08055cztM0_level2_quad_clean.evt |
| Size (bytes) | 850,095,360 | 161,847,360 |
| Size | 810.7 MB | 154.3 MB |
| Events in quadrant A | 5,791,007 | 989,275 |
| Events in quadrant B | 6,849,848 | 1,019,116 |
| Events in quadrant C | 5,609,786 | 1,029,096 |
| Events in quadrant D | 6,627,853 | 979,950 |
| Mode M0 | |||
|---|---|---|---|
| Quadrant | BADHDUFLAG | Total packets | Discarded packets |
| A | 0 | 26233 | 3 |
| B | 0 | 28768 | 2 |
| C | 0 | 25860 | 2 |
| D | 0 | 28676 | 2 |
| Mode M9 | |||
|---|---|---|---|
| Quadrant | BADHDUFLAG | Total packets | Discarded packets |
| A | 0 | 12 | 0 |
| B | 0 | 12 | 0 |
| C | 0 | 12 | 0 |
| D | 0 | 12 | 0 |
| Mode SS | |||
|---|---|---|---|
| Quadrant | BADHDUFLAG | Total packets | Discarded packets |
| A | 0 | 258 | 0 |
| B | 0 | 258 | 0 |
| C | 0 | 258 | 0 |
| D | 0 | 258 | 0 |
| Quadrant | Total seconds | Saturated seconds | Saturation percentage |
|---|---|---|---|
| A | 12800 | 120 | 0.937500% |
| B | 12800 | 262 | 2.046875% |
| C | 12800 | 66 | 0.515625% |
| D | 12800 | 186 | 1.453125% |
Noise dominated data is calculated using 1-second bins in cleaned event files. If a bin has >2000 counts, and if more than 50% of those come from <1% of pixels, then it is considered to be noise-dominated and hence unusable.
| Quadrant | # 1 sec bins | Bins with >0 counts | Bins with >2000 counts | High rate bins dominated by noise | Noise dominated (total time) | Noise dominated (detector-on time) | Marked lightcurve |
|---|---|---|---|---|---|---|---|
| A | 13925 | 12803 | 5 | 5 | 0.04% | 0.04% | 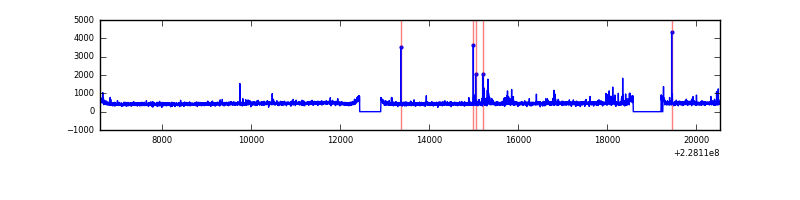 |
| B | 13925 | 12803 | 98 | 98 | 0.70% | 0.77% | 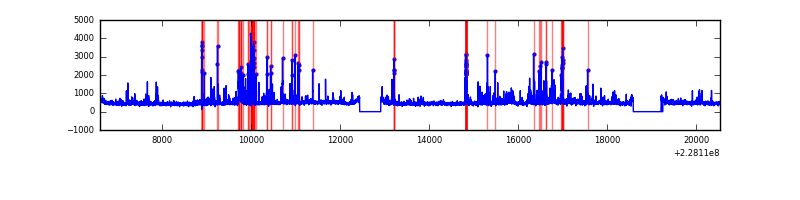 |
| C | 13925 | 12803 | 0 | 0 | 0.00% | 0.00% | 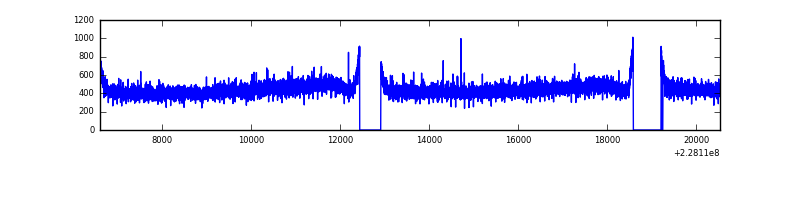 |
| D | 13925 | 12803 | 85 | 85 | 0.61% | 0.66% | 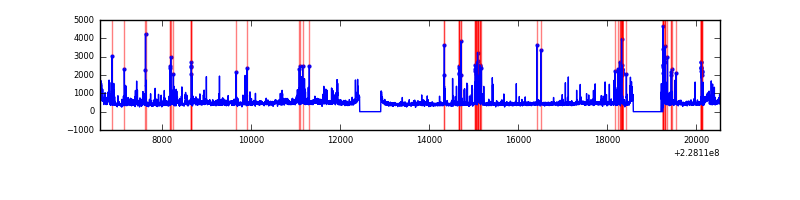 |
Top three noisy pixels from each quadrant. If the there are fewer than three noisy pixels in the level2.evt file, extra rows are filled as -1
| Pixel properties | Quadrant properties | ||||||
|---|---|---|---|---|---|---|---|
| Quadrant | DetID | PixID | Counts | Sigma | Mean | Median | Sigma |
| A | 4 | 2 | 154287 | 509.37 | 1459 | 1422 | 300.1 |
| A | 15 | 234 | 14353 | 43.09 | 1459 | 1422 | 300.1 |
| A | 0 | 226 | 13800 | 41.24 | 1459 | 1422 | 300.1 |
| B | 4 | 239 | 598463 | 2144.6 | 1472 | 1437 | 278.4 |
| B | 4 | 81 | 215041 | 767.29 | 1472 | 1437 | 278.4 |
| B | 10 | 16 | 68222 | 239.9 | 1472 | 1437 | 278.4 |
| C | 1 | 16 | 34409 | 99.62 | 1429 | 1431 | 331.0 |
| C | 13 | 61 | 10739 | 28.12 | 1429 | 1431 | 331.0 |
| C | 8 | 222 | 6461 | 15.19 | 1429 | 1431 | 331.0 |
| D | 13 | 105 | 399025 | 1075.49 | 1406 | 1370 | 369.7 |
| D | 1 | 52 | 365807 | 985.65 | 1406 | 1370 | 369.7 |
| D | 4 | 95 | 162130 | 434.79 | 1406 | 1370 | 369.7 |
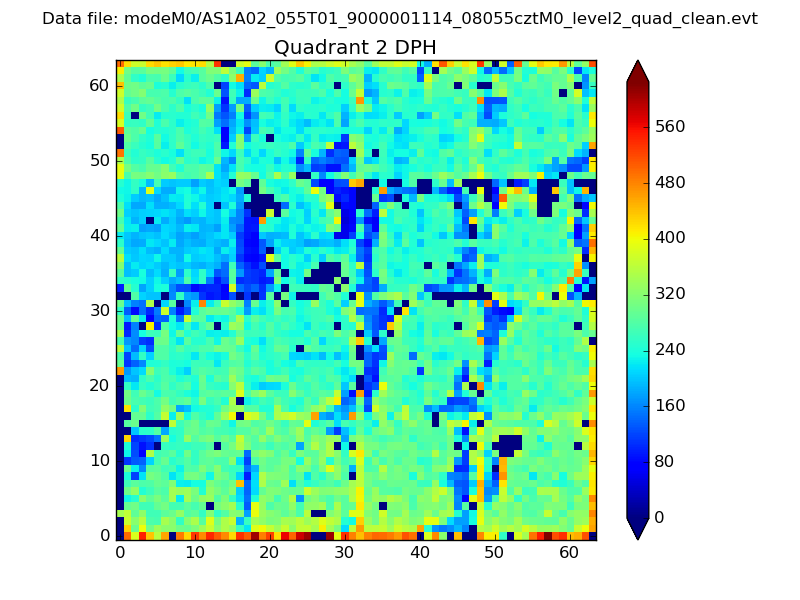
Histogram calculated using DETX and DETY for each event in the final _common_clean file
| Quadrant A | 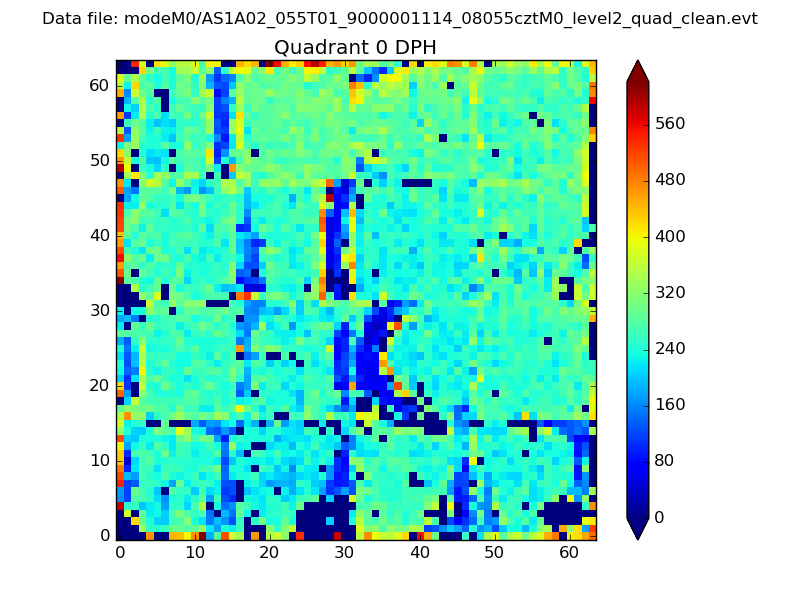 |
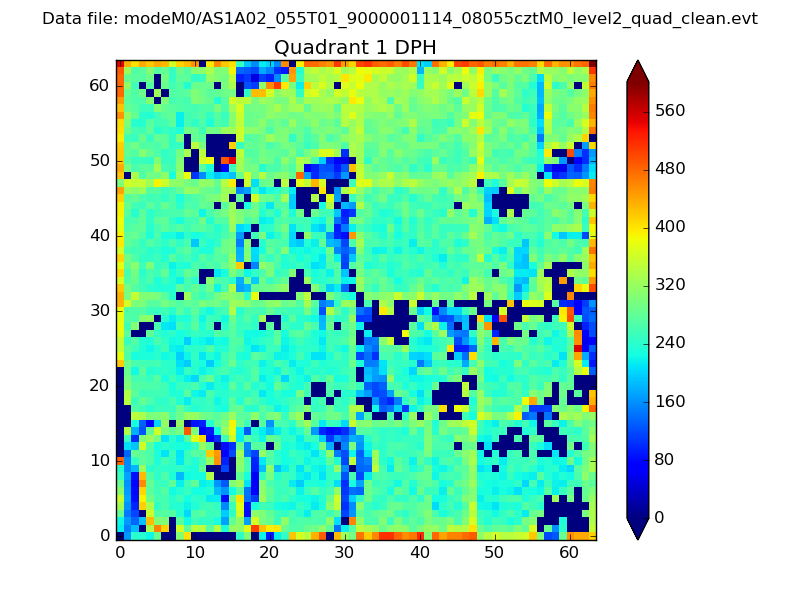 |
Quadrant B |
|---|---|---|---|
| Quadrant D | 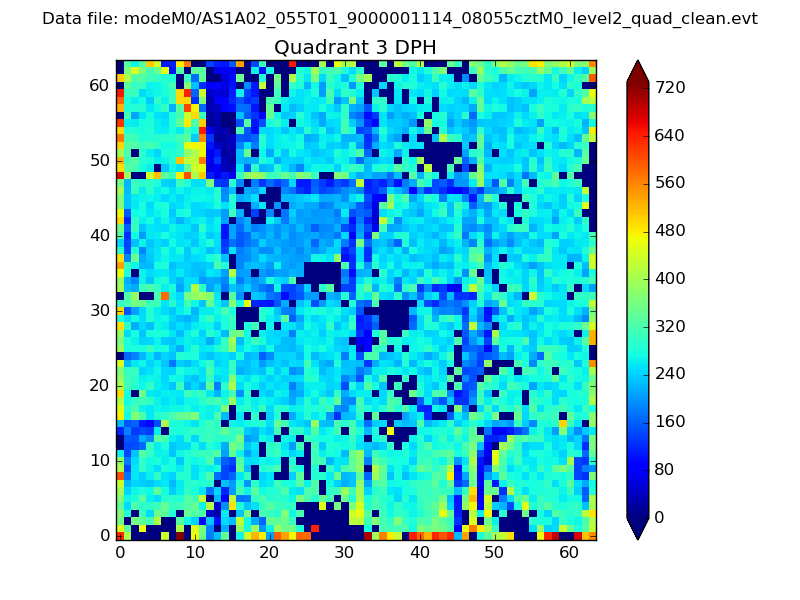 |
 |
Quadrant C |
| Plot type | Count rate plots | Images |
|---|---|---|
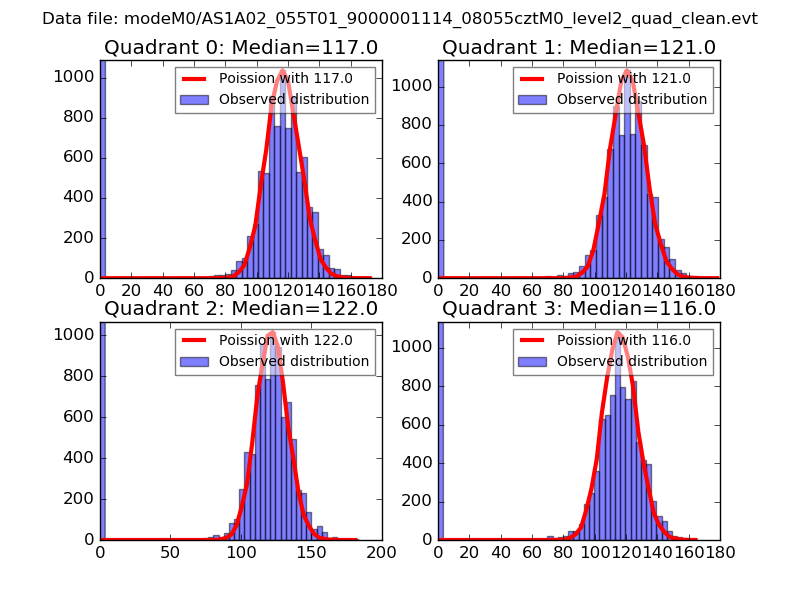
| Comparison with Poisson distribution Blue bars denote a histogram of data divided into 1 sec bins. Red curve is a Poisson curve with rate = median count rate of data. |
 |
 |
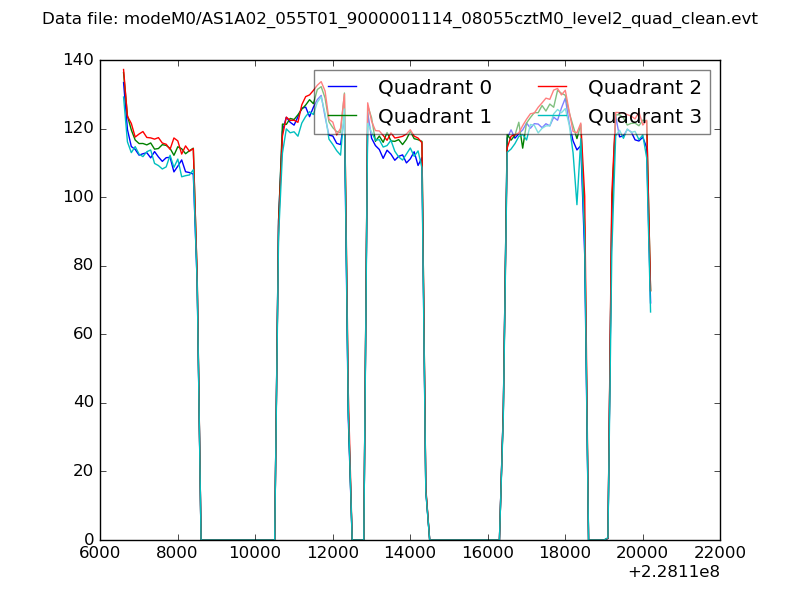
| Quadrant-wise count rates Data is divided into 100 sec bins |
 |
|
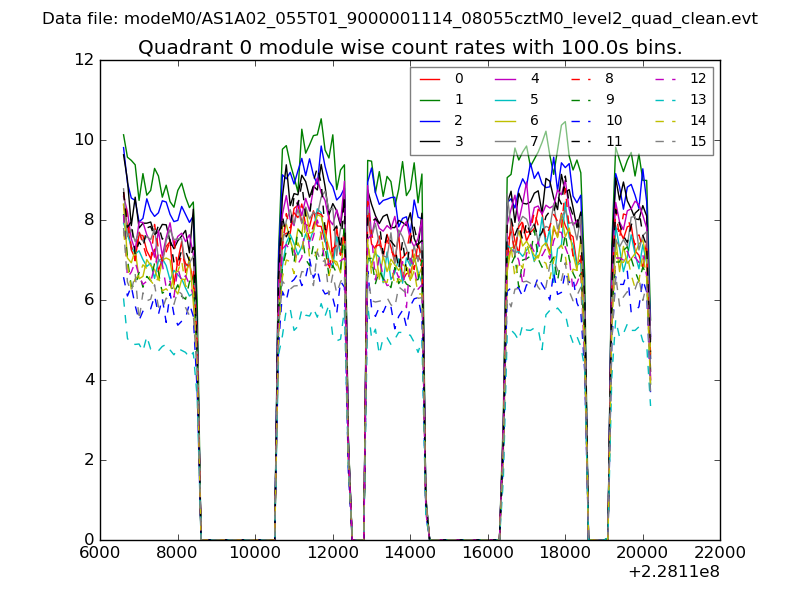
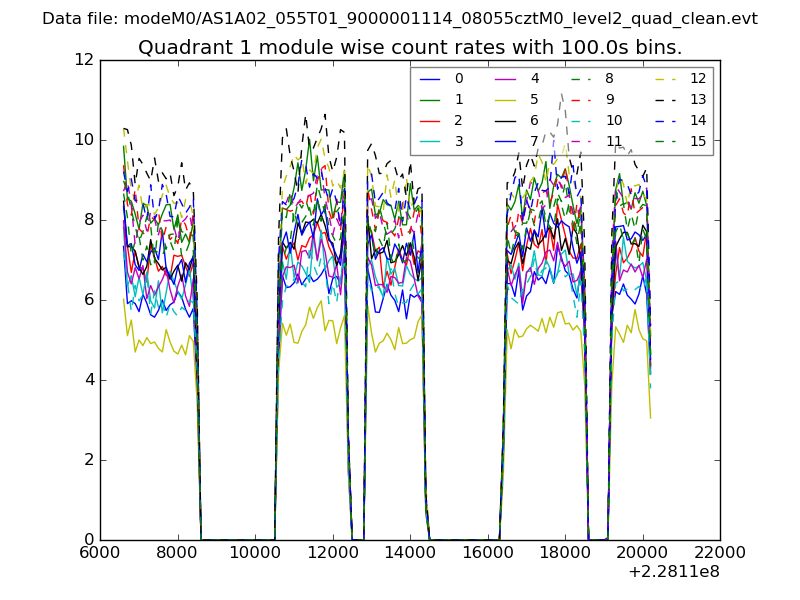
| Module-wise count rates for Quadrant A Data is divided into 100 sec bins |
 |
 |
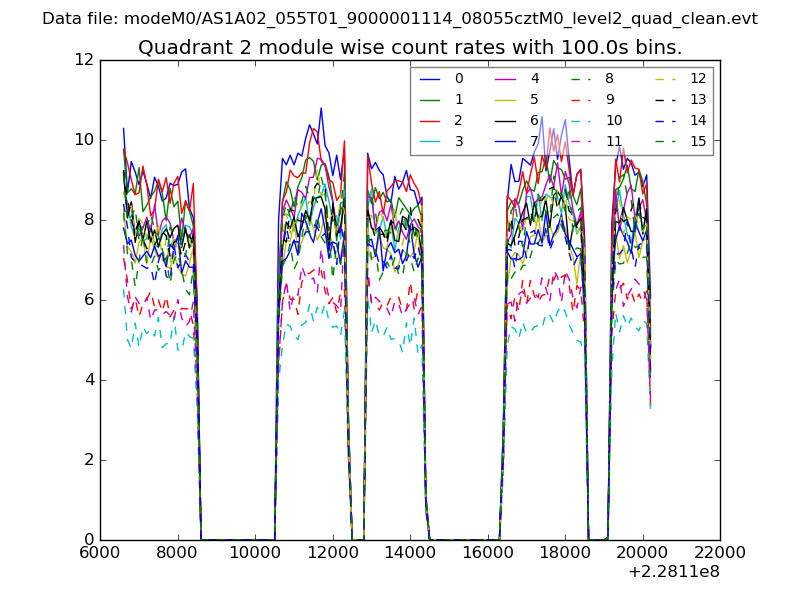
| Module-wise count rates for Quadrant B Data is divided into 100 sec bins |
 |
 |
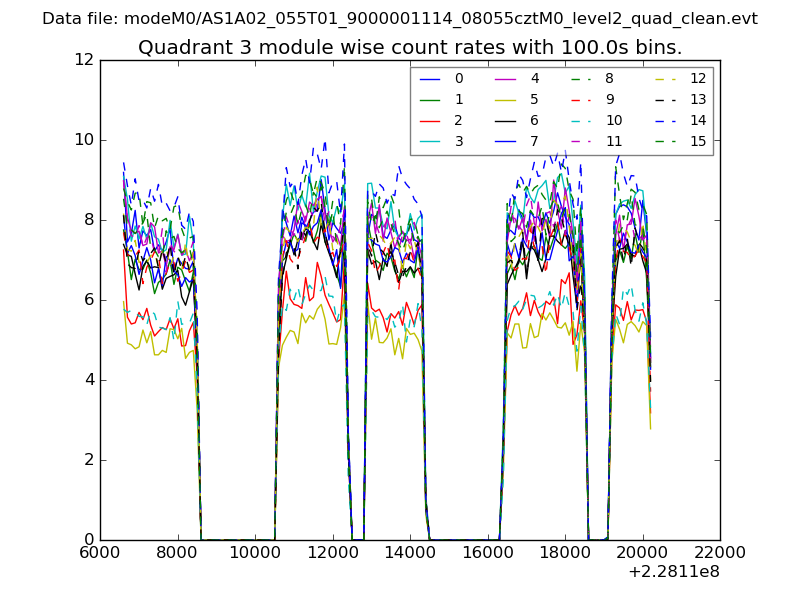
| Module-wise count rates for Quadrant C Data is divided into 100 sec bins |
 |
 |
| Module-wise count rates for Quadrant D Data is divided into 100 sec bins |
 |
 |
| Parameter | Plot |
|---|---|
| CZT HV Monitor | 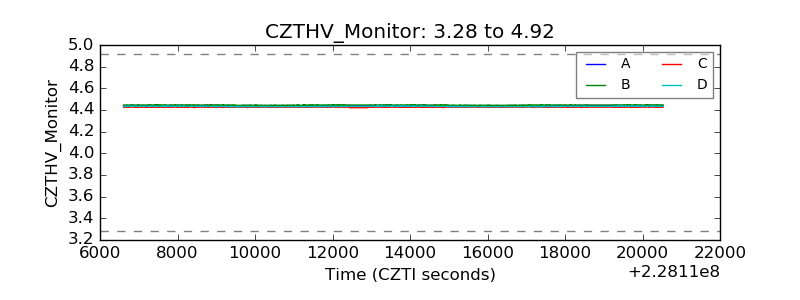 |
| D_VDD | 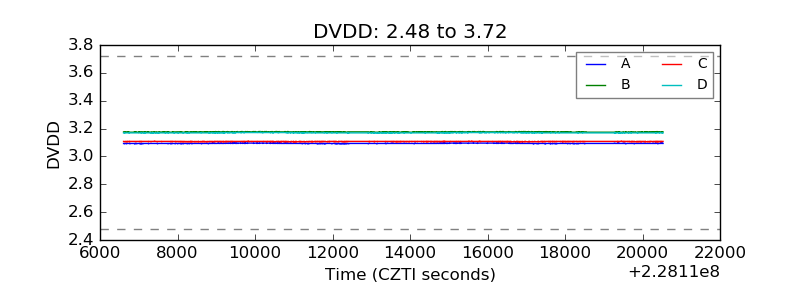 |
| Temperature 1 | 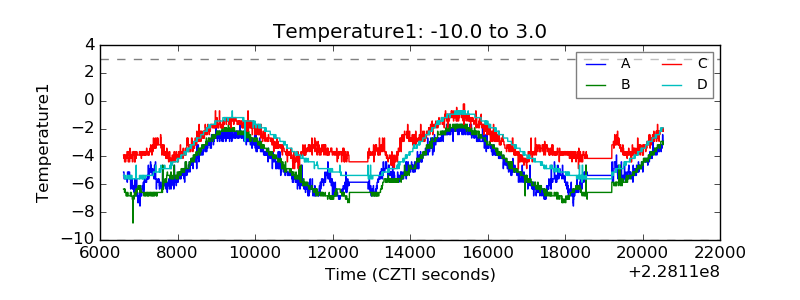 |
| Veto HV Monitor | 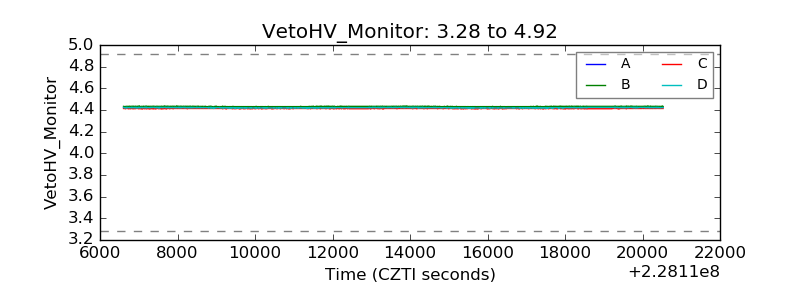 |
| Veto LLD | 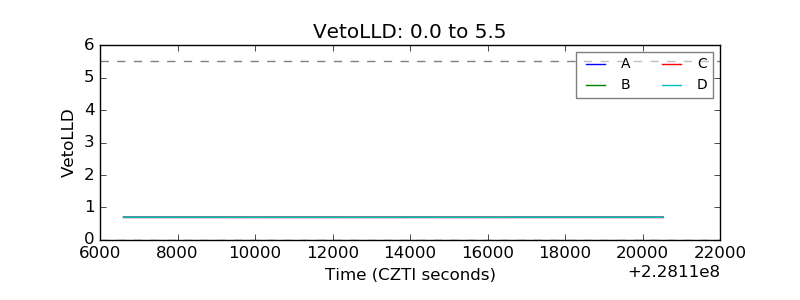 |
| Alpha Counter | 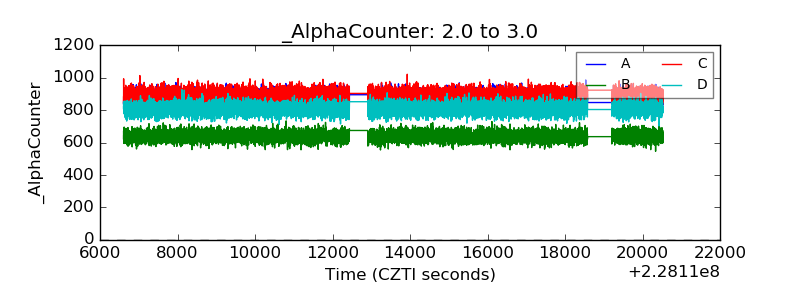 |
| _CPM_Rate | 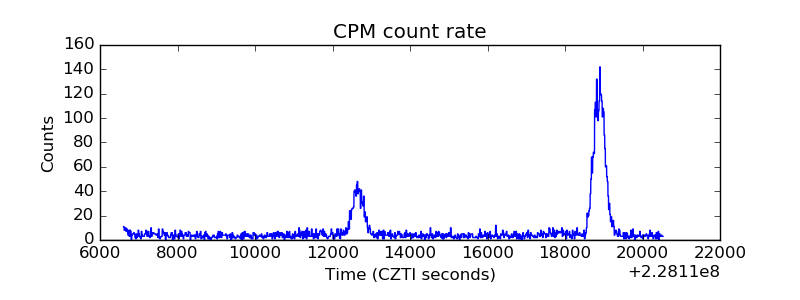 |
| CZT Counter | 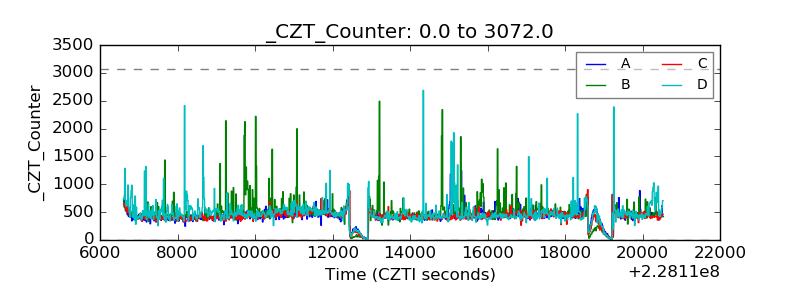 |
| +2.5 Volts monitor |  |
| +5 Volts monitor |  |
| _ROLL_ROT | 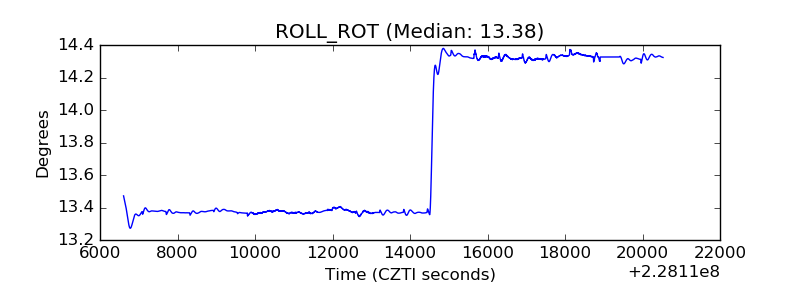 |
| _Roll_DEC |  |
| _Roll_RA | 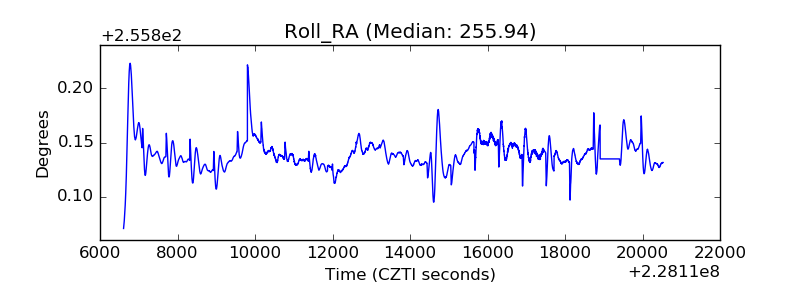 |
| Veto Counter | 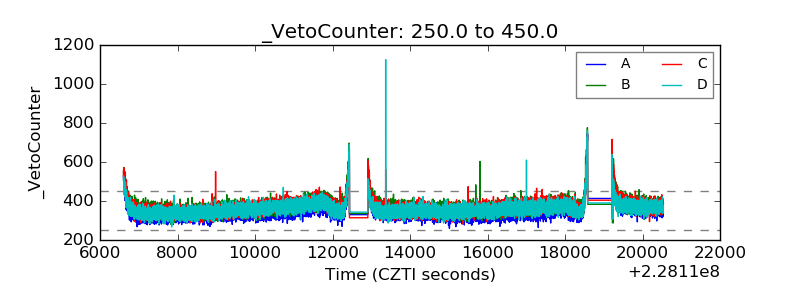 |