| Param | Original file | Final file |
|---|---|---|
| Filename | modeM0/AS1A02_055T01_9000001114_08056cztM0_level2.evt | modeM0/AS1A02_055T01_9000001114_08056cztM0_level2_quad_clean.evt |
| Size (bytes) | 488,099,520 | 80,138,880 |
| Size | 465.5 MB | 76.4 MB |
| Events in quadrant A | 3,598,106 | 480,035 |
| Events in quadrant B | 3,660,365 | 494,771 |
| Events in quadrant C | 3,074,709 | 499,721 |
| Events in quadrant D | 3,982,092 | 473,344 |
| Mode M0 | |||
|---|---|---|---|
| Quadrant | BADHDUFLAG | Total packets | Discarded packets |
| A | 0 | 15271 | 3 |
| B | 0 | 15232 | 2 |
| C | 0 | 13902 | 2 |
| D | 0 | 16548 | 2 |
| Mode M9 | |||
|---|---|---|---|
| Quadrant | BADHDUFLAG | Total packets | Discarded packets |
| A | 0 | 10 | 0 |
| B | 0 | 10 | 0 |
| C | 0 | 10 | 0 |
| D | 0 | 11 | 0 |
| Mode SS | |||
|---|---|---|---|
| Quadrant | BADHDUFLAG | Total packets | Discarded packets |
| A | 0 | 140 | 0 |
| B | 0 | 140 | 0 |
| C | 0 | 140 | 0 |
| D | 0 | 140 | 0 |
| Quadrant | Total seconds | Saturated seconds | Saturation percentage |
|---|---|---|---|
| A | 6869 | 157 | 2.285631% |
| B | 6869 | 118 | 1.717863% |
| C | 6869 | 66 | 0.960839% |
| D | 6869 | 228 | 3.319260% |
Noise dominated data is calculated using 1-second bins in cleaned event files. If a bin has >2000 counts, and if more than 50% of those come from <1% of pixels, then it is considered to be noise-dominated and hence unusable.
| Quadrant | # 1 sec bins | Bins with >0 counts | Bins with >2000 counts | High rate bins dominated by noise | Noise dominated (total time) | Noise dominated (detector-on time) | Marked lightcurve |
|---|---|---|---|---|---|---|---|
| A | 7709 | 6871 | 60 | 60 | 0.78% | 0.87% | 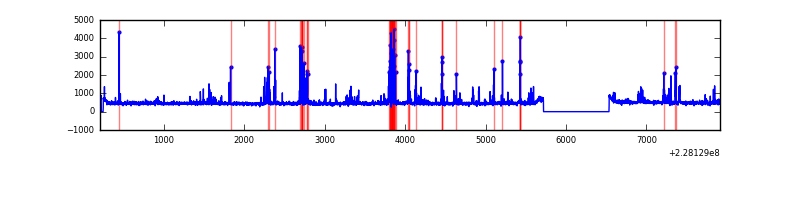 |
| B | 7709 | 6871 | 19 | 19 | 0.25% | 0.28% | 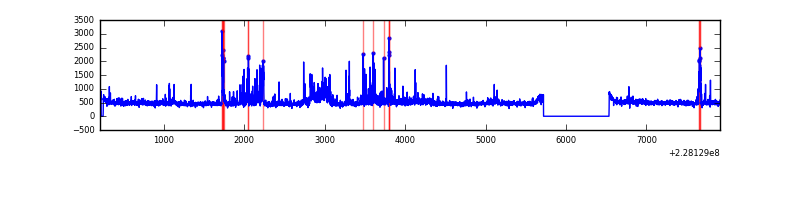 |
| C | 7709 | 6871 | 0 | 0 | 0.00% | 0.00% | 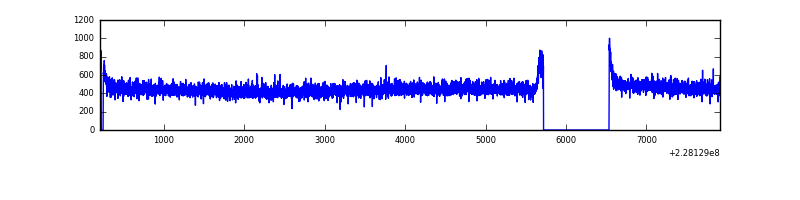 |
| D | 7709 | 6871 | 137 | 137 | 1.78% | 1.99% | 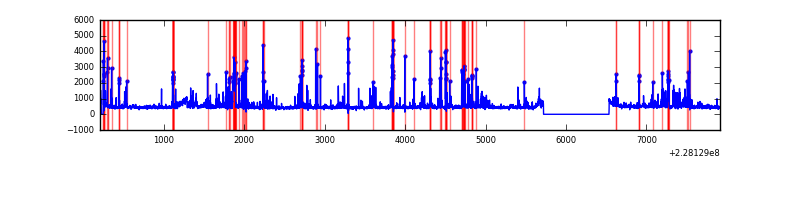 |
Top three noisy pixels from each quadrant. If the there are fewer than three noisy pixels in the level2.evt file, extra rows are filled as -1
| Pixel properties | Quadrant properties | ||||||
|---|---|---|---|---|---|---|---|
| Quadrant | DetID | PixID | Counts | Sigma | Mean | Median | Sigma |
| A | 4 | 2 | 497136 | 3003.55 | 804 | 785 | 165.3 |
| A | 0 | 226 | 7505 | 40.66 | 804 | 785 | 165.3 |
| A | 12 | 194 | 7338 | 39.65 | 804 | 785 | 165.3 |
| B | 4 | 239 | 208288 | 1329.62 | 808 | 790 | 156.1 |
| B | 0 | 213 | 114511 | 728.71 | 808 | 790 | 156.1 |
| B | 11 | 51 | 68200 | 431.96 | 808 | 790 | 156.1 |
| C | 1 | 16 | 18846 | 99.14 | 783 | 785 | 182.2 |
| C | 13 | 61 | 6064 | 28.98 | 783 | 785 | 182.2 |
| C | 8 | 222 | 2368 | 8.69 | 783 | 785 | 182.2 |
| D | 1 | 52 | 392709 | 1914.74 | 769 | 750 | 204.7 |
| D | 13 | 105 | 270130 | 1315.93 | 769 | 750 | 204.7 |
| D | 4 | 95 | 182829 | 889.46 | 769 | 750 | 204.7 |
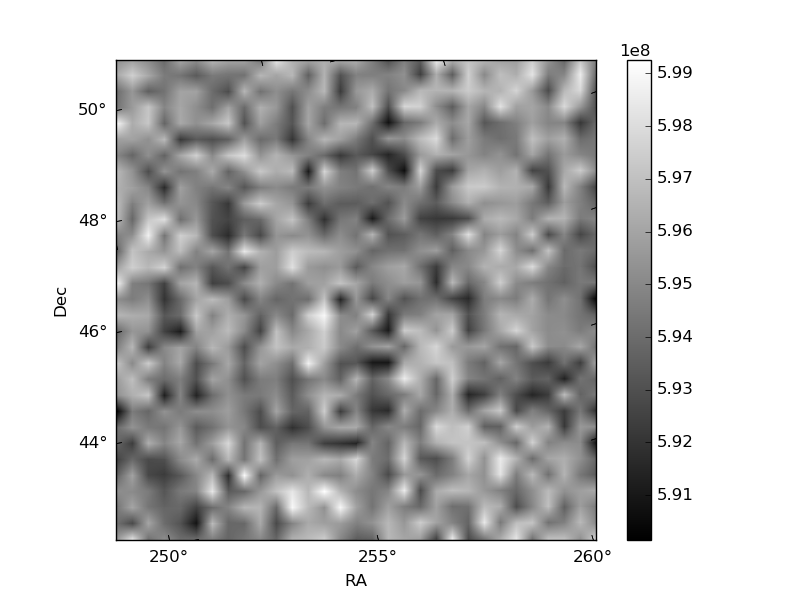
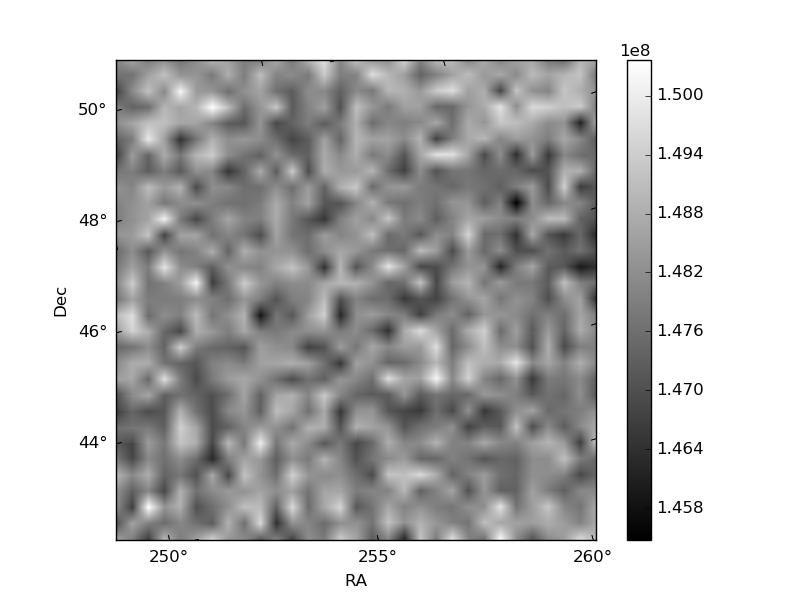
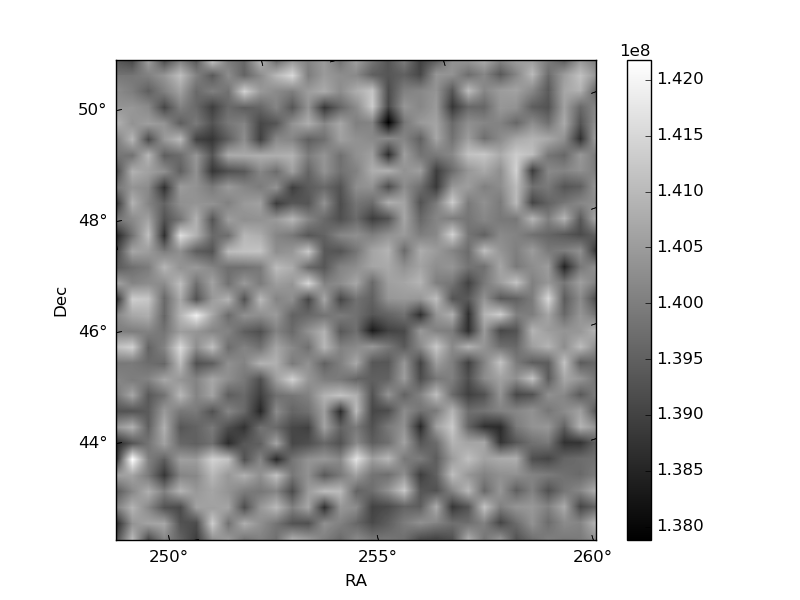
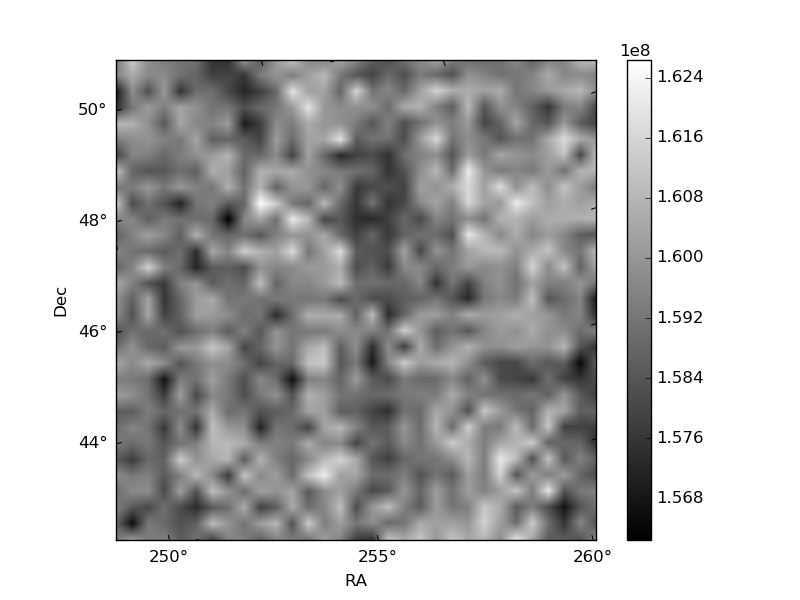
Histogram calculated using DETX and DETY for each event in the final _common_clean file
| Quadrant A | 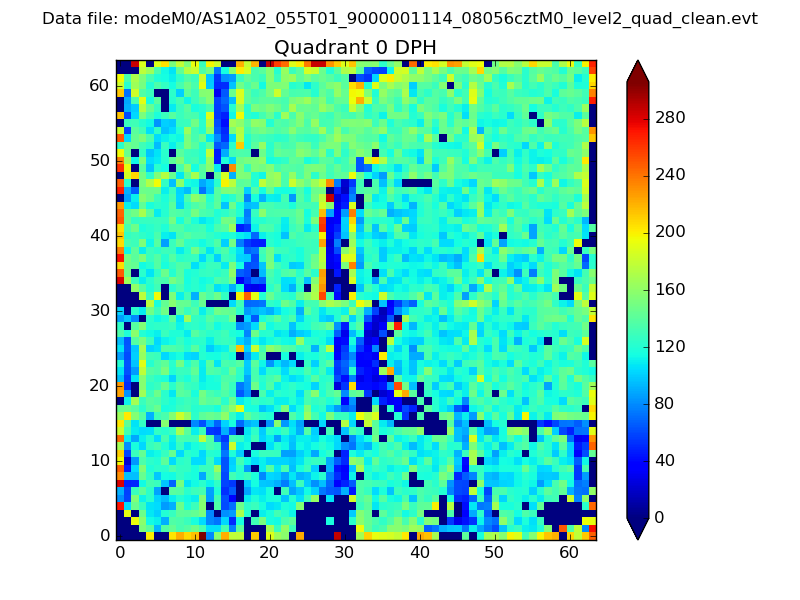 |
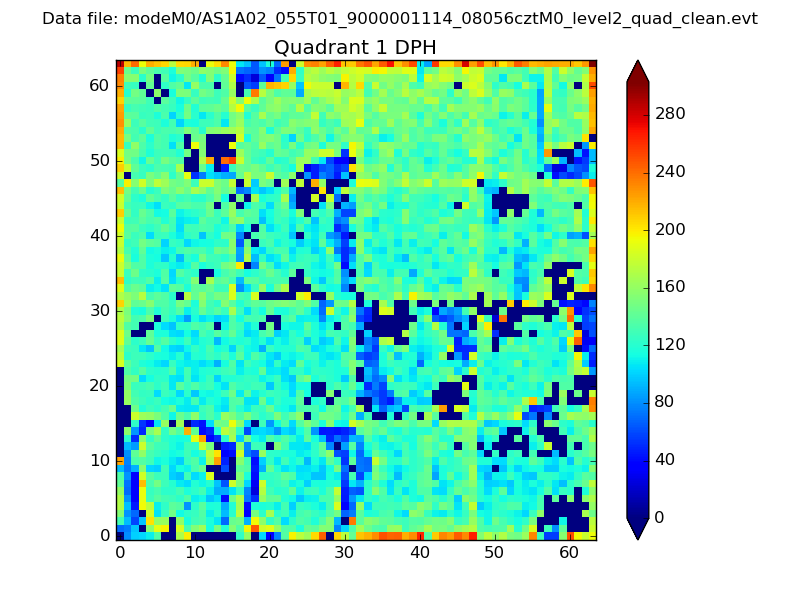 |
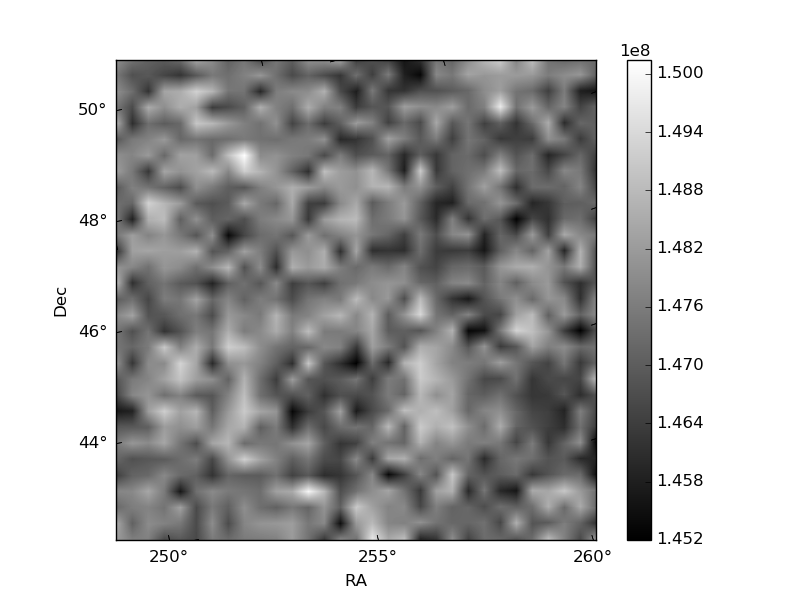
Quadrant B |
|---|---|---|---|
| Quadrant D | 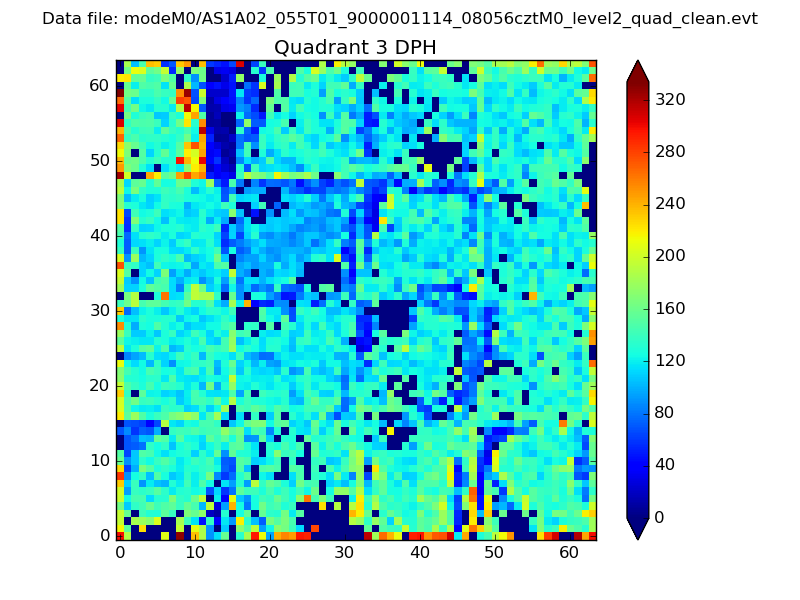 |
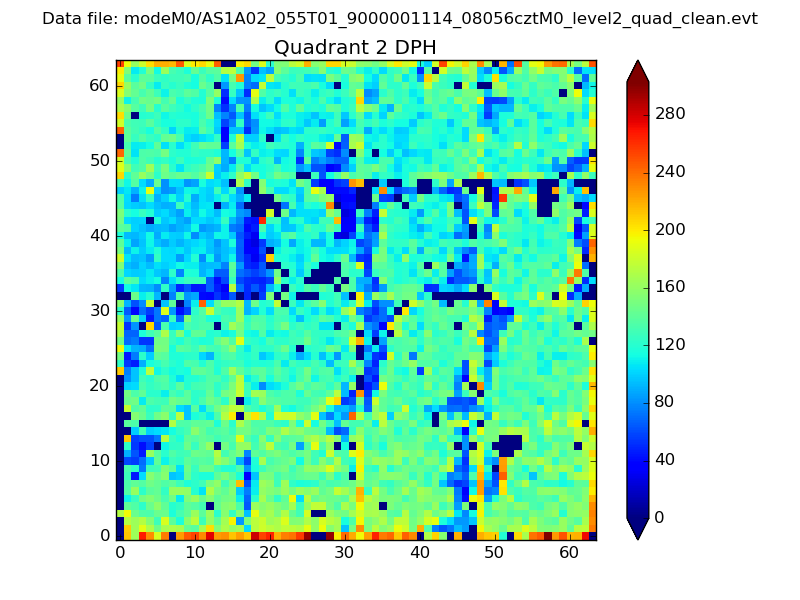 |
Quadrant C |
| Plot type | Count rate plots | Images |
|---|---|---|
| Comparison with Poisson distribution Blue bars denote a histogram of data divided into 1 sec bins. Red curve is a Poisson curve with rate = median count rate of data. |
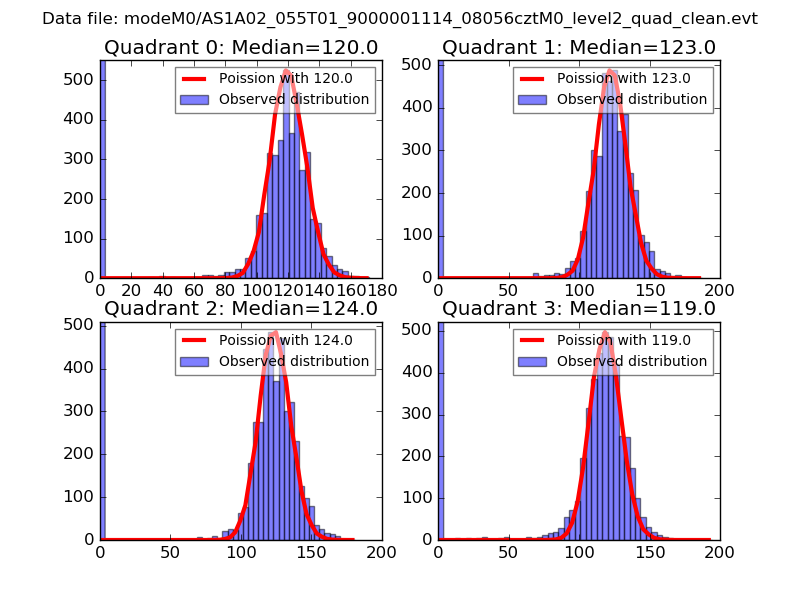 |
 |
| Quadrant-wise count rates Data is divided into 100 sec bins |
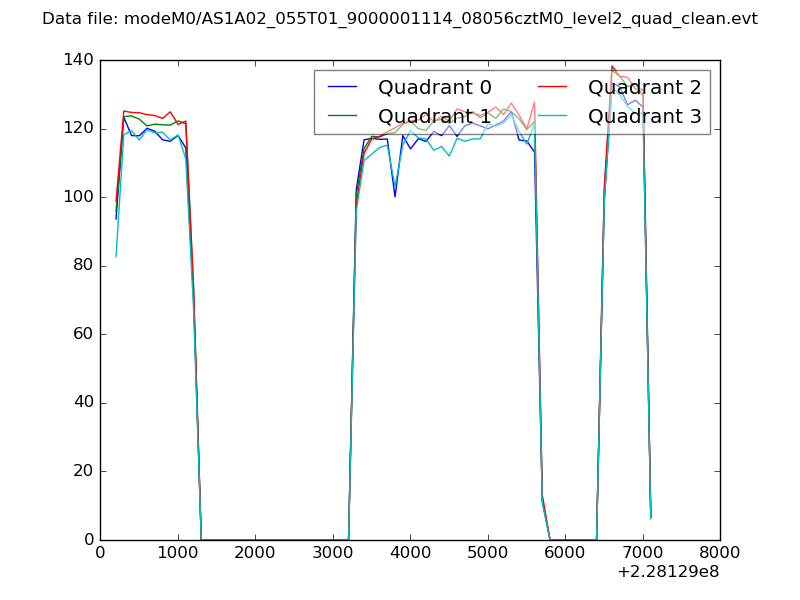 |
|
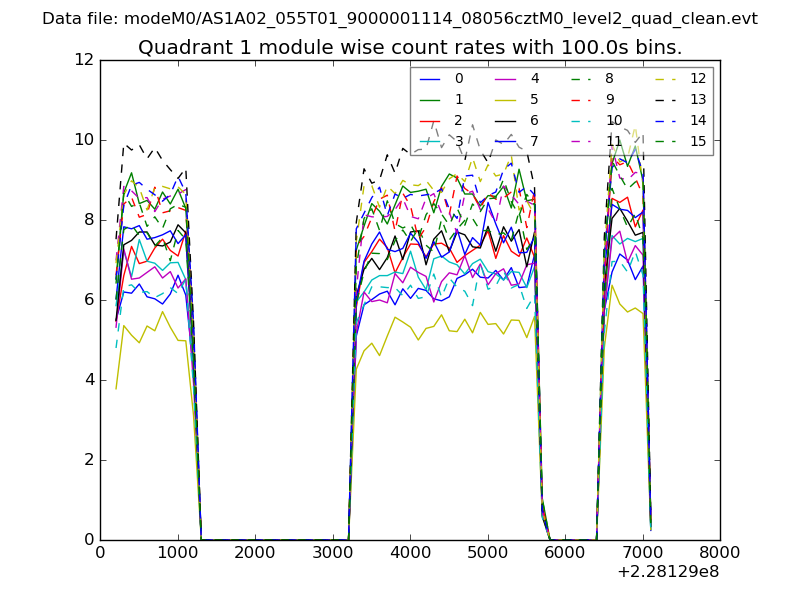
| Module-wise count rates for Quadrant A Data is divided into 100 sec bins |
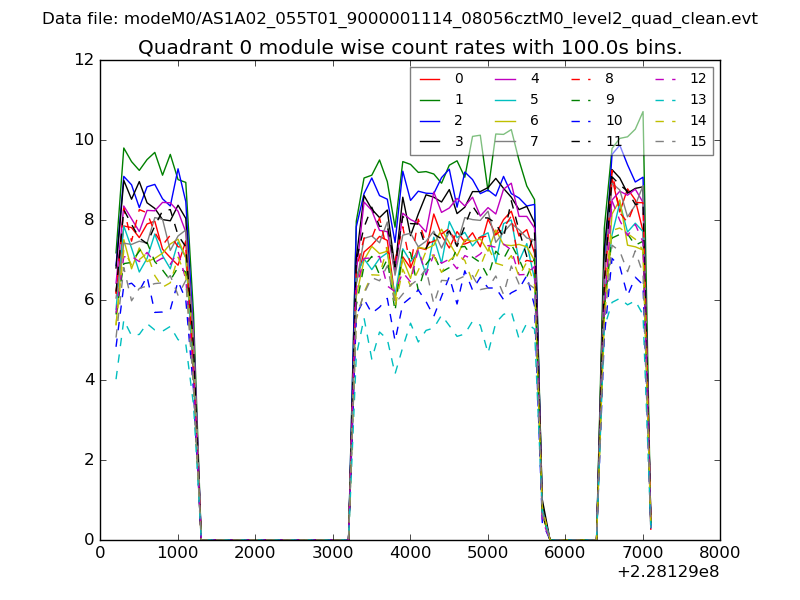 |
 |
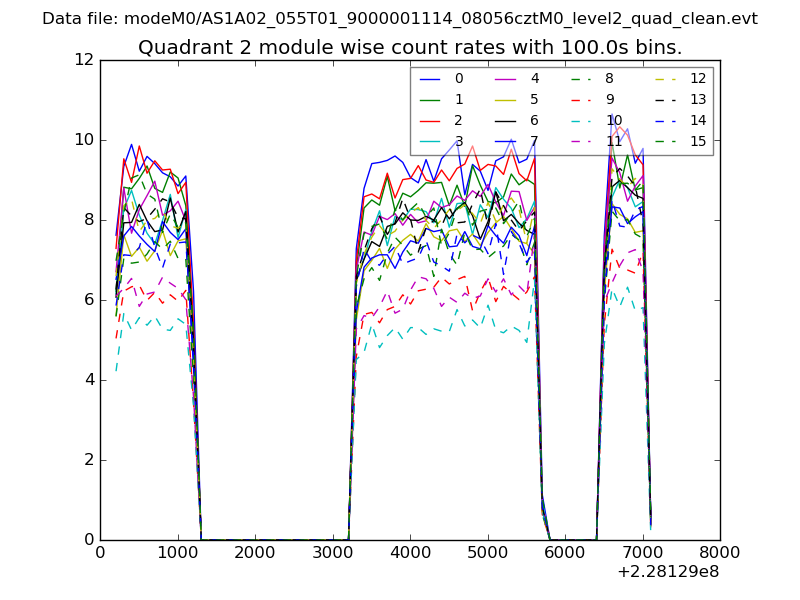
| Module-wise count rates for Quadrant B Data is divided into 100 sec bins |
 |
 |
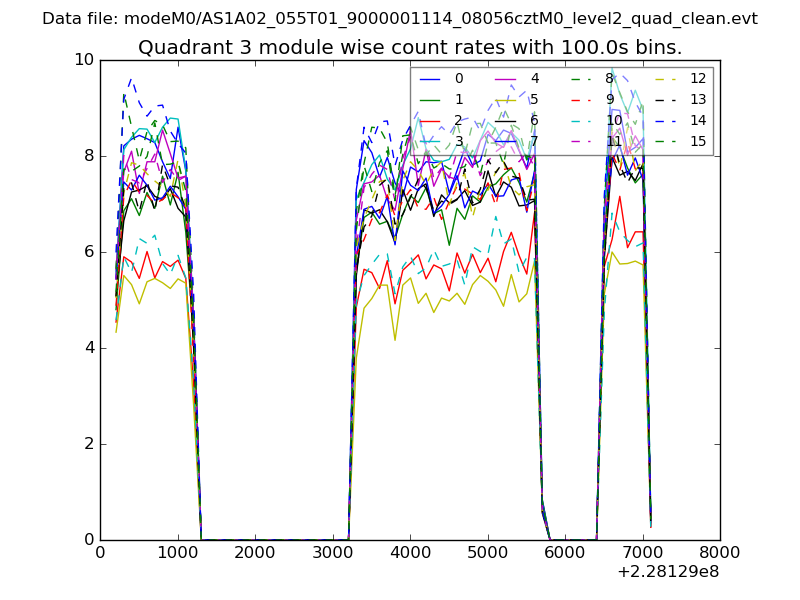
| Module-wise count rates for Quadrant C Data is divided into 100 sec bins |
 |
 |
| Module-wise count rates for Quadrant D Data is divided into 100 sec bins |
 |
 |
| Parameter | Plot |
|---|---|
| CZT HV Monitor | 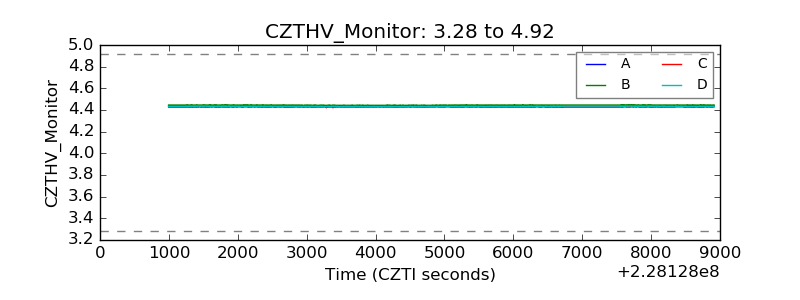 |
| D_VDD | 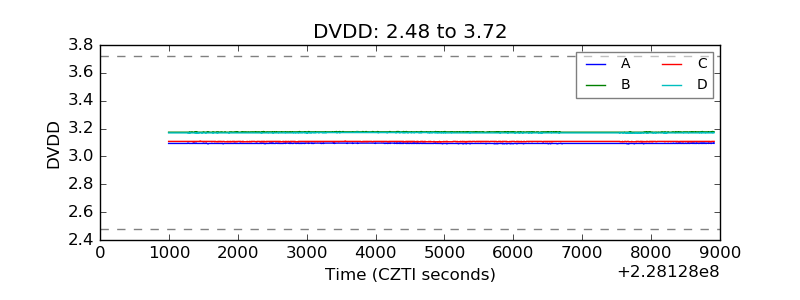 |
| Temperature 1 |  |
| Veto HV Monitor | 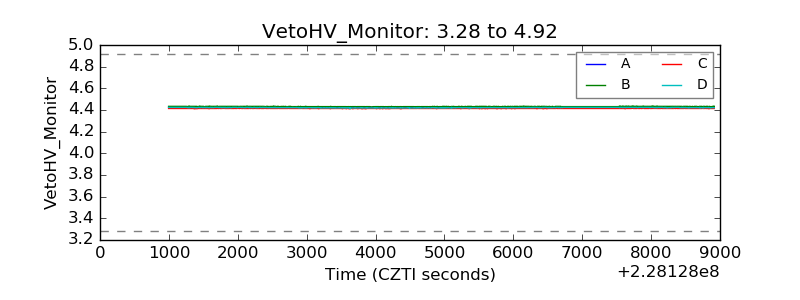 |
| Veto LLD | 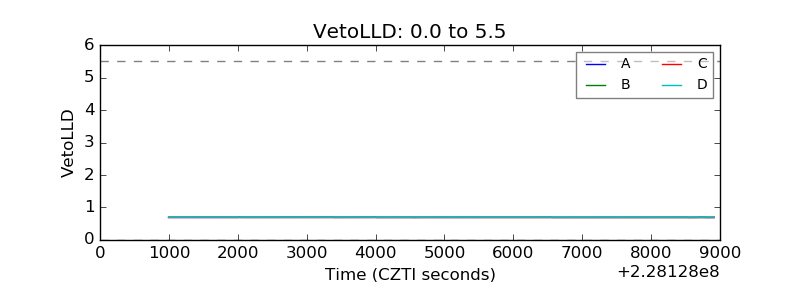 |
| Alpha Counter | 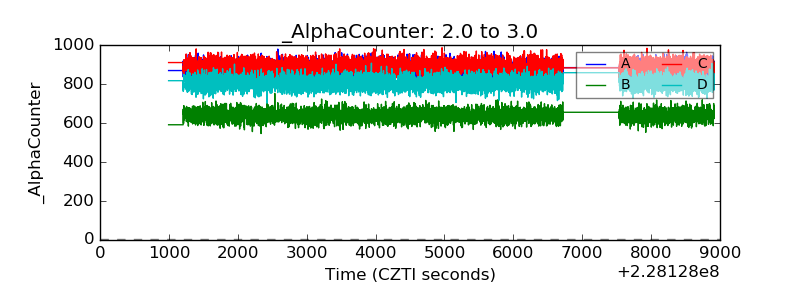 |
| _CPM_Rate | 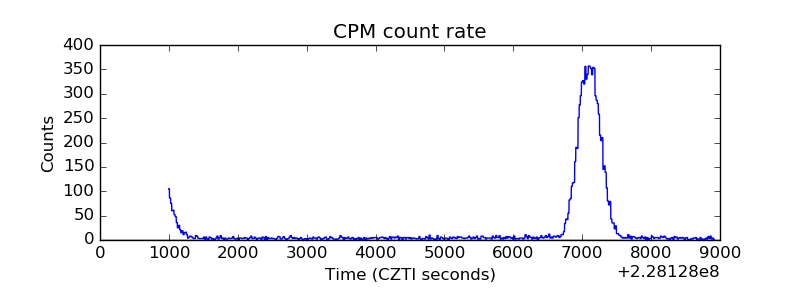 |
| CZT Counter | 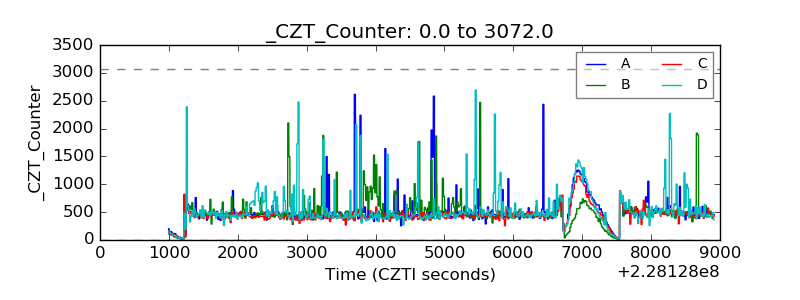 |
| +2.5 Volts monitor |  |
| +5 Volts monitor |  |
| _ROLL_ROT | 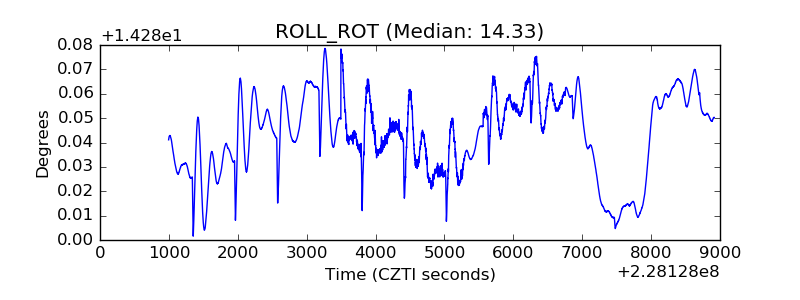 |
| _Roll_DEC | 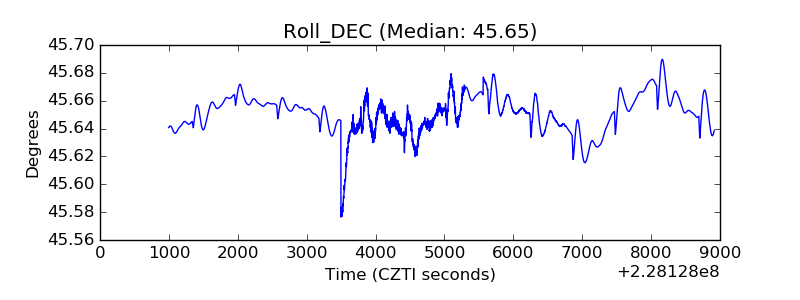 |
| _Roll_RA | 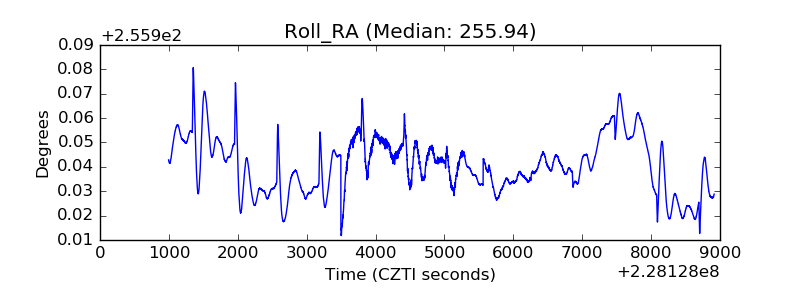 |
| Veto Counter | 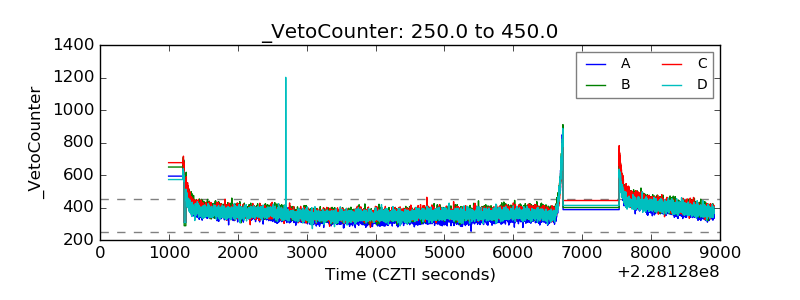 |