| Param | Original file | Final file |
|---|---|---|
| Filename | modeM0/AS1A02_055T01_9000001114_08059cztM0_level2.evt | modeM0/AS1A02_055T01_9000001114_08059cztM0_level2_quad_clean.evt |
| Size (bytes) | 1,293,739,200 | 181,699,200 |
| Size | 1.2 GB | 173.3 MB |
| Events in quadrant A | 8,617,752 | 1,103,817 |
| Events in quadrant B | 9,312,834 | 1,130,086 |
| Events in quadrant C | 7,673,372 | 1,143,253 |
| Events in quadrant D | 12,437,405 | 962,342 |
| Mode M0 | |||
|---|---|---|---|
| Quadrant | BADHDUFLAG | Total packets | Discarded packets |
| A | 0 | 37000 | 4 |
| B | 0 | 38616 | 3 |
| C | 0 | 34367 | 3 |
| D | 0 | 48532 | 3 |
| Mode M9 | |||
|---|---|---|---|
| Quadrant | BADHDUFLAG | Total packets | Discarded packets |
| A | 0 | 30 | 0 |
| B | 0 | 30 | 0 |
| C | 0 | 30 | 0 |
| D | 0 | 30 | 0 |
| Mode SS | |||
|---|---|---|---|
| Quadrant | BADHDUFLAG | Total packets | Discarded packets |
| A | 0 | 344 | 0 |
| B | 0 | 344 | 0 |
| C | 0 | 344 | 0 |
| D | 0 | 344 | 0 |
| Quadrant | Total seconds | Saturated seconds | Saturation percentage |
|---|---|---|---|
| A | 16856 | 324 | 1.922164% |
| B | 16856 | 383 | 2.272188% |
| C | 16856 | 133 | 0.789037% |
| D | 16856 | 1901 | 11.277883% |
Noise dominated data is calculated using 1-second bins in cleaned event files. If a bin has >2000 counts, and if more than 50% of those come from <1% of pixels, then it is considered to be noise-dominated and hence unusable.
| Quadrant | # 1 sec bins | Bins with >0 counts | Bins with >2000 counts | High rate bins dominated by noise | Noise dominated (total time) | Noise dominated (detector-on time) | Marked lightcurve |
|---|---|---|---|---|---|---|---|
| A | 19816 | 16859 | 130 | 130 | 0.66% | 0.77% | 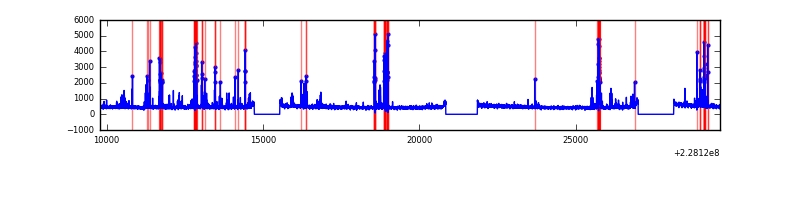 |
| B | 19816 | 16859 | 138 | 138 | 0.70% | 0.82% | 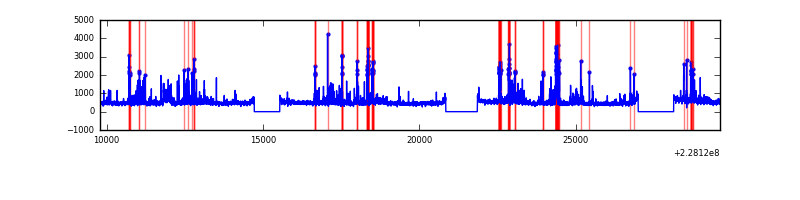 |
| C | 19816 | 16859 | 0 | 0 | 0.00% | 0.00% | 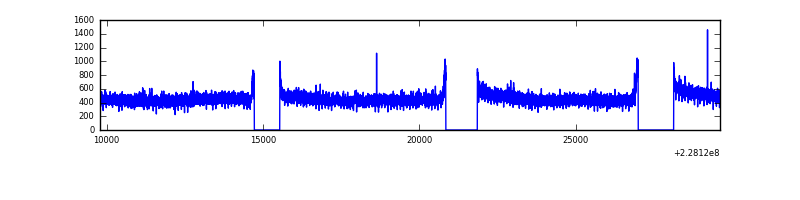 |
| D | 19816 | 16859 | 1520 | 1520 | 7.67% | 9.02% | 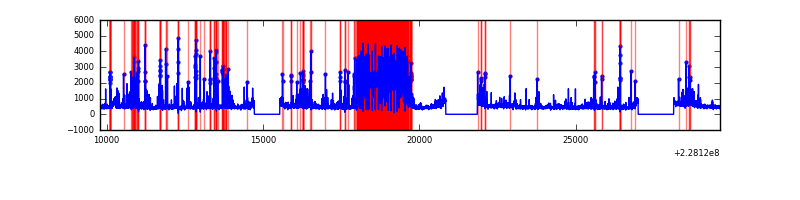 |
Top three noisy pixels from each quadrant. If the there are fewer than three noisy pixels in the level2.evt file, extra rows are filled as -1
| Pixel properties | Quadrant properties | ||||||
|---|---|---|---|---|---|---|---|
| Quadrant | DetID | PixID | Counts | Sigma | Mean | Median | Sigma |
| A | 4 | 2 | 918785 | 2272.33 | 1995 | 1953 | 403.5 |
| A | 0 | 226 | 18721 | 41.56 | 1995 | 1953 | 403.5 |
| A | 12 | 194 | 18117 | 40.06 | 1995 | 1953 | 403.5 |
| B | 4 | 239 | 736190 | 1951.27 | 2004 | 1959 | 376.3 |
| B | 11 | 51 | 171738 | 451.2 | 2004 | 1959 | 376.3 |
| B | 0 | 213 | 157466 | 413.27 | 2004 | 1959 | 376.3 |
| C | 1 | 16 | 51664 | 110.66 | 1953 | 1961 | 449.2 |
| C | 13 | 61 | 15260 | 29.61 | 1953 | 1961 | 449.2 |
| C | 8 | 222 | 6332 | 9.73 | 1953 | 1961 | 449.2 |
| D | 4 | 95 | 4242861 | 8725.49 | 1809 | 1770 | 486.1 |
| D | 1 | 52 | 408635 | 837.07 | 1809 | 1770 | 486.1 |
| D | 13 | 105 | 336491 | 688.64 | 1809 | 1770 | 486.1 |
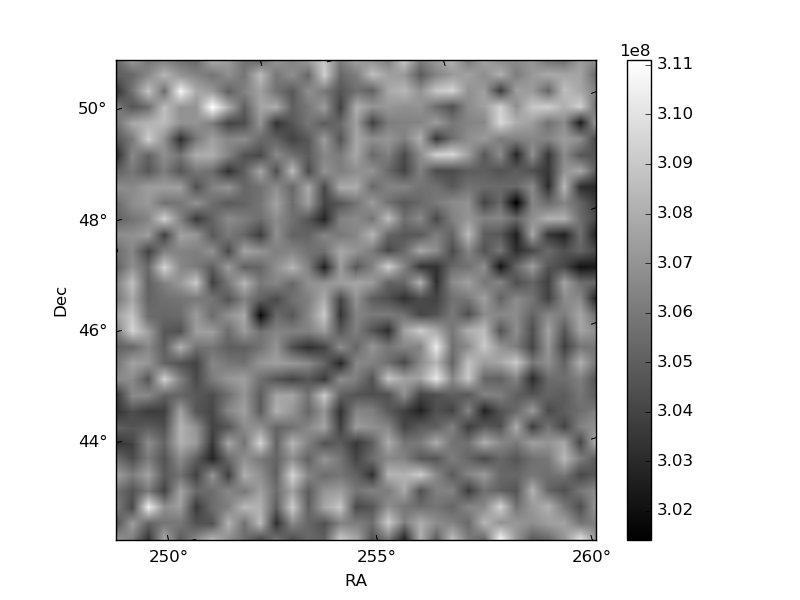
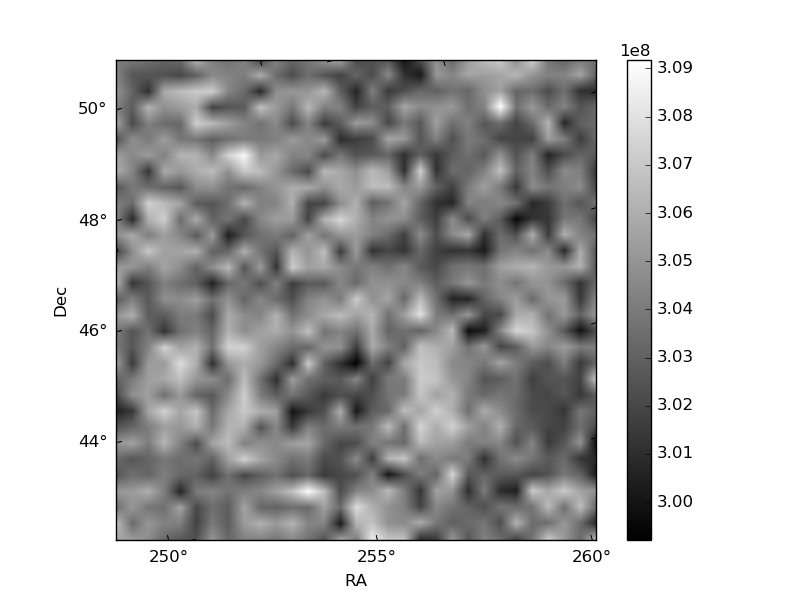
Histogram calculated using DETX and DETY for each event in the final _common_clean file
| Quadrant A | 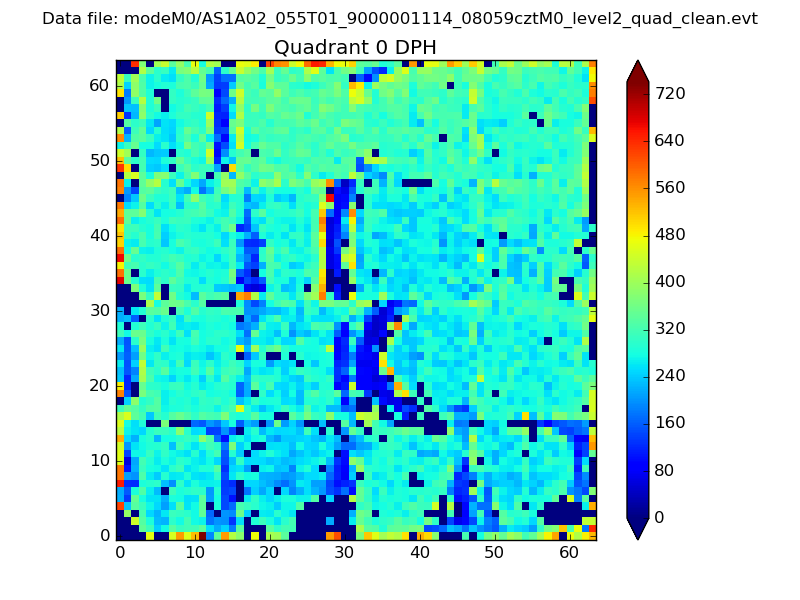 |
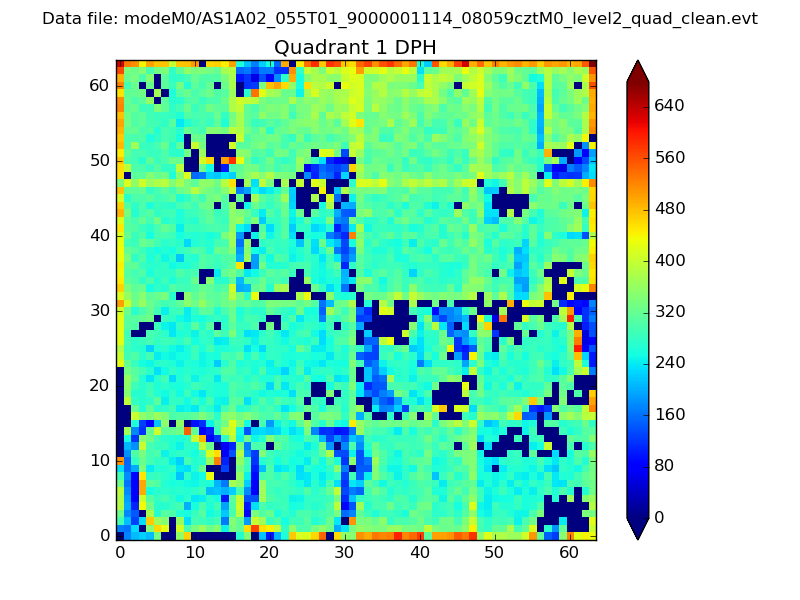 |
Quadrant B |
|---|---|---|---|
| Quadrant D | 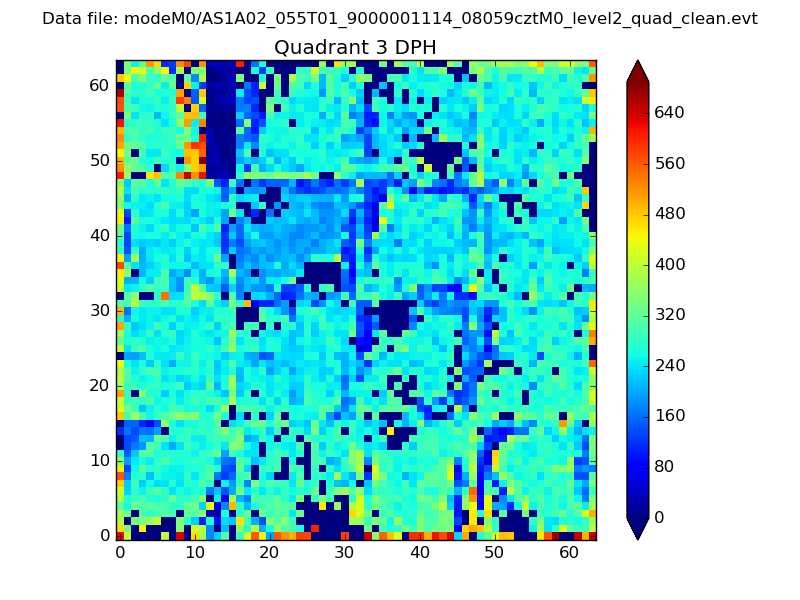 |
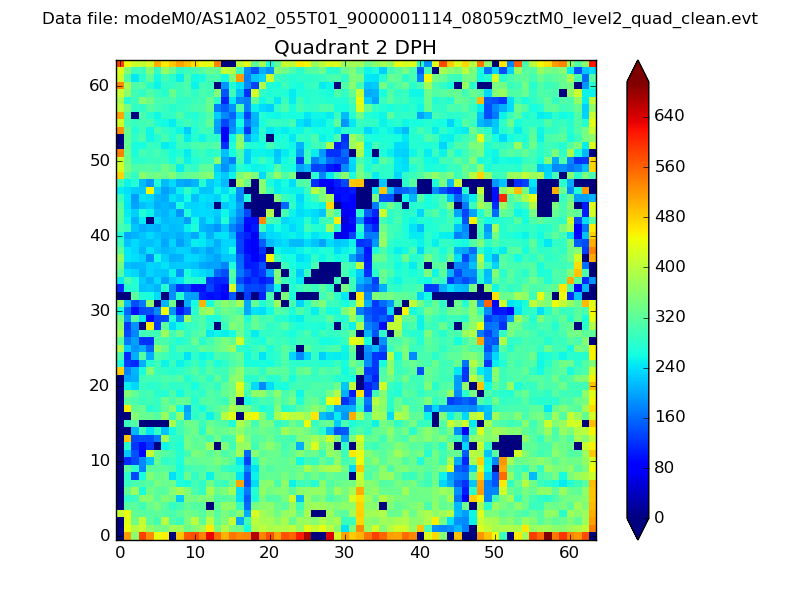 |
Quadrant C |
| Plot type | Count rate plots | Images |
|---|---|---|
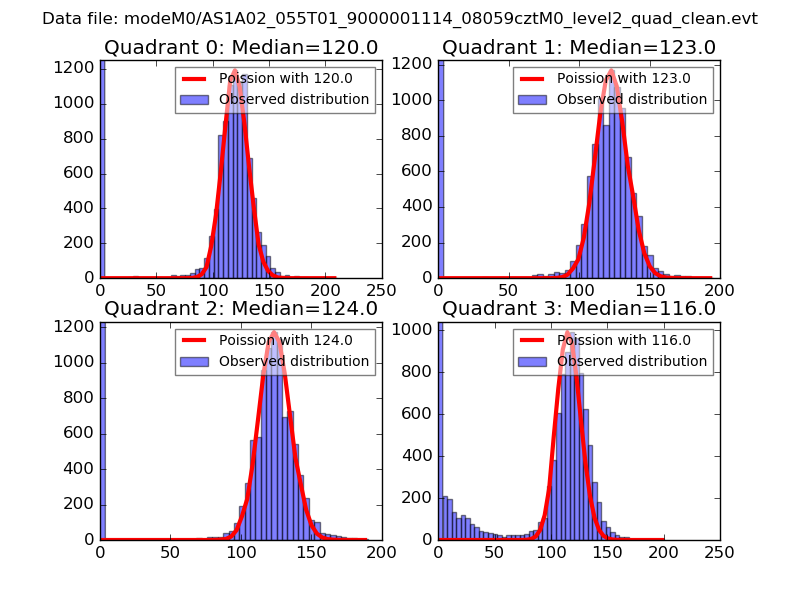
| Comparison with Poisson distribution Blue bars denote a histogram of data divided into 1 sec bins. Red curve is a Poisson curve with rate = median count rate of data. |
 |
 |
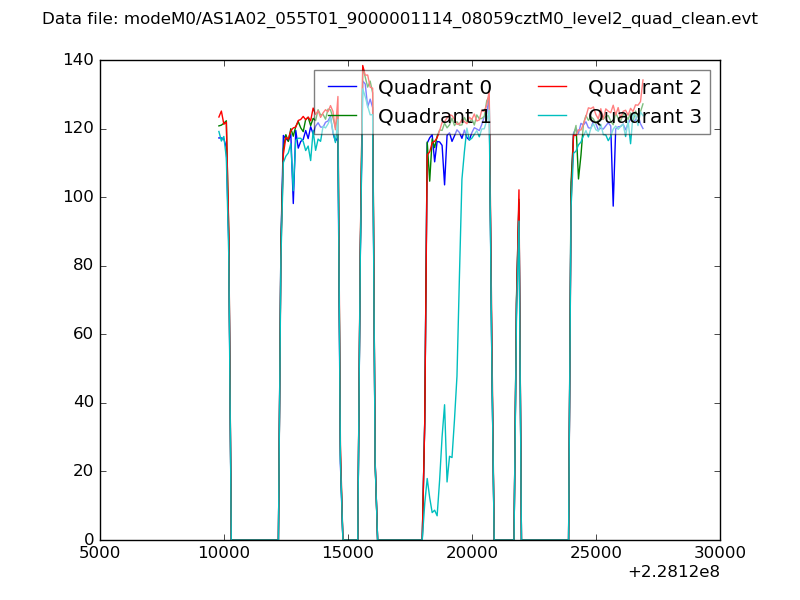
| Quadrant-wise count rates Data is divided into 100 sec bins |
 |
|
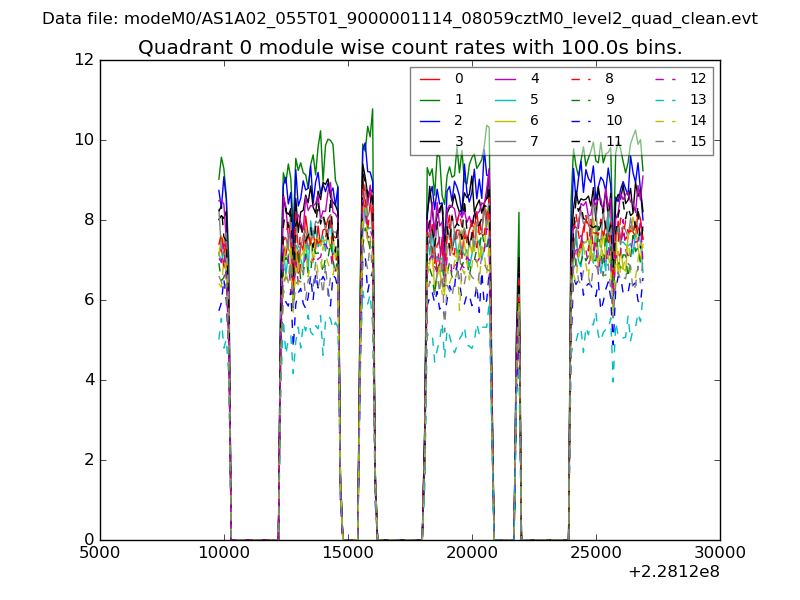
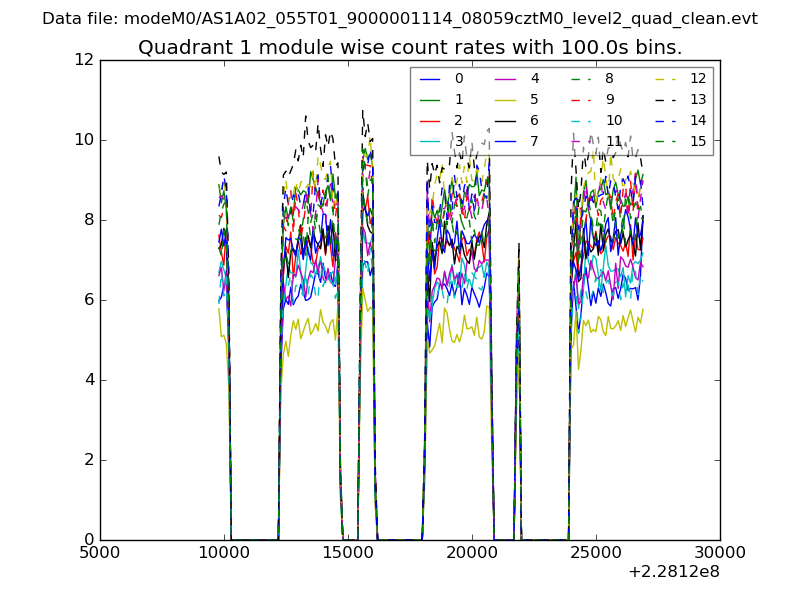
| Module-wise count rates for Quadrant A Data is divided into 100 sec bins |
 |
 |
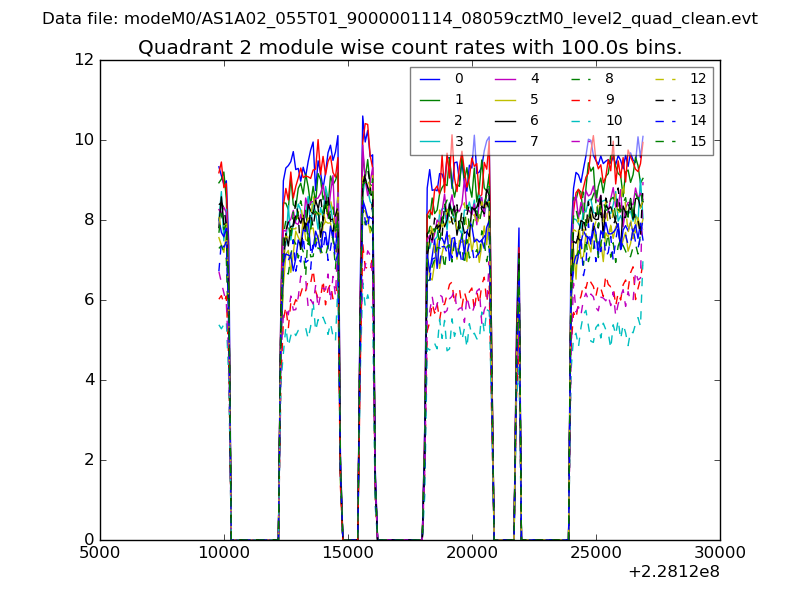
| Module-wise count rates for Quadrant B Data is divided into 100 sec bins |
 |
 |
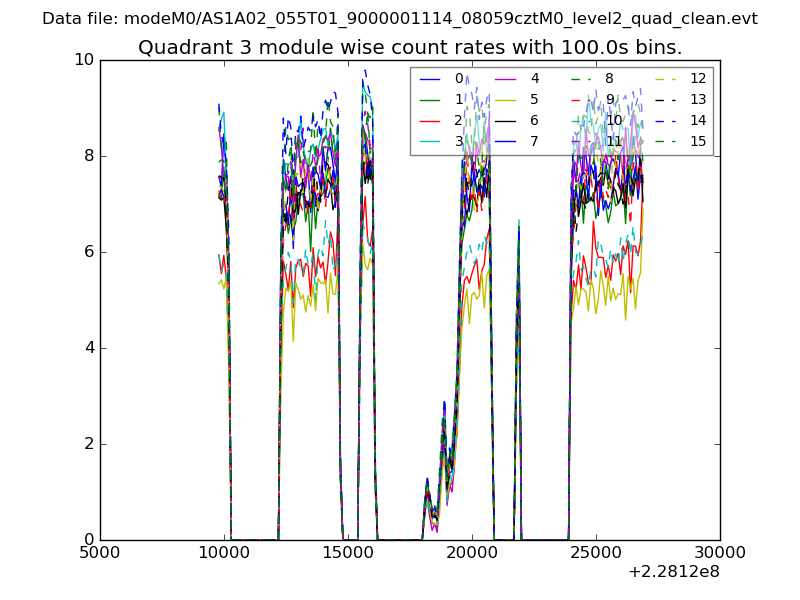
| Module-wise count rates for Quadrant C Data is divided into 100 sec bins |
 |
 |
| Module-wise count rates for Quadrant D Data is divided into 100 sec bins |
 |
 |
| Parameter | Plot |
|---|---|
| CZT HV Monitor | 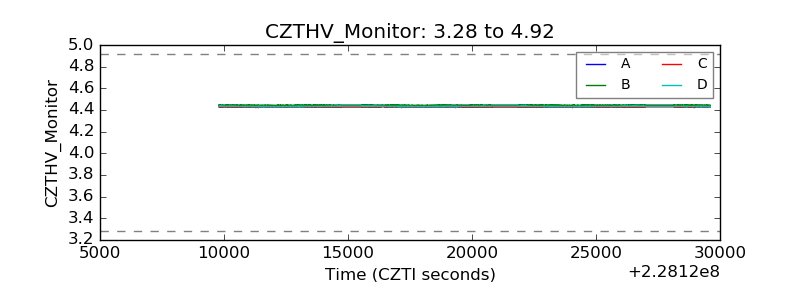 |
| D_VDD | 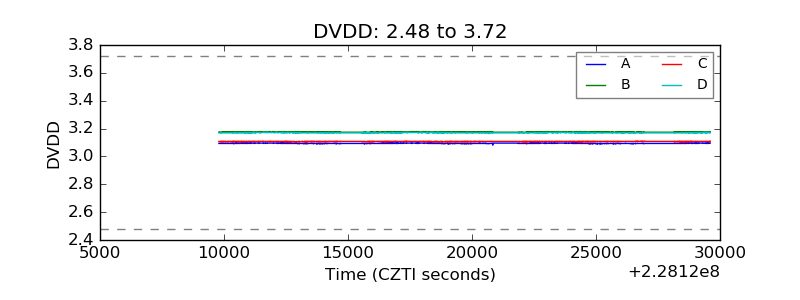 |
| Temperature 1 | 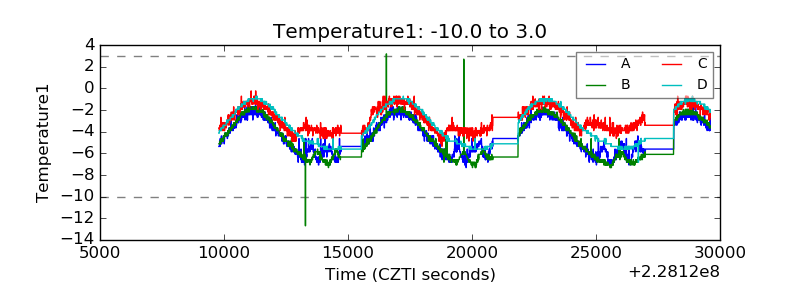 |
| Veto HV Monitor | 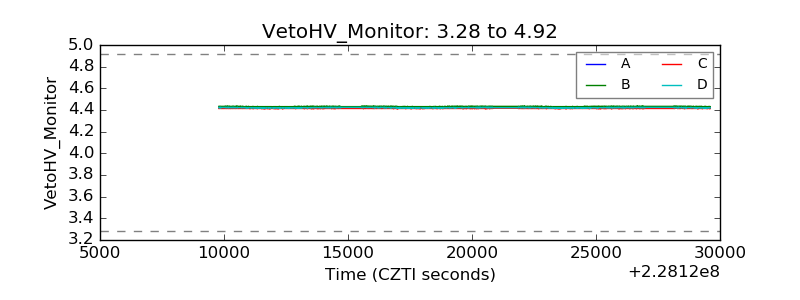 |
| Veto LLD | 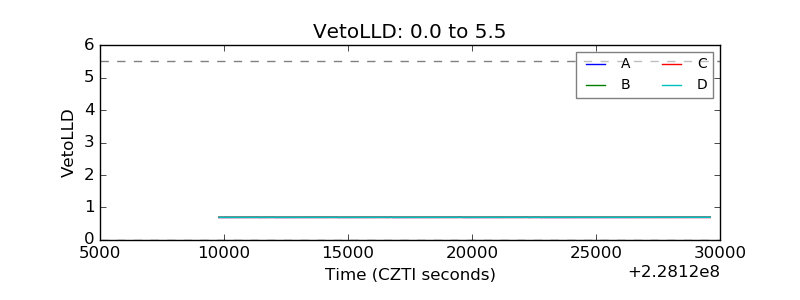 |
| Alpha Counter | 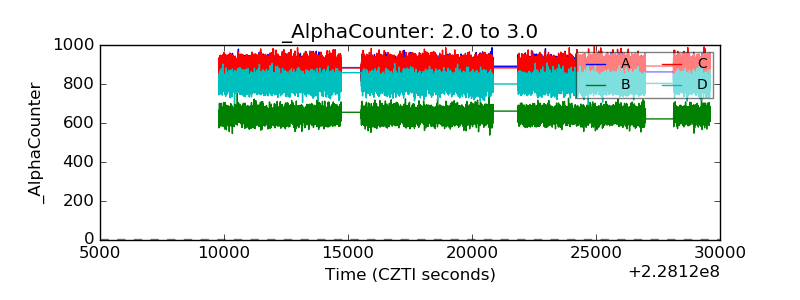 |
| _CPM_Rate | 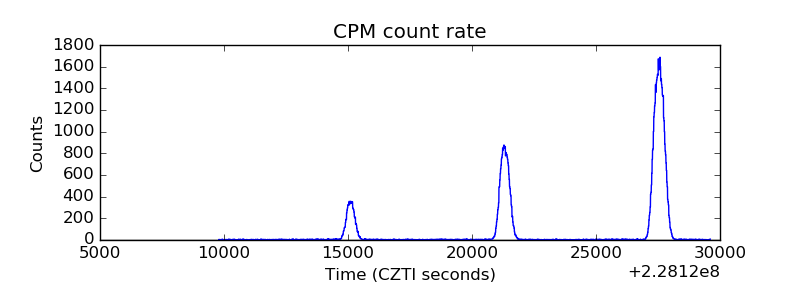 |
| CZT Counter | 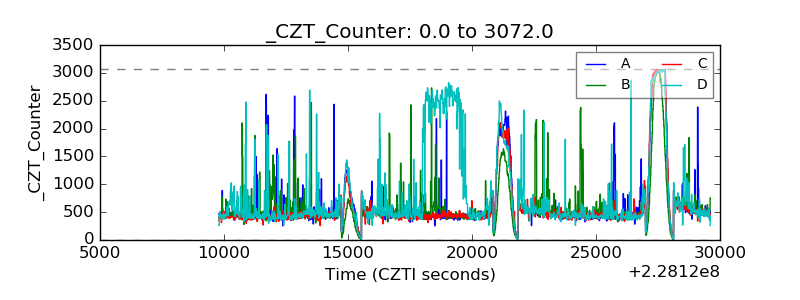 |
| +2.5 Volts monitor |  |
| +5 Volts monitor |  |
| _ROLL_ROT | 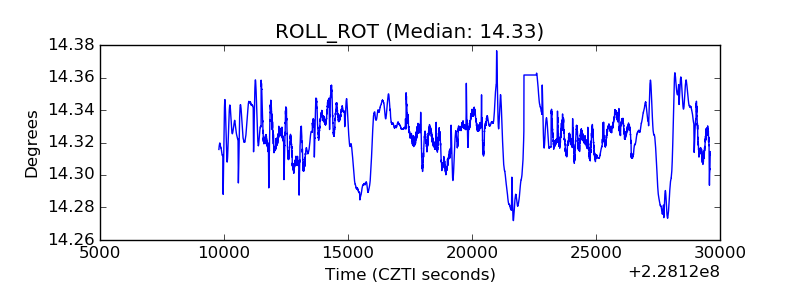 |
| _Roll_DEC | 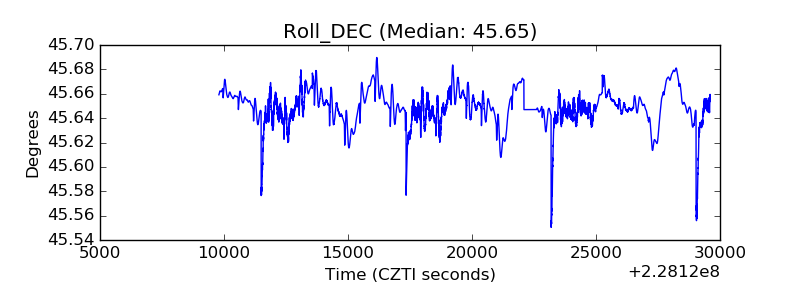 |
| _Roll_RA | 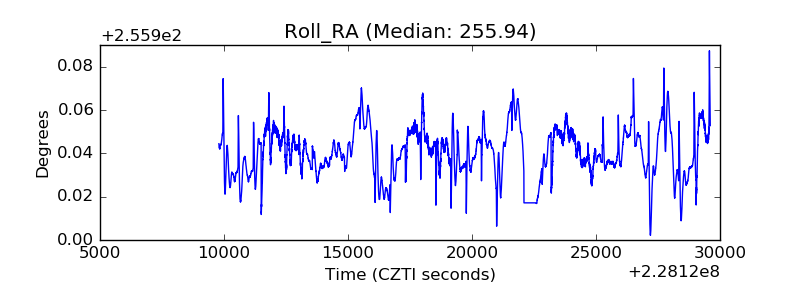 |
| Veto Counter | 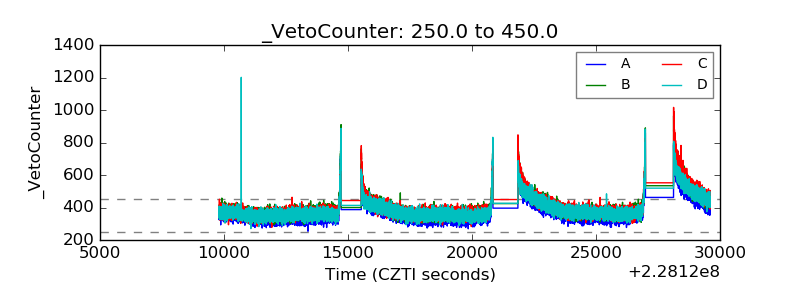 |