| Param | Original file | Final file |
|---|---|---|
| Filename | modeM0/AS1A02_055T01_9000001114_08060cztM0_level2.evt | modeM0/AS1A02_055T01_9000001114_08060cztM0_level2_quad_clean.evt |
| Size (bytes) | 839,856,960 | 131,627,520 |
| Size | 801.0 MB | 125.5 MB |
| Events in quadrant A | 5,854,720 | 795,396 |
| Events in quadrant B | 6,562,953 | 808,576 |
| Events in quadrant C | 5,510,336 | 819,299 |
| Events in quadrant D | 6,728,893 | 767,459 |
| Mode M0 | |||
|---|---|---|---|
| Quadrant | BADHDUFLAG | Total packets | Discarded packets |
| A | 0 | 25075 | 3 |
| B | 0 | 27100 | 2 |
| C | 0 | 24011 | 2 |
| D | 0 | 27833 | 2 |
| Mode M9 | |||
|---|---|---|---|
| Quadrant | BADHDUFLAG | Total packets | Discarded packets |
| A | 0 | 25 | 0 |
| B | 0 | 25 | 0 |
| C | 0 | 25 | 0 |
| D | 0 | 25 | 0 |
| Mode SS | |||
|---|---|---|---|
| Quadrant | BADHDUFLAG | Total packets | Discarded packets |
| A | 0 | 232 | 0 |
| B | 0 | 232 | 0 |
| C | 0 | 232 | 0 |
| D | 0 | 232 | 0 |
| Quadrant | Total seconds | Saturated seconds | Saturation percentage |
|---|---|---|---|
| A | 11503 | 171 | 1.486569% |
| B | 11503 | 323 | 2.807963% |
| C | 11503 | 101 | 0.878032% |
| D | 11503 | 437 | 3.799009% |
Noise dominated data is calculated using 1-second bins in cleaned event files. If a bin has >2000 counts, and if more than 50% of those come from <1% of pixels, then it is considered to be noise-dominated and hence unusable.
| Quadrant | # 1 sec bins | Bins with >0 counts | Bins with >2000 counts | High rate bins dominated by noise | Noise dominated (total time) | Noise dominated (detector-on time) | Marked lightcurve |
|---|---|---|---|---|---|---|---|
| A | 13888 | 11505 | 43 | 43 | 0.31% | 0.37% | 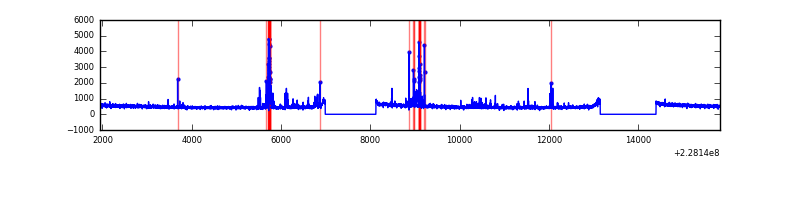 |
| B | 13888 | 11505 | 119 | 119 | 0.86% | 1.03% | 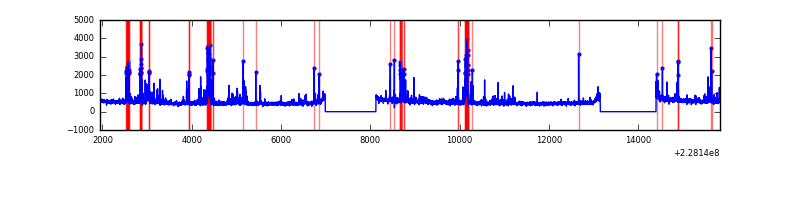 |
| C | 13888 | 11505 | 0 | 0 | 0.00% | 0.00% | 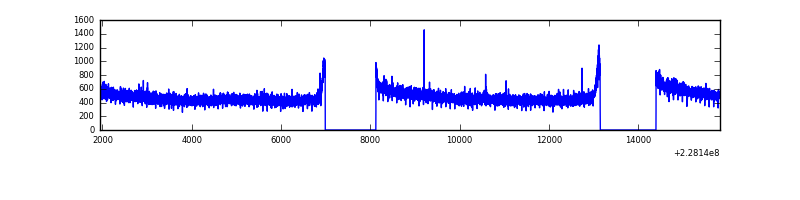 |
| D | 13888 | 11505 | 269 | 269 | 1.94% | 2.34% | 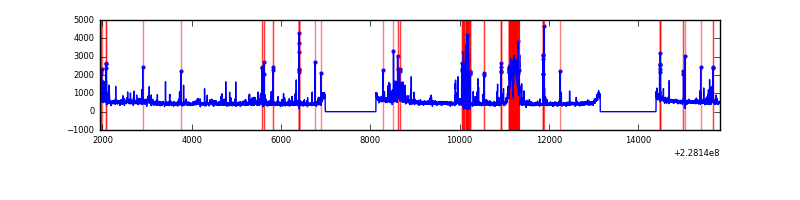 |
Top three noisy pixels from each quadrant. If the there are fewer than three noisy pixels in the level2.evt file, extra rows are filled as -1
| Pixel properties | Quadrant properties | ||||||
|---|---|---|---|---|---|---|---|
| Quadrant | DetID | PixID | Counts | Sigma | Mean | Median | Sigma |
| A | 4 | 2 | 354004 | 1224.67 | 1429 | 1400 | 287.9 |
| A | 0 | 226 | 13388 | 41.64 | 1429 | 1400 | 287.9 |
| A | 12 | 194 | 12796 | 39.58 | 1429 | 1400 | 287.9 |
| B | 4 | 239 | 570432 | 2130.32 | 1431 | 1399 | 267.1 |
| B | 5 | 250 | 129385 | 479.15 | 1431 | 1399 | 267.1 |
| B | 4 | 81 | 67296 | 246.7 | 1431 | 1399 | 267.1 |
| C | 1 | 16 | 34156 | 102.25 | 1403 | 1411 | 320.2 |
| C | 13 | 61 | 10834 | 29.43 | 1403 | 1411 | 320.2 |
| C | 8 | 222 | 4543 | 9.78 | 1403 | 1411 | 320.2 |
| D | 1 | 83 | 709990 | 1945.55 | 1372 | 1343 | 364.2 |
| D | 1 | 7 | 273915 | 748.33 | 1372 | 1343 | 364.2 |
| D | 4 | 95 | 190752 | 520.01 | 1372 | 1343 | 364.2 |
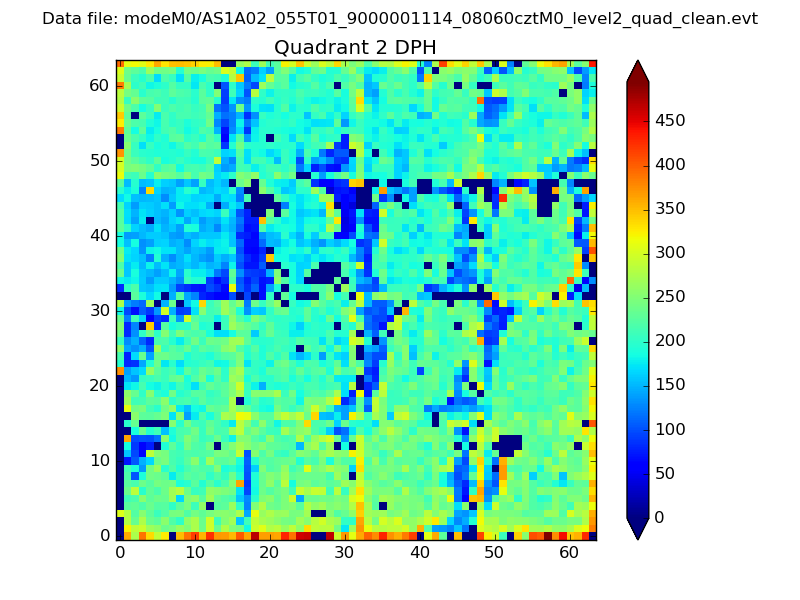
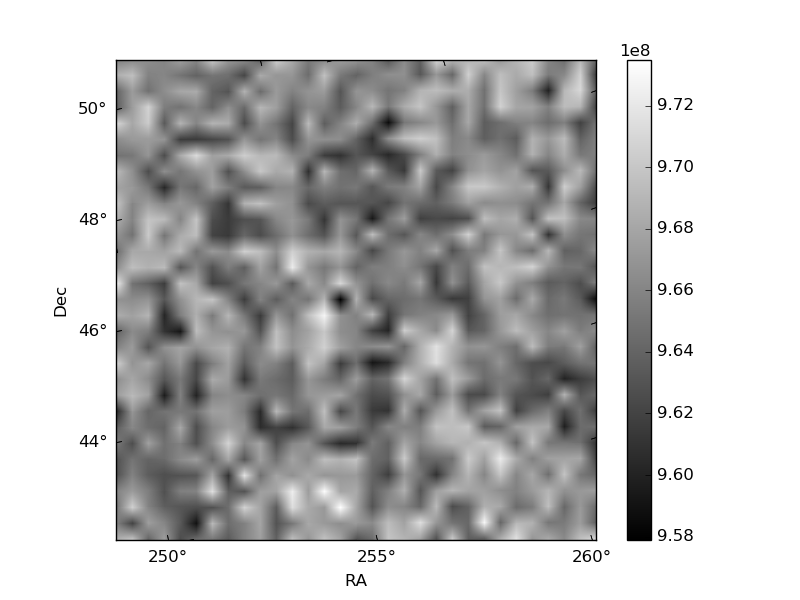
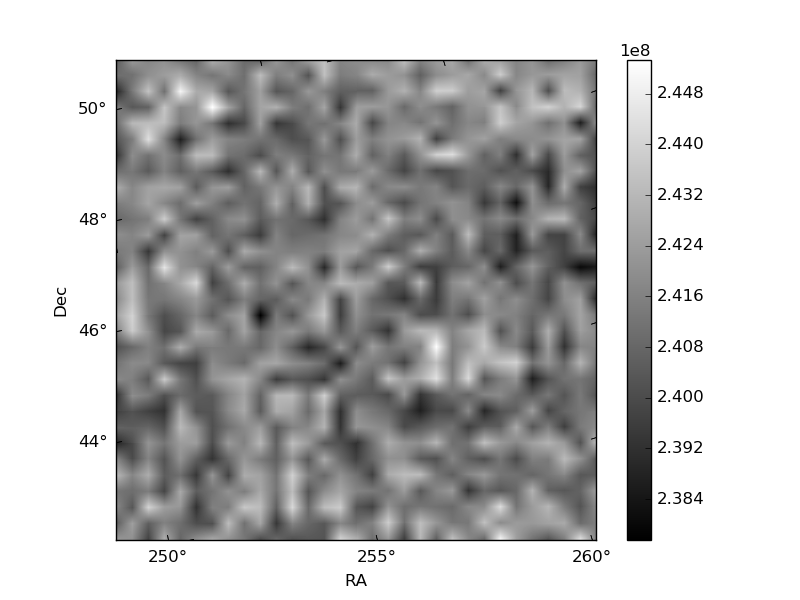
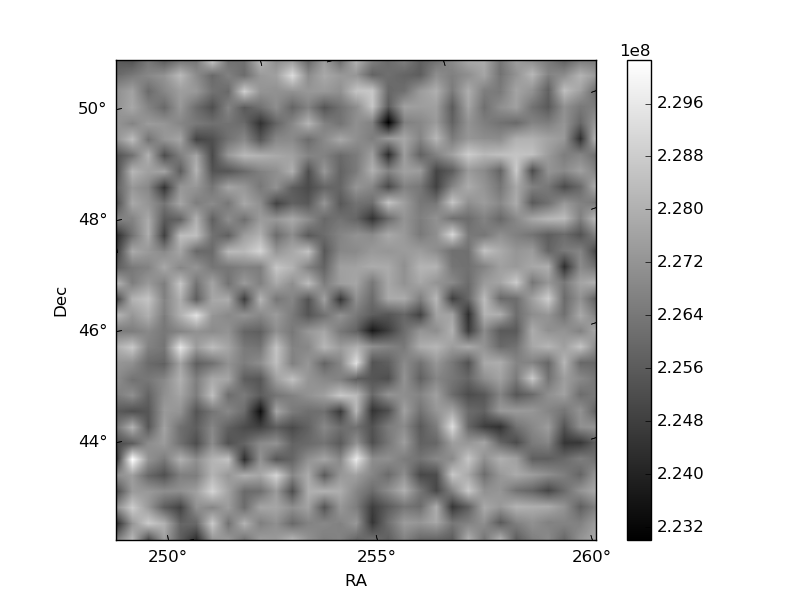
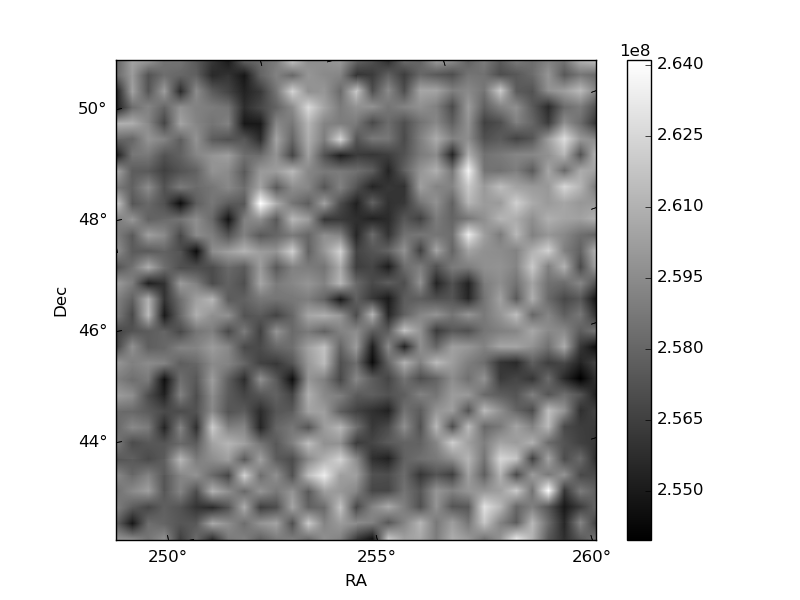
Histogram calculated using DETX and DETY for each event in the final _common_clean file
| Quadrant A | 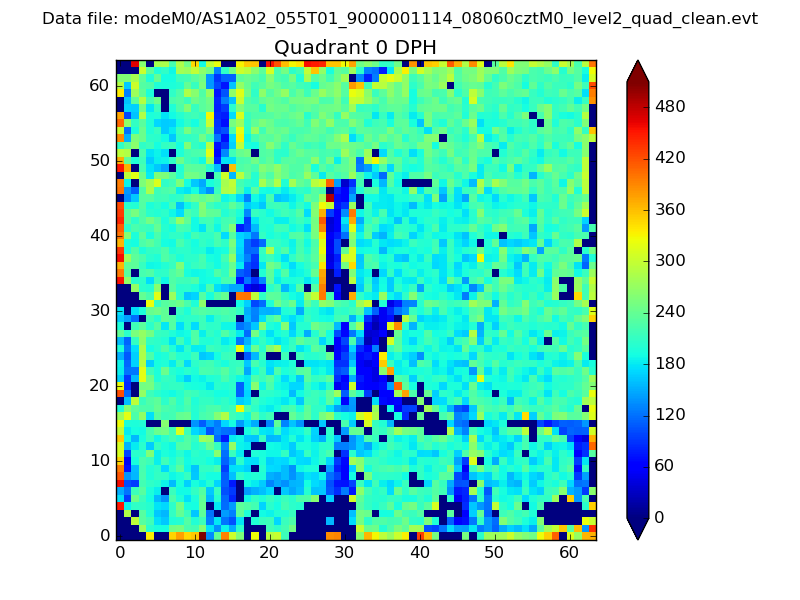 |
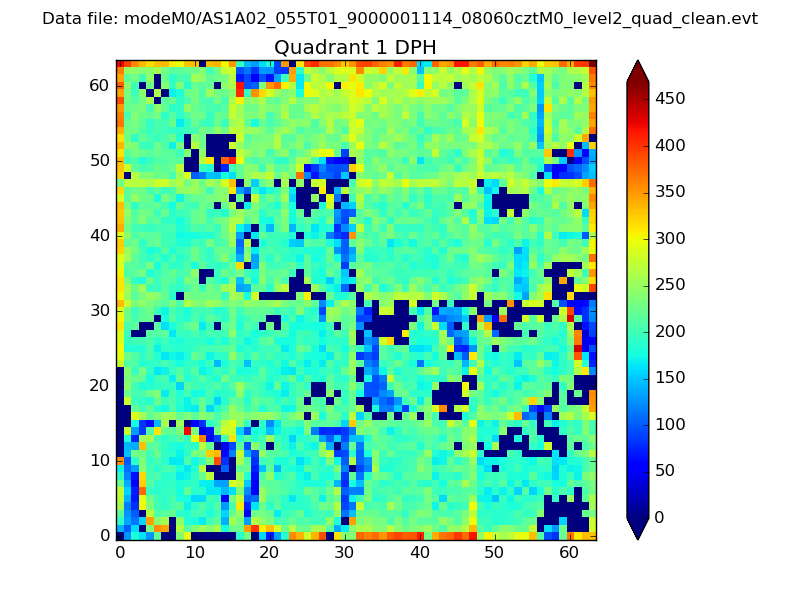 |
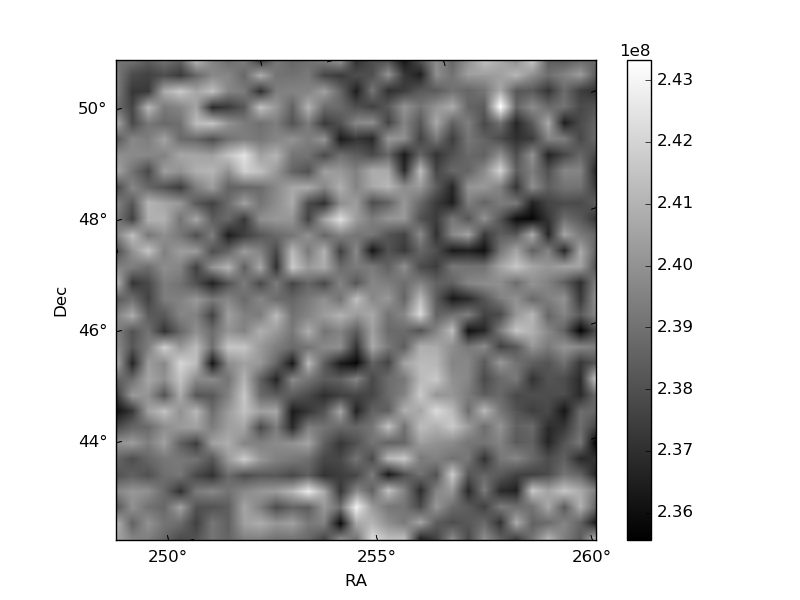
Quadrant B |
|---|---|---|---|
| Quadrant D | 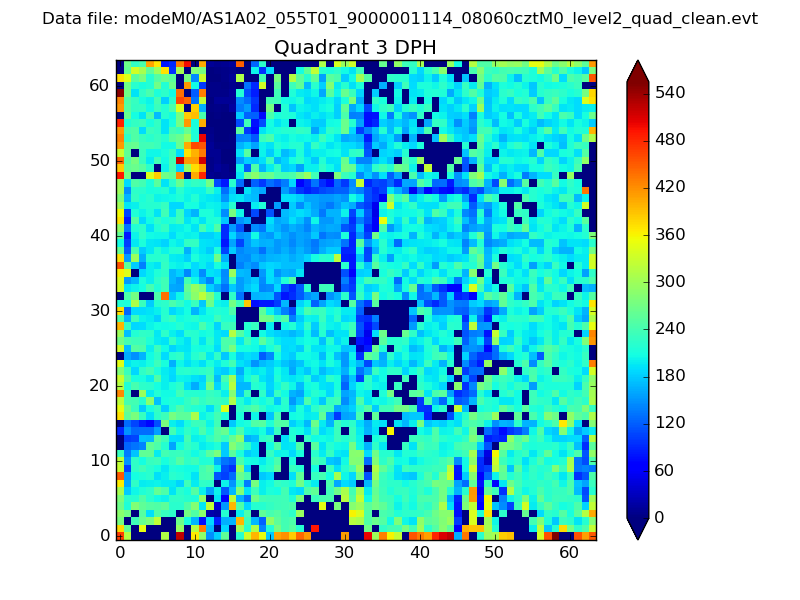 |
 |
Quadrant C |
| Plot type | Count rate plots | Images |
|---|---|---|
| Comparison with Poisson distribution Blue bars denote a histogram of data divided into 1 sec bins. Red curve is a Poisson curve with rate = median count rate of data. |
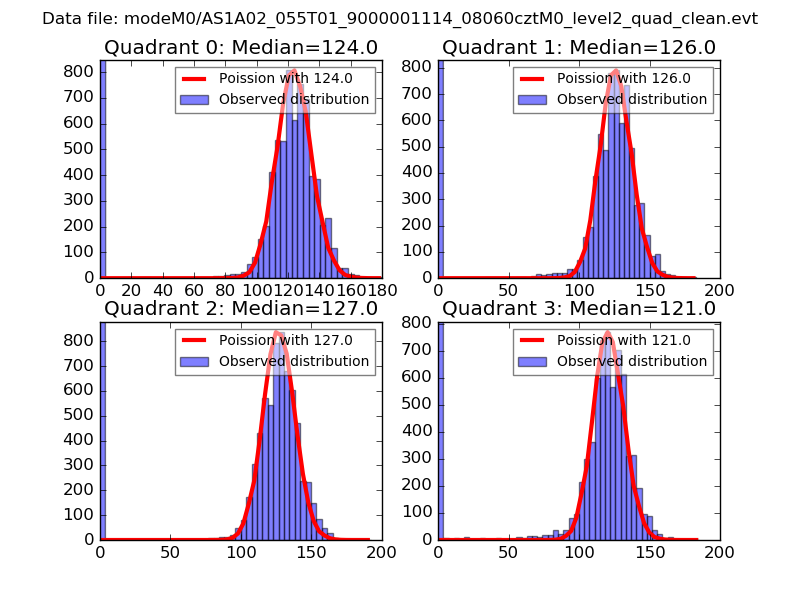 |
 |
| Quadrant-wise count rates Data is divided into 100 sec bins |
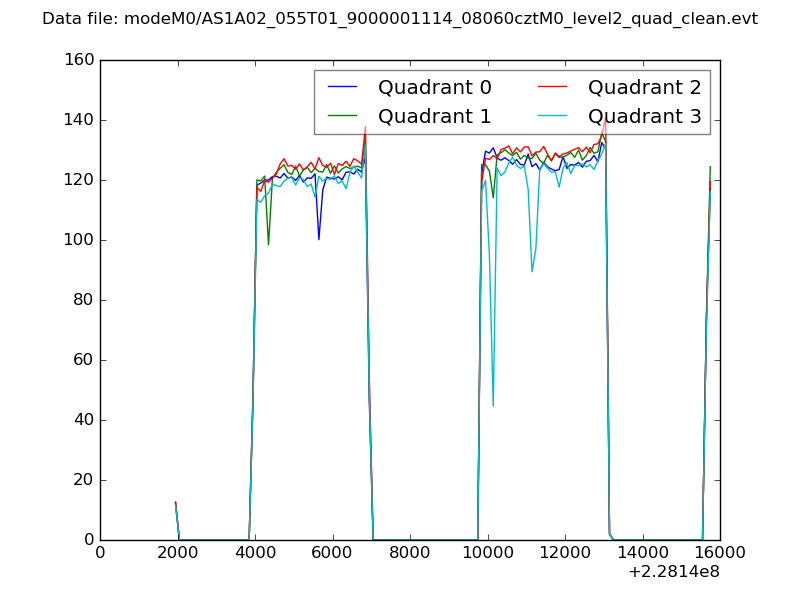 |
|
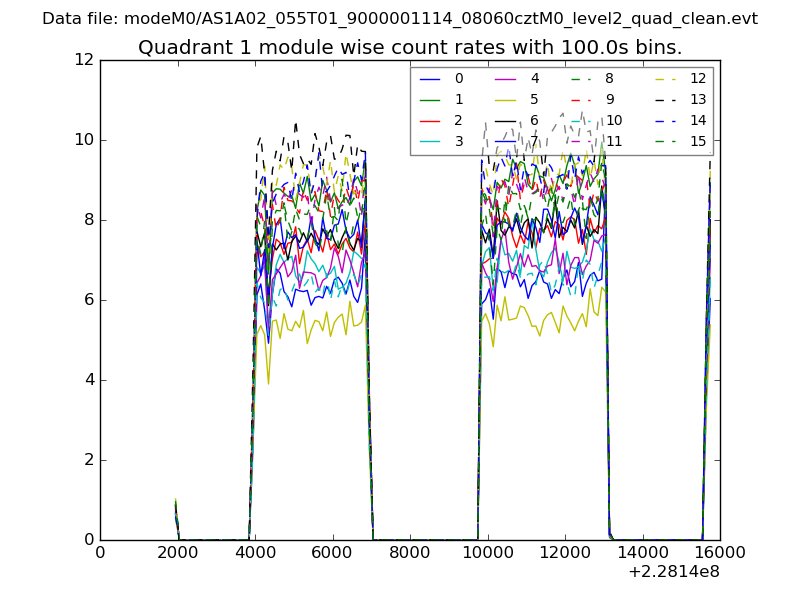
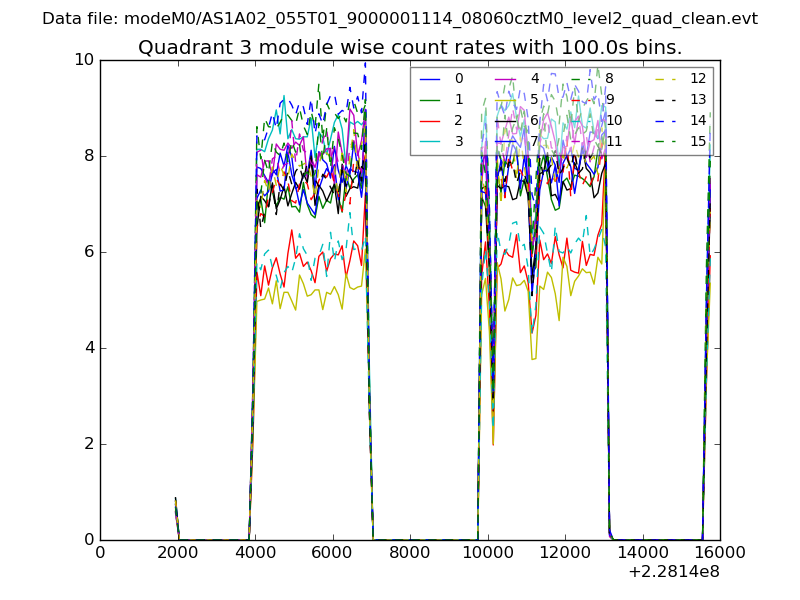
| Module-wise count rates for Quadrant A Data is divided into 100 sec bins |
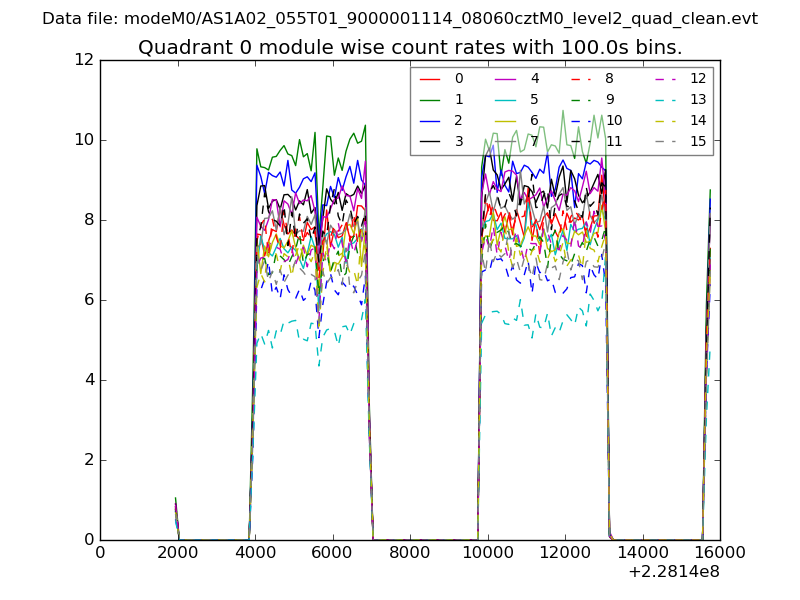 |
 |
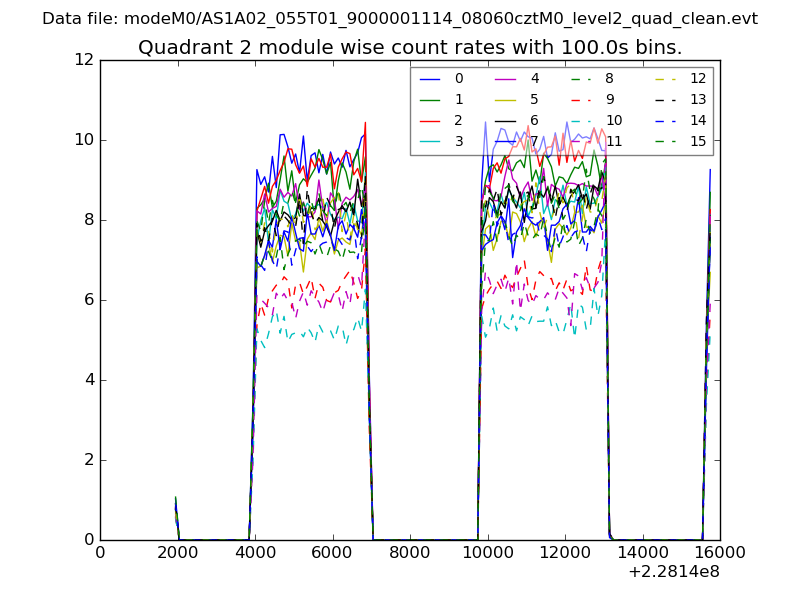
| Module-wise count rates for Quadrant B Data is divided into 100 sec bins |
 |
 |
| Module-wise count rates for Quadrant C Data is divided into 100 sec bins |
 |
 |
| Module-wise count rates for Quadrant D Data is divided into 100 sec bins |
 |
 |
| Parameter | Plot |
|---|---|
| CZT HV Monitor | 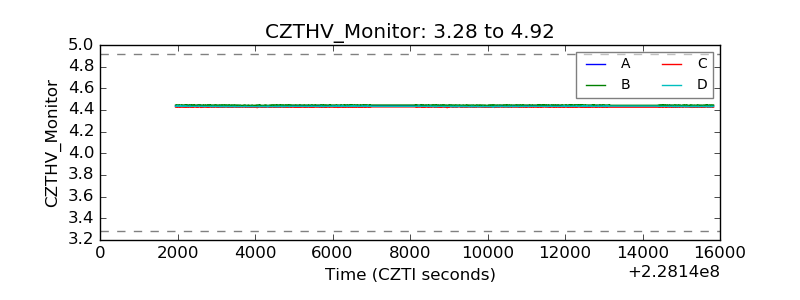 |
| D_VDD | 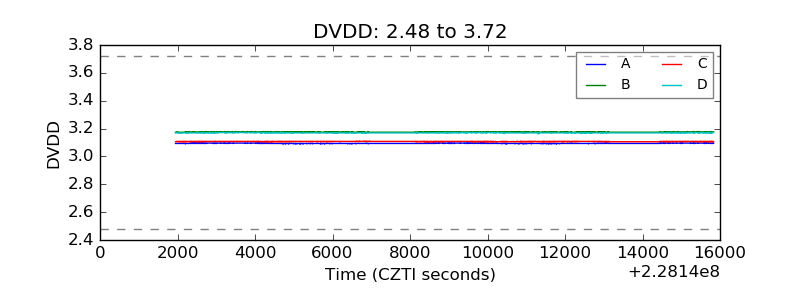 |
| Temperature 1 | 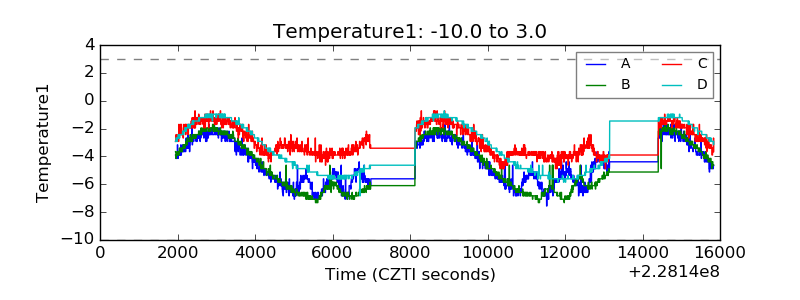 |
| Veto HV Monitor | 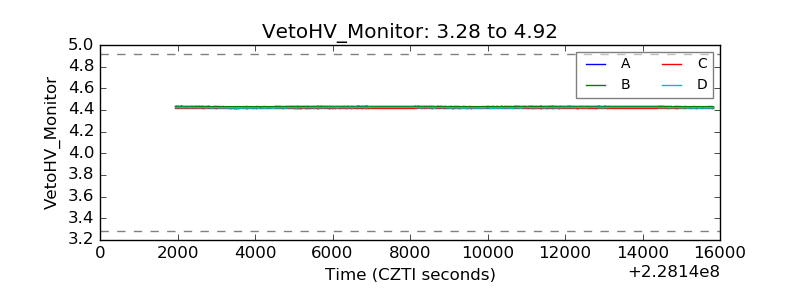 |
| Veto LLD | 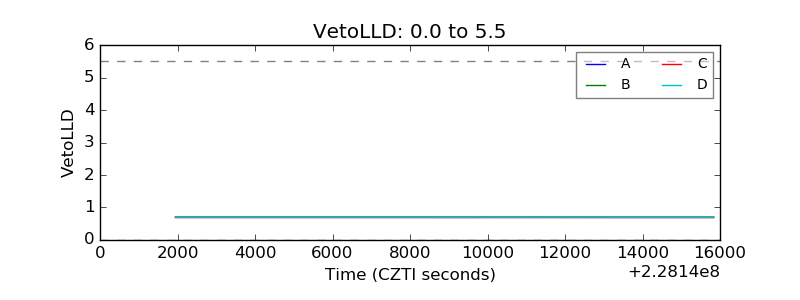 |
| Alpha Counter | 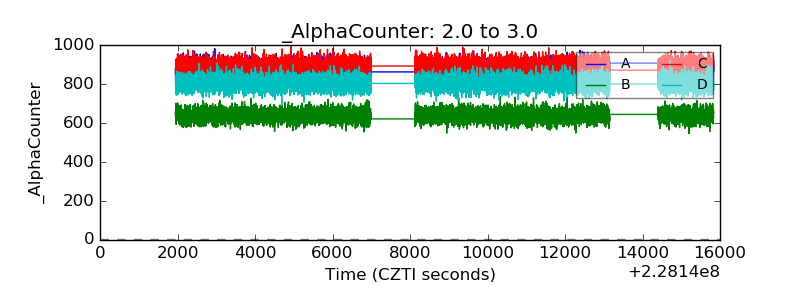 |
| _CPM_Rate |  |
| CZT Counter | 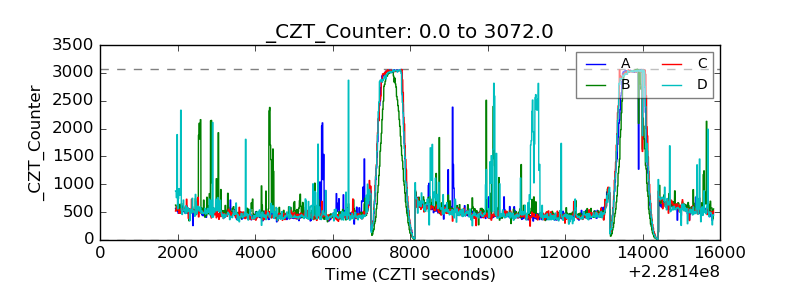 |
| +2.5 Volts monitor |  |
| +5 Volts monitor |  |
| _ROLL_ROT | 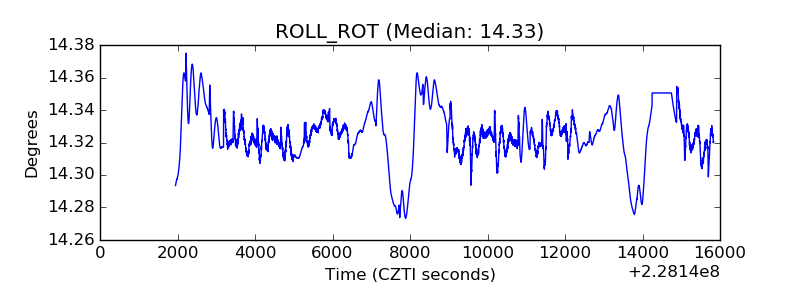 |
| _Roll_DEC | 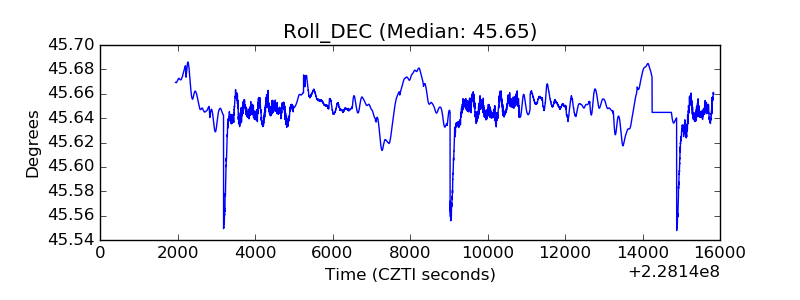 |
| _Roll_RA | 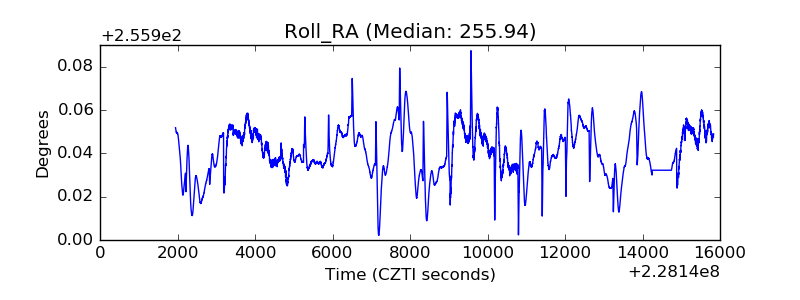 |
| Veto Counter | 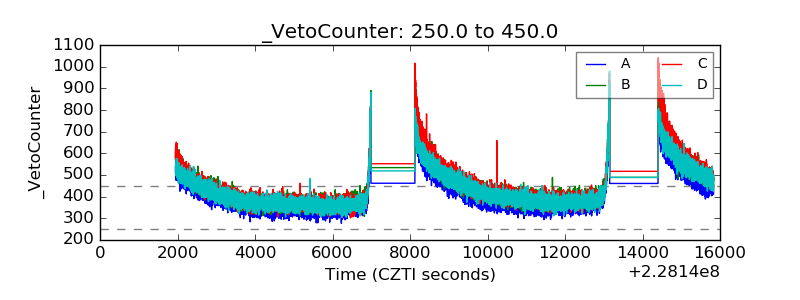 |