| Param | Original file | Final file |
|---|---|---|
| Filename | modeM0/AS1A02_055T01_9000001114_08061cztM0_level2.evt | modeM0/AS1A02_055T01_9000001114_08061cztM0_level2_quad_clean.evt |
| Size (bytes) | 468,901,440 | 84,116,160 |
| Size | 447.2 MB | 80.2 MB |
| Events in quadrant A | 3,111,030 | 526,104 |
| Events in quadrant B | 3,640,475 | 537,207 |
| Events in quadrant C | 3,160,508 | 546,110 |
| Events in quadrant D | 3,870,602 | 507,855 |
| Mode M0 | |||
|---|---|---|---|
| Quadrant | BADHDUFLAG | Total packets | Discarded packets |
| A | 0 | 13365 | 3 |
| B | 0 | 15009 | 2 |
| C | 0 | 13410 | 2 |
| D | 0 | 15496 | 2 |
| Mode M9 | |||
|---|---|---|---|
| Quadrant | BADHDUFLAG | Total packets | Discarded packets |
| A | 0 | 23 | 0 |
| B | 0 | 23 | 0 |
| C | 0 | 23 | 0 |
| D | 0 | 24 | 0 |
| Mode SS | |||
|---|---|---|---|
| Quadrant | BADHDUFLAG | Total packets | Discarded packets |
| A | 0 | 124 | 0 |
| B | 0 | 124 | 0 |
| C | 0 | 124 | 0 |
| D | 0 | 124 | 0 |
| Quadrant | Total seconds | Saturated seconds | Saturation percentage |
|---|---|---|---|
| A | 6161 | 72 | 1.168641% |
| B | 6161 | 154 | 2.499594% |
| C | 6161 | 66 | 1.071255% |
| D | 6161 | 215 | 3.489693% |
Noise dominated data is calculated using 1-second bins in cleaned event files. If a bin has >2000 counts, and if more than 50% of those come from <1% of pixels, then it is considered to be noise-dominated and hence unusable.
| Quadrant | # 1 sec bins | Bins with >0 counts | Bins with >2000 counts | High rate bins dominated by noise | Noise dominated (total time) | Noise dominated (detector-on time) | Marked lightcurve |
|---|---|---|---|---|---|---|---|
| A | 7471 | 6162 | 1 | 1 | 0.01% | 0.02% | 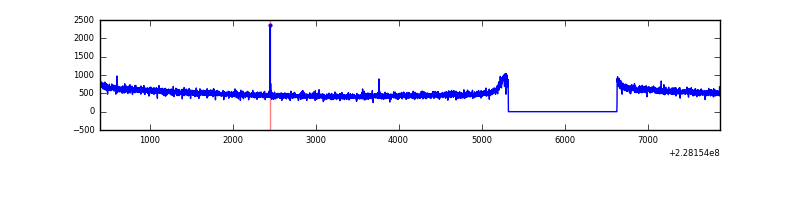 |
| B | 7471 | 6162 | 41 | 41 | 0.55% | 0.67% | 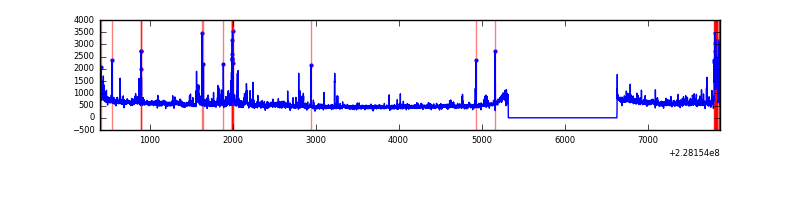 |
| C | 7471 | 6162 | 0 | 0 | 0.00% | 0.00% | 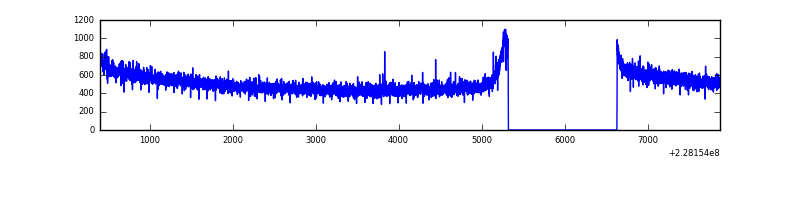 |
| D | 7471 | 6162 | 130 | 130 | 1.74% | 2.11% | 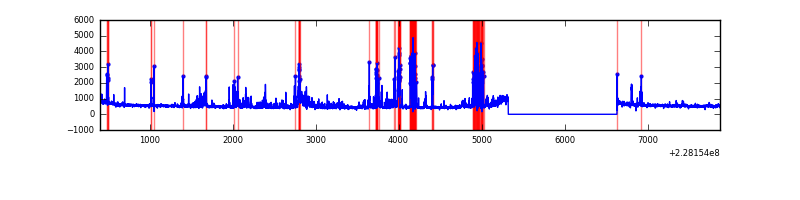 |
Top three noisy pixels from each quadrant. If the there are fewer than three noisy pixels in the level2.evt file, extra rows are filled as -1
| Pixel properties | Quadrant properties | ||||||
|---|---|---|---|---|---|---|---|
| Quadrant | DetID | PixID | Counts | Sigma | Mean | Median | Sigma |
| A | 0 | 226 | 7595 | 41.66 | 807 | 792 | 163.3 |
| A | 12 | 194 | 7217 | 39.35 | 807 | 792 | 163.3 |
| A | 13 | 254 | 3703 | 17.83 | 807 | 792 | 163.3 |
| B | 4 | 239 | 252934 | 1671.54 | 813 | 798 | 150.8 |
| B | 11 | 51 | 122142 | 804.45 | 813 | 798 | 150.8 |
| B | 4 | 81 | 35227 | 228.25 | 813 | 798 | 150.8 |
| C | 1 | 16 | 22109 | 116.31 | 804 | 809 | 183.1 |
| C | 13 | 61 | 6224 | 29.57 | 804 | 809 | 183.1 |
| C | 8 | 222 | 2545 | 9.48 | 804 | 809 | 183.1 |
| D | 4 | 95 | 273128 | 1387.94 | 787 | 768 | 196.2 |
| D | 1 | 52 | 270820 | 1376.18 | 787 | 768 | 196.2 |
| D | 1 | 83 | 270284 | 1373.45 | 787 | 768 | 196.2 |
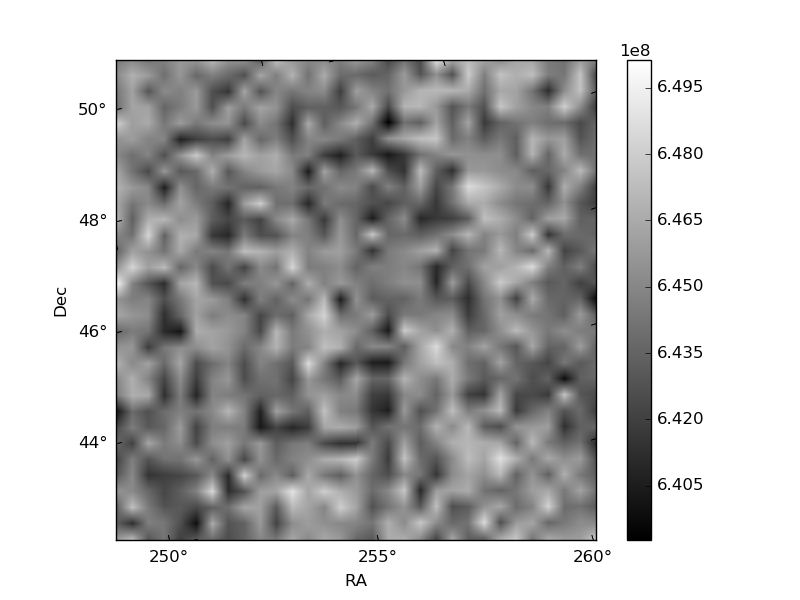
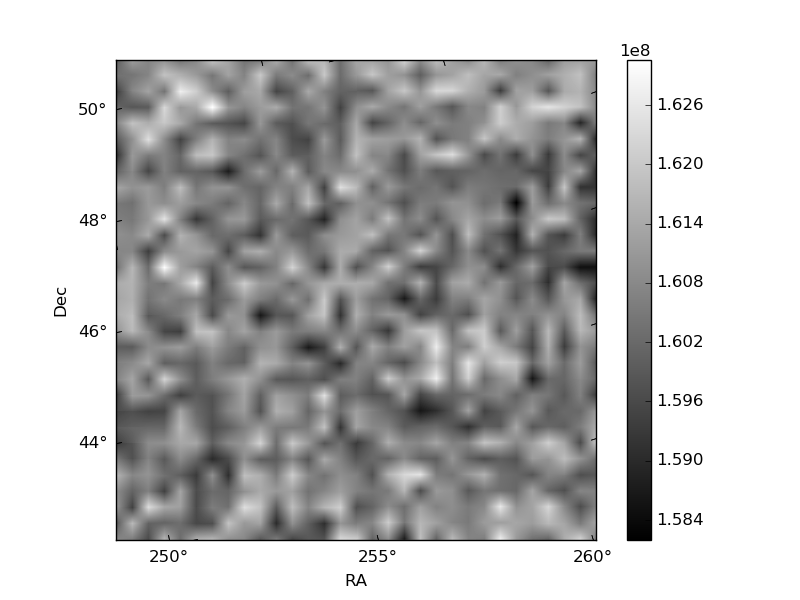
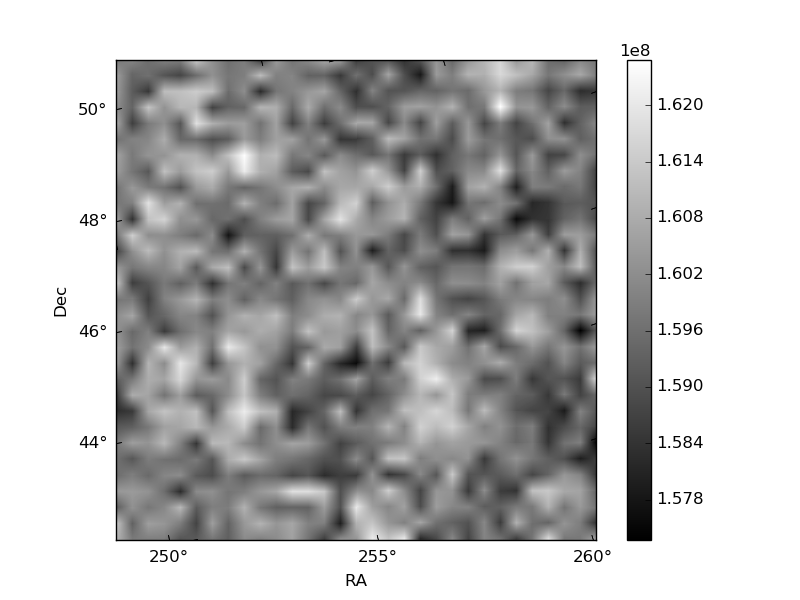
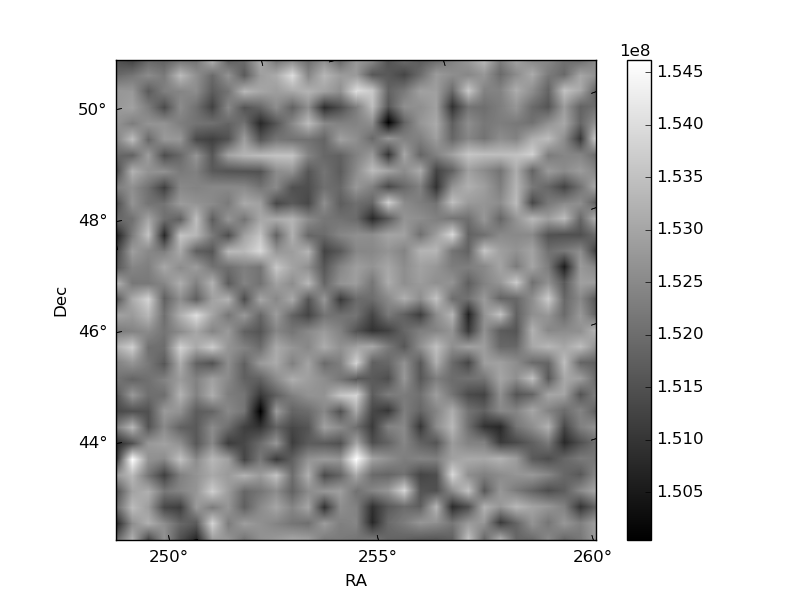
Histogram calculated using DETX and DETY for each event in the final _common_clean file
| Quadrant A | 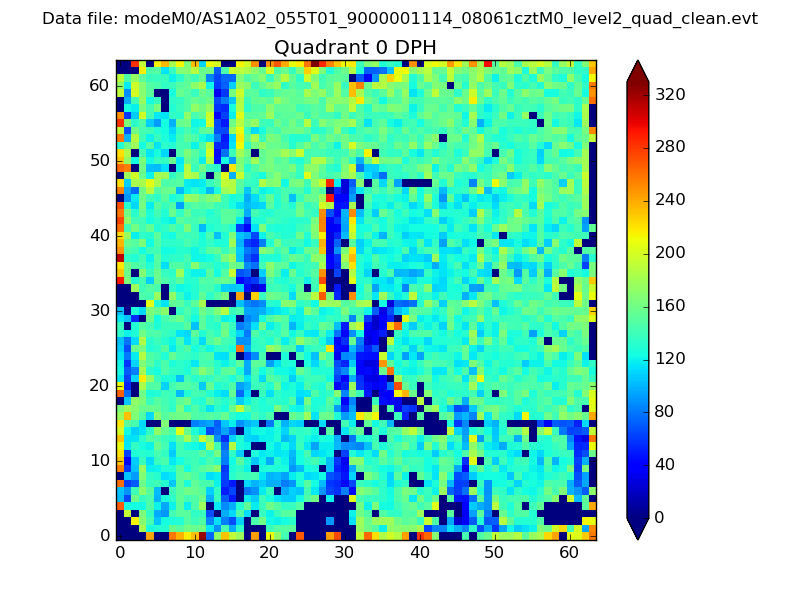 |
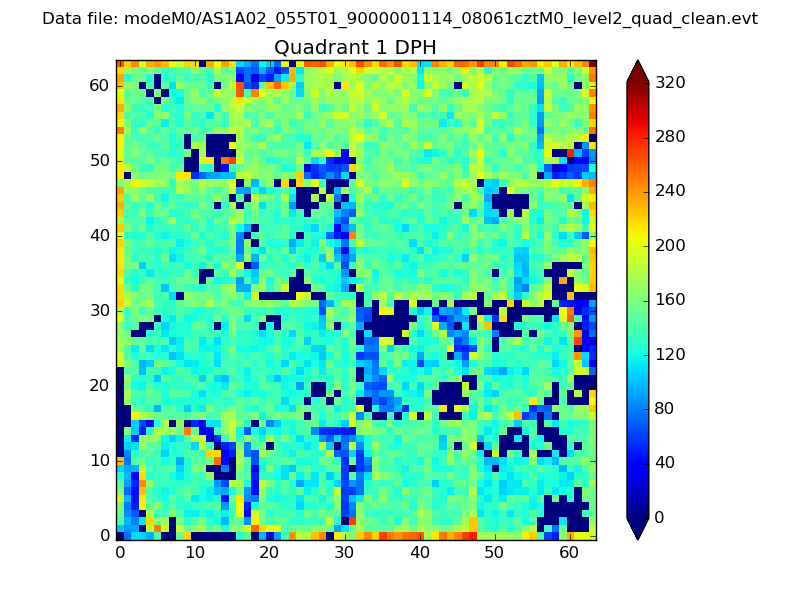 |
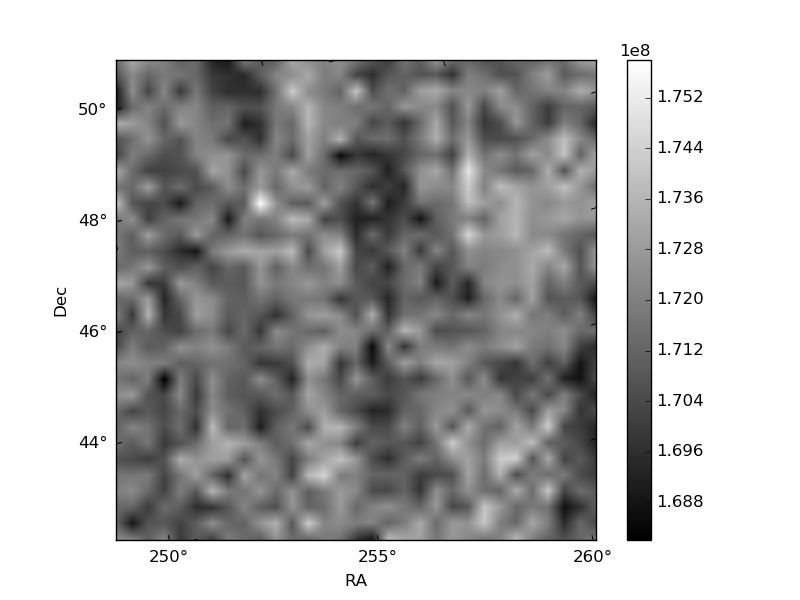
Quadrant B |
|---|---|---|---|
| Quadrant D | 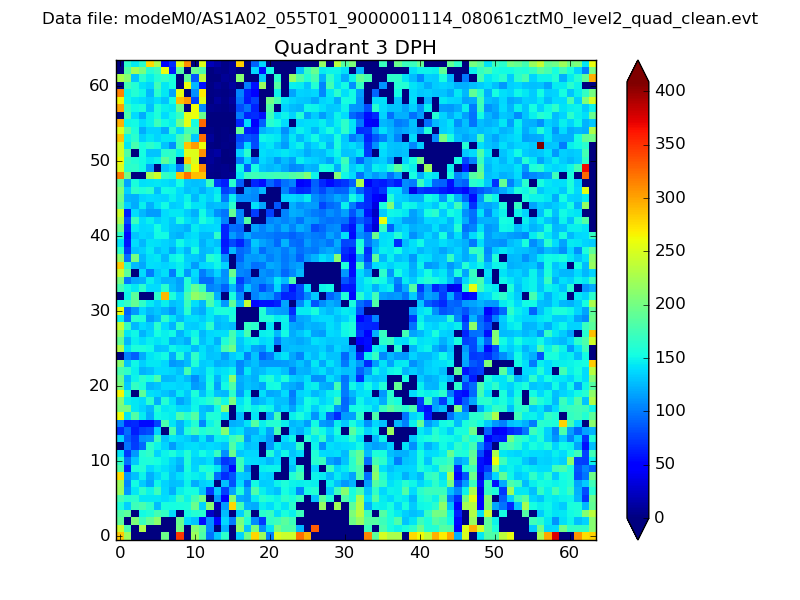 |
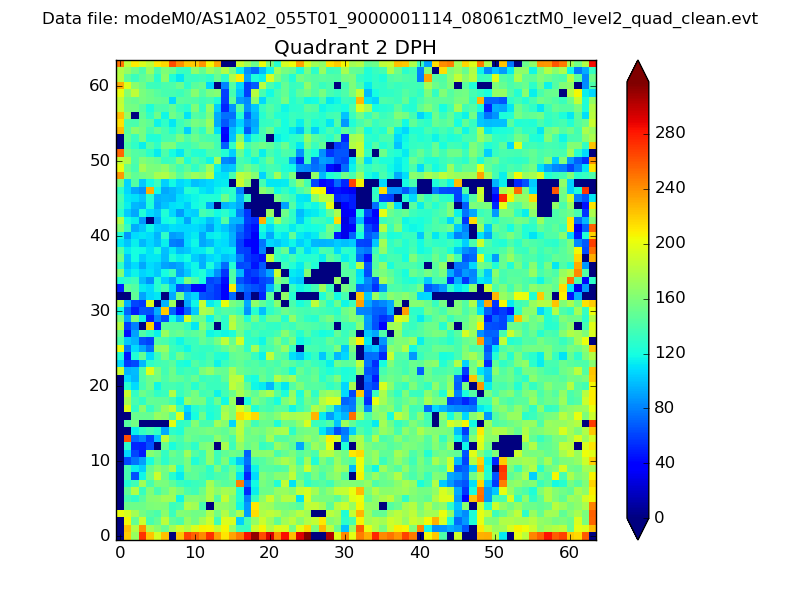 |
Quadrant C |
| Plot type | Count rate plots | Images |
|---|---|---|
| Comparison with Poisson distribution Blue bars denote a histogram of data divided into 1 sec bins. Red curve is a Poisson curve with rate = median count rate of data. |
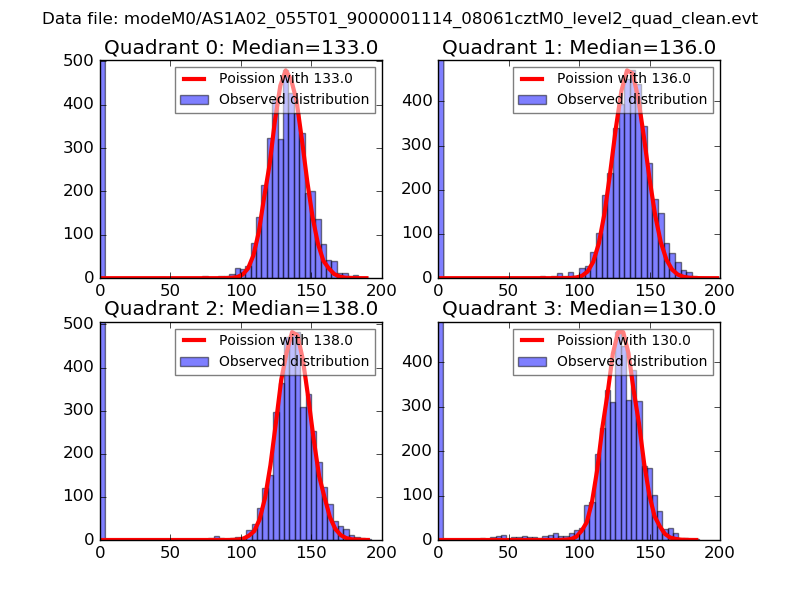 |
 |
| Quadrant-wise count rates Data is divided into 100 sec bins |
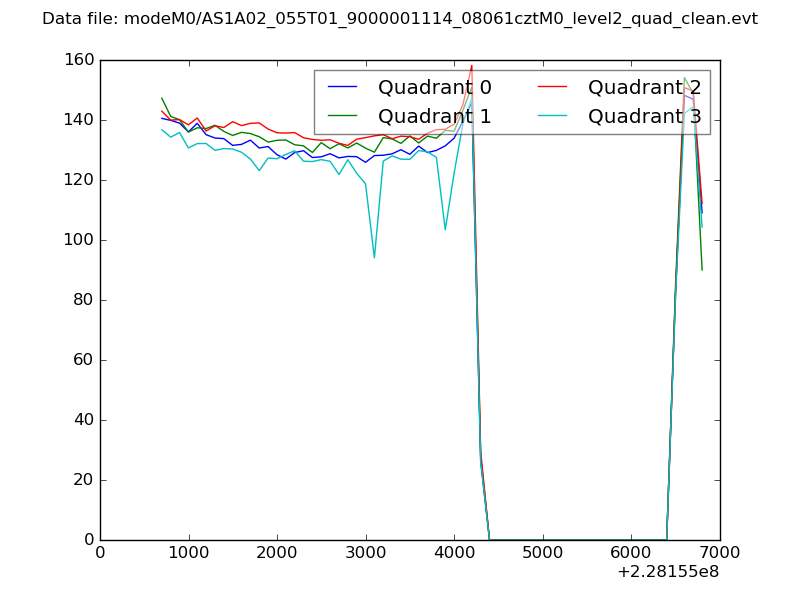 |
|
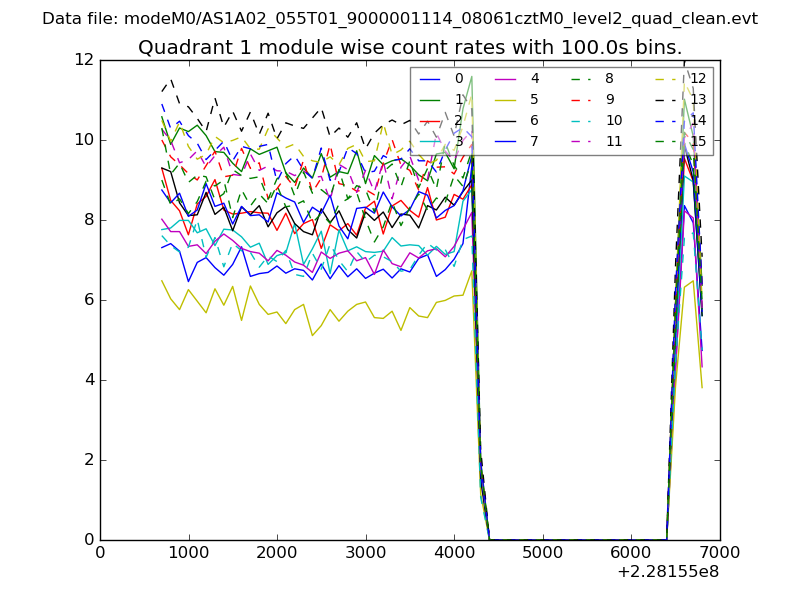
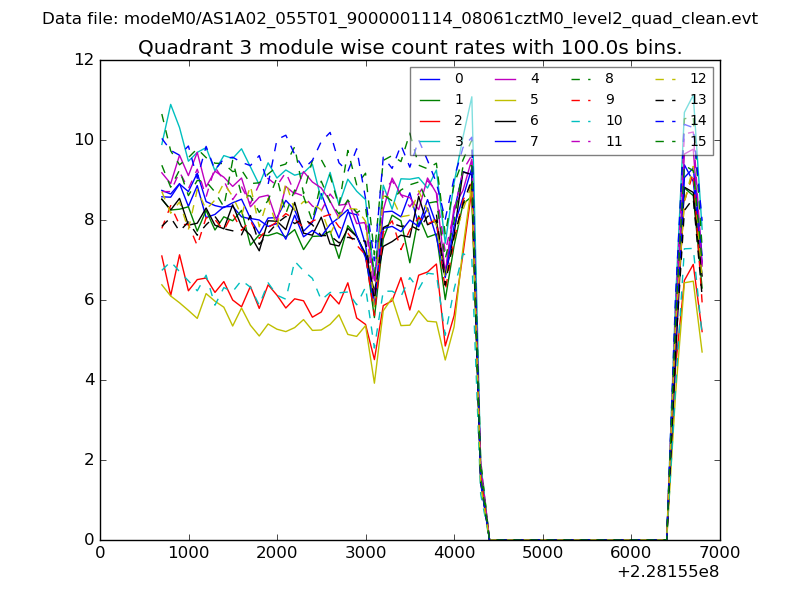
| Module-wise count rates for Quadrant A Data is divided into 100 sec bins |
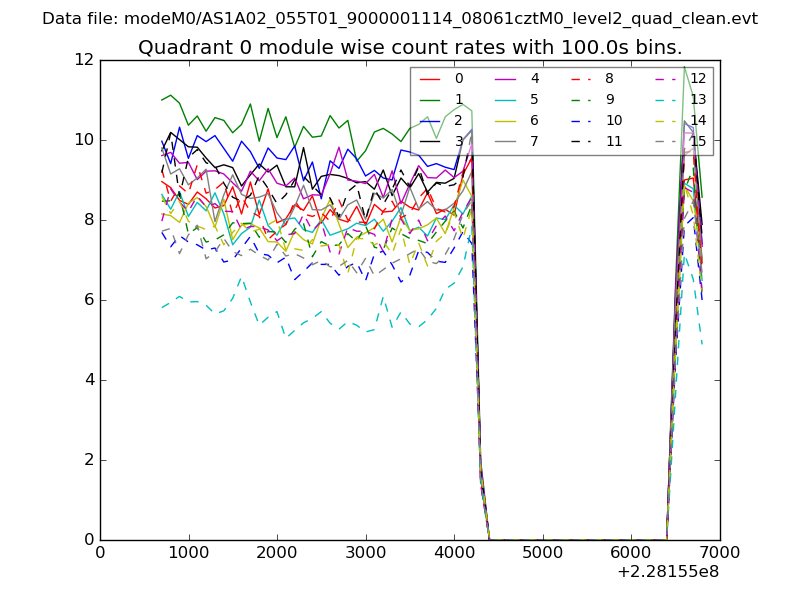 |
 |
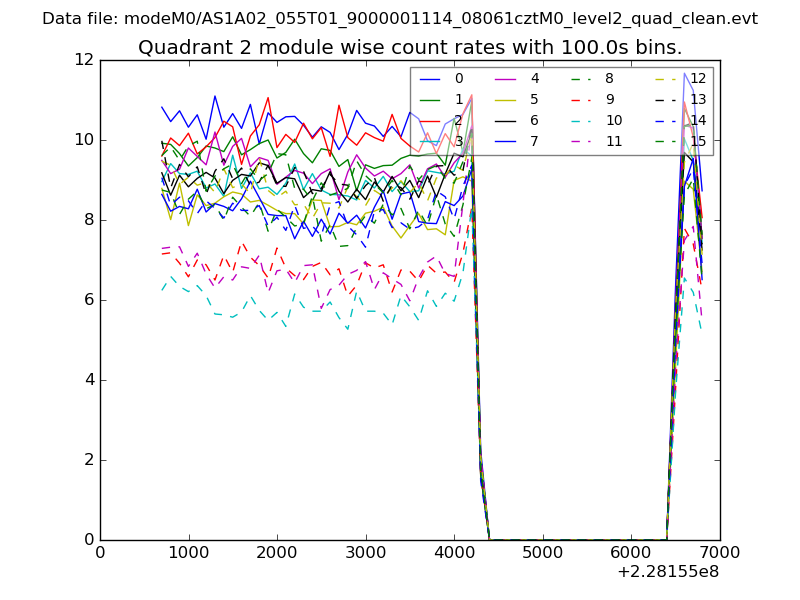
| Module-wise count rates for Quadrant B Data is divided into 100 sec bins |
 |
 |
| Module-wise count rates for Quadrant C Data is divided into 100 sec bins |
 |
 |
| Module-wise count rates for Quadrant D Data is divided into 100 sec bins |
 |
 |
| Parameter | Plot |
|---|---|
| CZT HV Monitor | 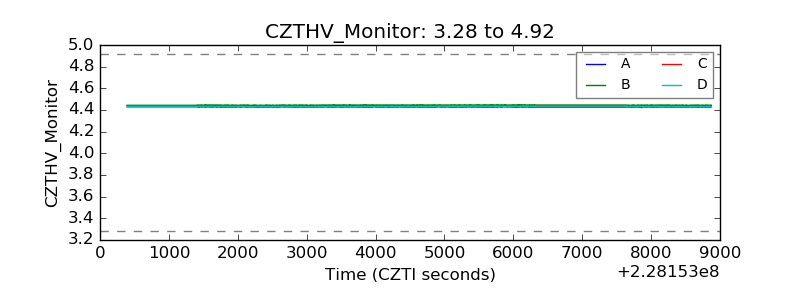 |
| D_VDD | 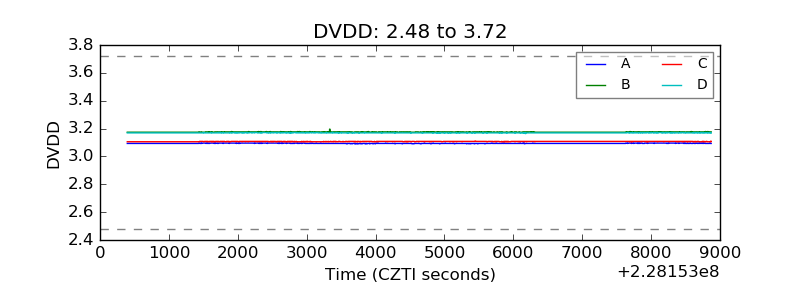 |
| Temperature 1 | 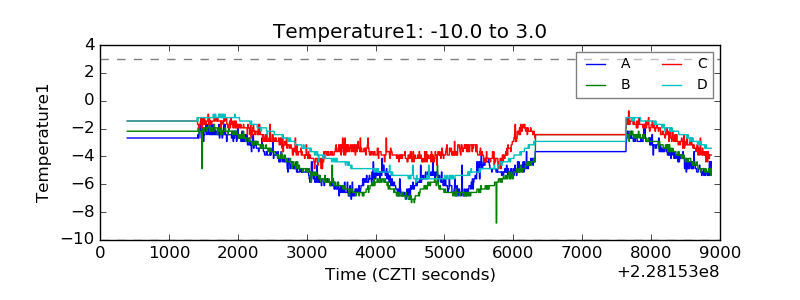 |
| Veto HV Monitor | 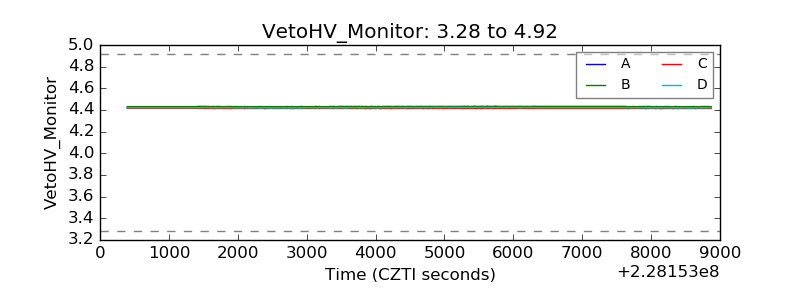 |
| Veto LLD | 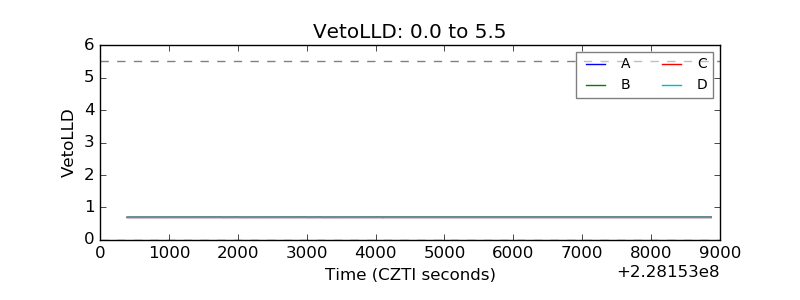 |
| Alpha Counter | 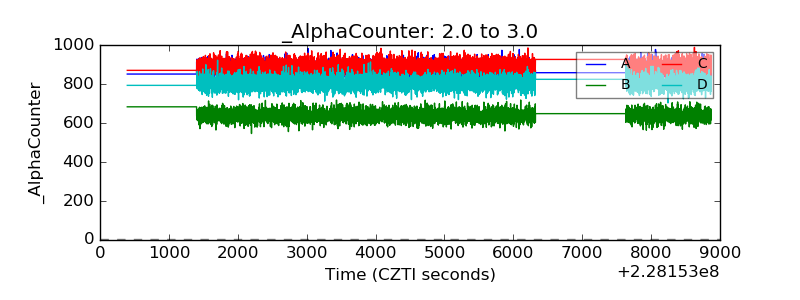 |
| _CPM_Rate | 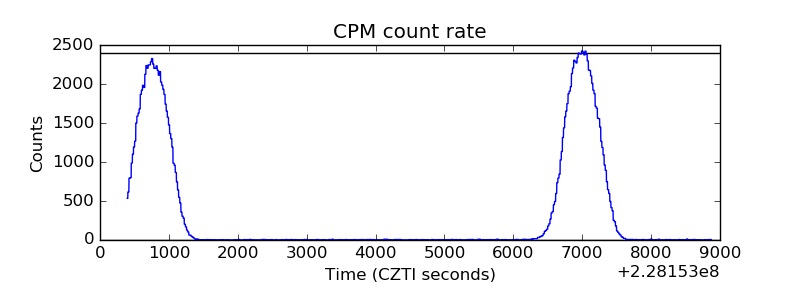 |
| CZT Counter | 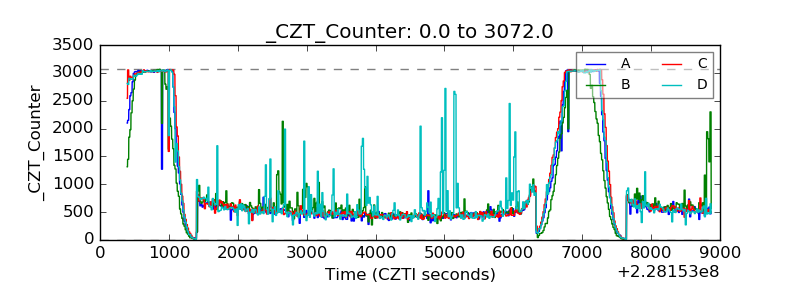 |
| +2.5 Volts monitor | 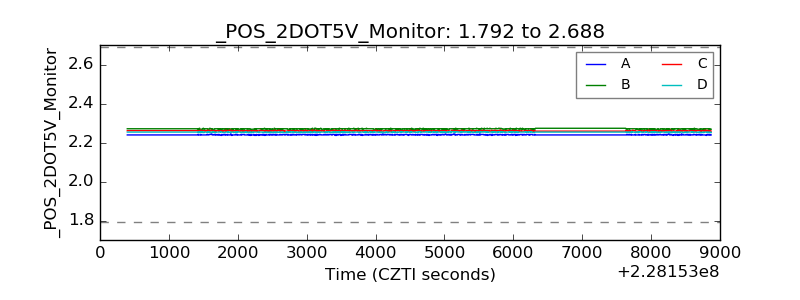 |
| +5 Volts monitor | 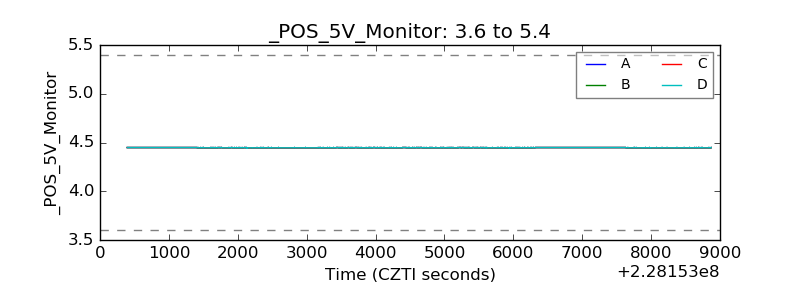 |
| _ROLL_ROT | 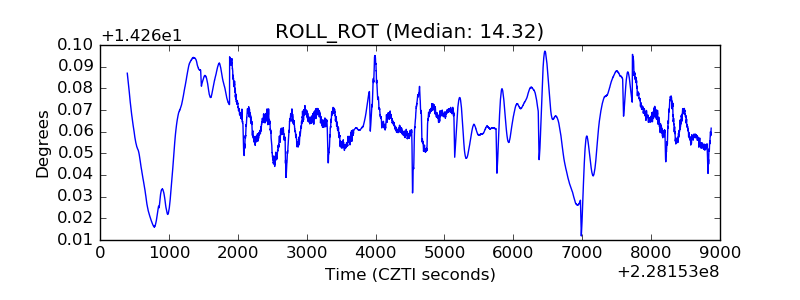 |
| _Roll_DEC | 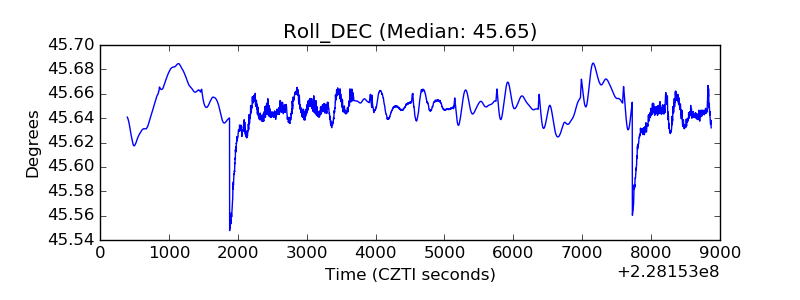 |
| _Roll_RA | 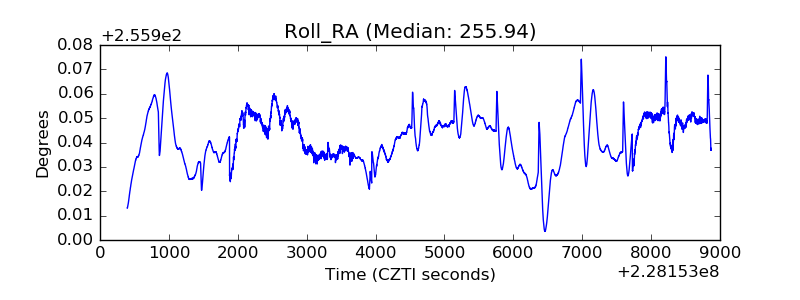 |
| Veto Counter | 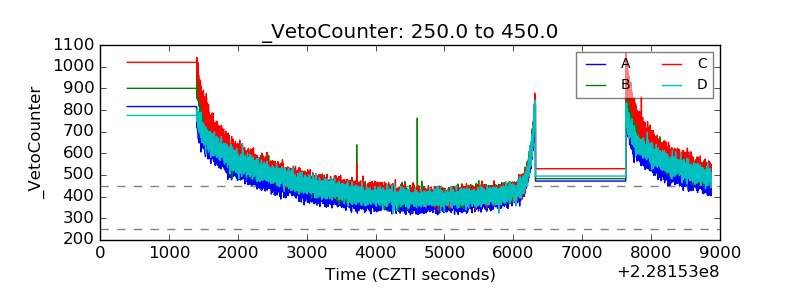 |