| Param | Original file | Final file |
|---|---|---|
| Filename | modeM0/AS1A02_055T01_9000001114_08062cztM0_level2.evt | modeM0/AS1A02_055T01_9000001114_08062cztM0_level2_quad_clean.evt |
| Size (bytes) | 436,803,840 | 96,071,040 |
| Size | 416.6 MB | 91.6 MB |
| Events in quadrant A | 3,024,562 | 613,128 |
| Events in quadrant B | 3,537,417 | 627,287 |
| Events in quadrant C | 3,086,360 | 638,024 |
| Events in quadrant D | 3,164,072 | 603,482 |
| Mode M0 | |||
|---|---|---|---|
| Quadrant | BADHDUFLAG | Total packets | Discarded packets |
| A | 0 | 13003 | 3 |
| B | 0 | 14698 | 2 |
| C | 0 | 13134 | 2 |
| D | 0 | 13437 | 2 |
| Mode M9 | |||
|---|---|---|---|
| Quadrant | BADHDUFLAG | Total packets | Discarded packets |
| A | 0 | 21 | 0 |
| B | 0 | 21 | 0 |
| C | 0 | 21 | 0 |
| D | 0 | 22 | 0 |
| Mode SS | |||
|---|---|---|---|
| Quadrant | BADHDUFLAG | Total packets | Discarded packets |
| A | 0 | 126 | 0 |
| B | 0 | 126 | 0 |
| C | 0 | 126 | 0 |
| D | 0 | 126 | 0 |
| Quadrant | Total seconds | Saturated seconds | Saturation percentage |
|---|---|---|---|
| A | 6127 | 35 | 0.571242% |
| B | 6127 | 129 | 2.105435% |
| C | 6127 | 32 | 0.522278% |
| D | 6127 | 53 | 0.865024% |
Noise dominated data is calculated using 1-second bins in cleaned event files. If a bin has >2000 counts, and if more than 50% of those come from <1% of pixels, then it is considered to be noise-dominated and hence unusable.
| Quadrant | # 1 sec bins | Bins with >0 counts | Bins with >2000 counts | High rate bins dominated by noise | Noise dominated (total time) | Noise dominated (detector-on time) | Marked lightcurve |
|---|---|---|---|---|---|---|---|
| A | 7512 | 6129 | 0 | 0 | 0.00% | 0.00% |  |
| B | 7512 | 6129 | 47 | 47 | 0.63% | 0.77% |  |
| C | 7512 | 6129 | 0 | 0 | 0.00% | 0.00% | 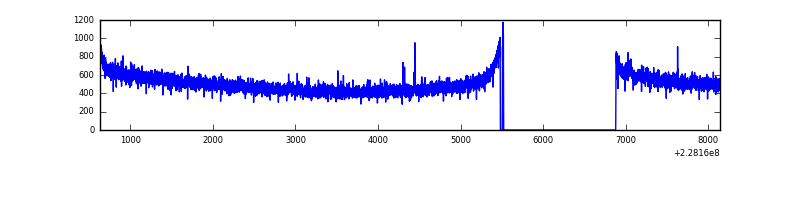 |
| D | 7512 | 6129 | 18 | 18 | 0.24% | 0.29% | 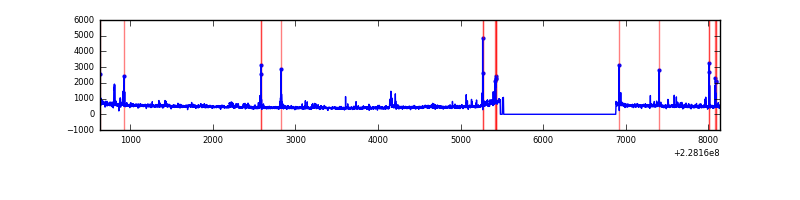 |
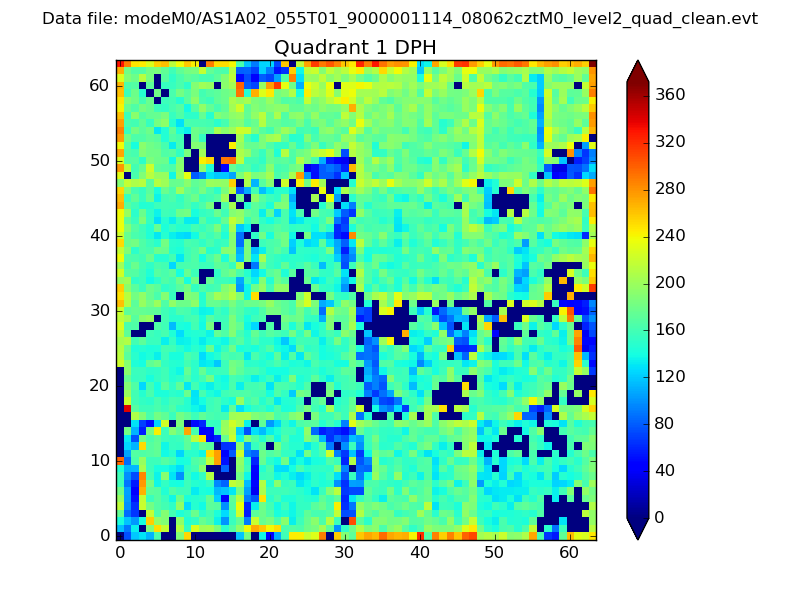
Top three noisy pixels from each quadrant. If the there are fewer than three noisy pixels in the level2.evt file, extra rows are filled as -1
| Pixel properties | Quadrant properties | ||||||
|---|---|---|---|---|---|---|---|
| Quadrant | DetID | PixID | Counts | Sigma | Mean | Median | Sigma |
| A | 0 | 226 | 7431 | 42.03 | 785 | 769 | 158.5 |
| A | 12 | 194 | 6837 | 38.29 | 785 | 769 | 158.5 |
| A | 13 | 254 | 3719 | 18.61 | 785 | 769 | 158.5 |
| B | 4 | 239 | 268130 | 1799.09 | 794 | 776 | 148.6 |
| B | 11 | 51 | 102951 | 687.56 | 794 | 776 | 148.6 |
| B | 4 | 81 | 32584 | 214.04 | 794 | 776 | 148.6 |
| C | 1 | 16 | 17523 | 93.34 | 786 | 791 | 179.3 |
| C | 13 | 61 | 6032 | 29.24 | 786 | 791 | 179.3 |
| C | 8 | 222 | 3014 | 12.4 | 786 | 791 | 179.3 |
| D | 1 | 52 | 80965 | 424.59 | 776 | 754 | 188.9 |
| D | 1 | 83 | 73360 | 384.33 | 776 | 754 | 188.9 |
| D | 2 | 234 | 20398 | 103.98 | 776 | 754 | 188.9 |
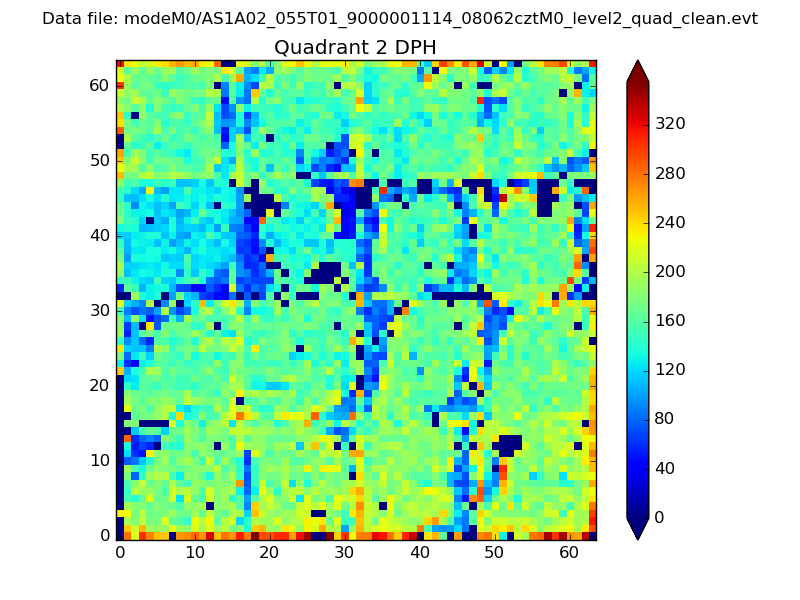
Histogram calculated using DETX and DETY for each event in the final _common_clean file
| Quadrant A | 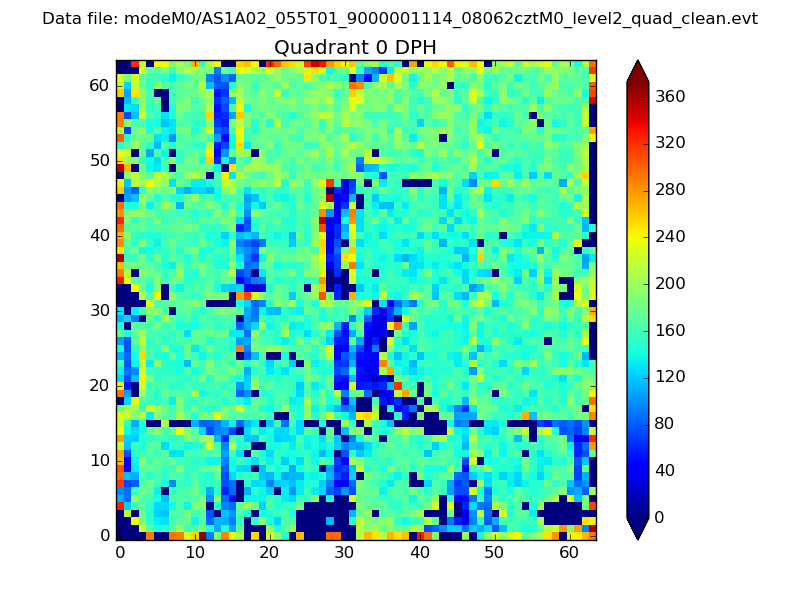 |
 |
Quadrant B |
|---|---|---|---|
| Quadrant D | 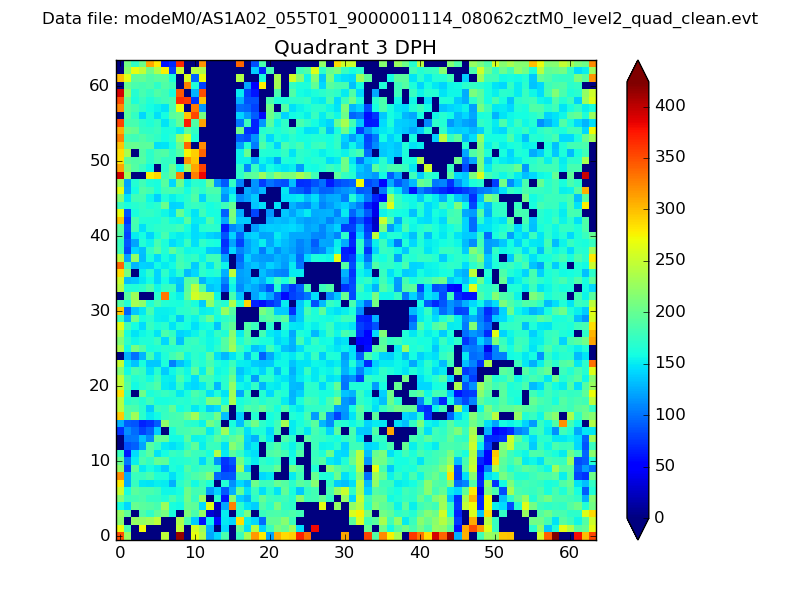 |
 |
Quadrant C |
| Plot type | Count rate plots | Images |
|---|---|---|
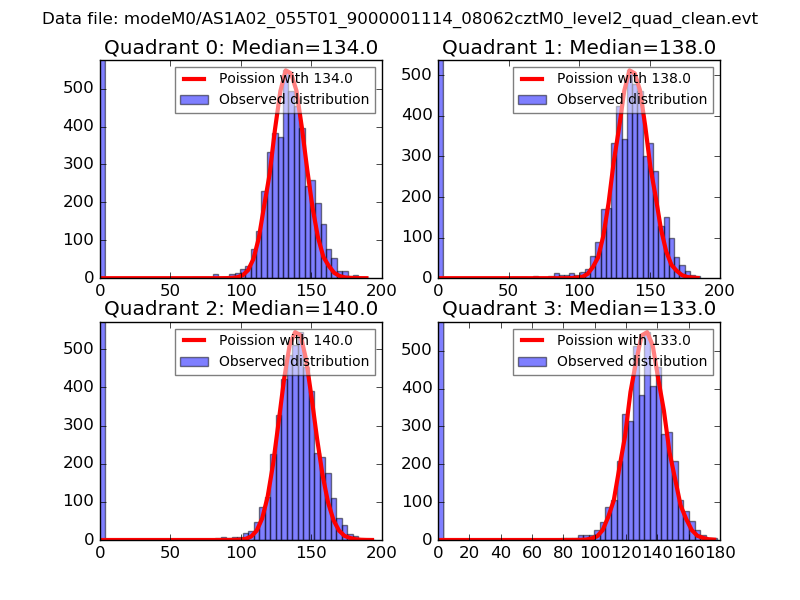
| Comparison with Poisson distribution Blue bars denote a histogram of data divided into 1 sec bins. Red curve is a Poisson curve with rate = median count rate of data. |
 |
 |
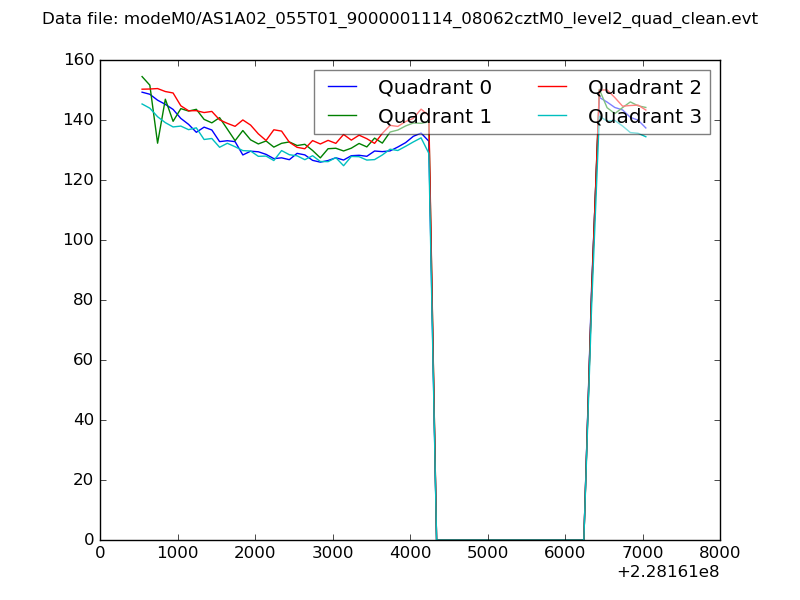
| Quadrant-wise count rates Data is divided into 100 sec bins |
 |
|
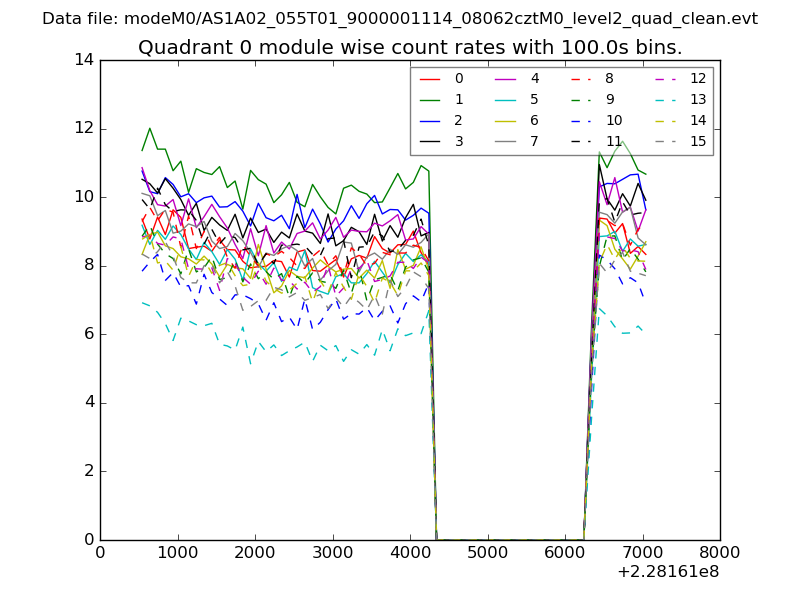
| Module-wise count rates for Quadrant A Data is divided into 100 sec bins |
 |
 |
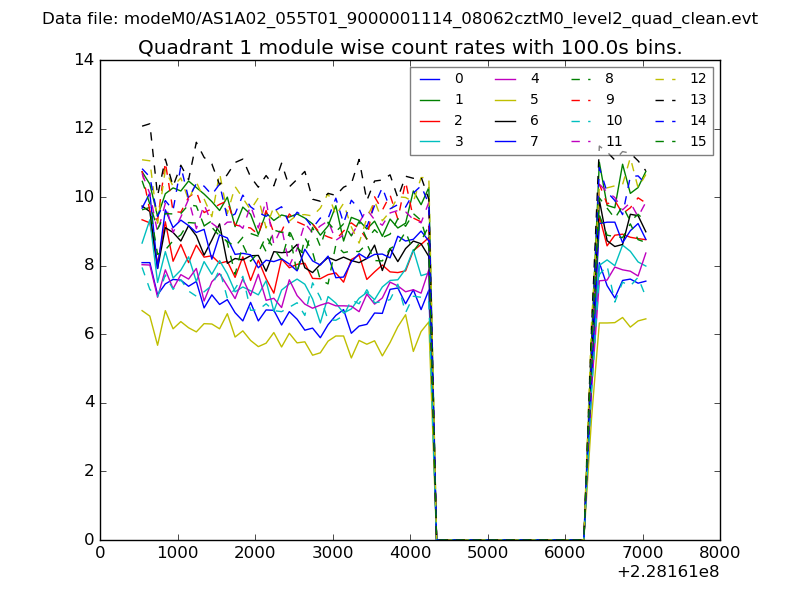
| Module-wise count rates for Quadrant B Data is divided into 100 sec bins |
 |
 |
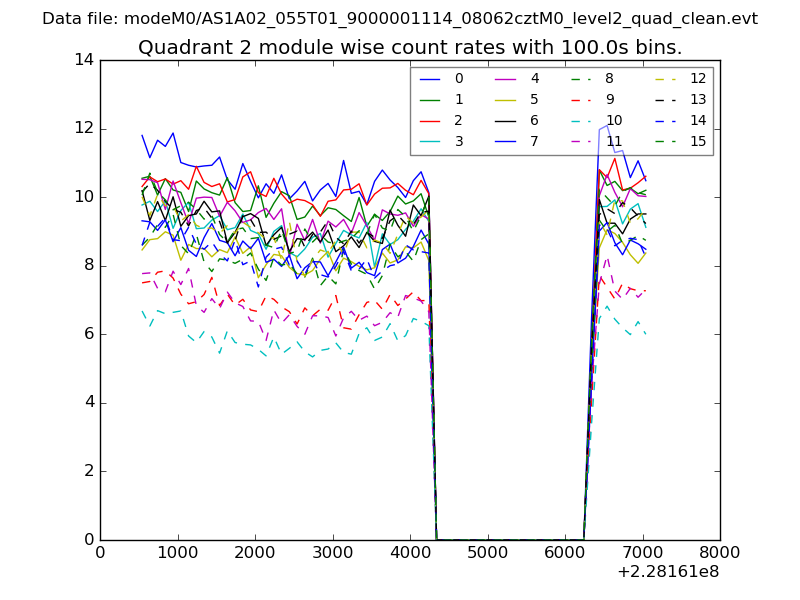
| Module-wise count rates for Quadrant C Data is divided into 100 sec bins |
 |
 |
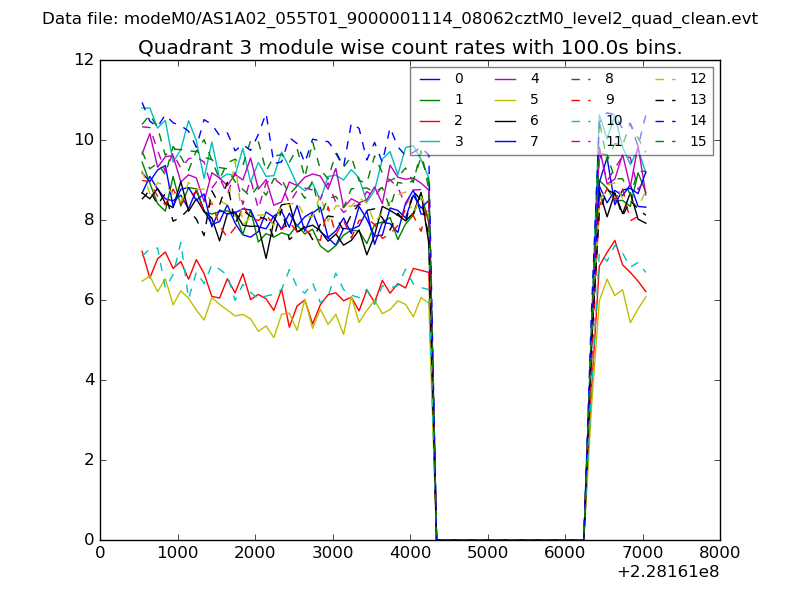
| Module-wise count rates for Quadrant D Data is divided into 100 sec bins |
 |
 |
| Parameter | Plot |
|---|---|
| CZT HV Monitor | 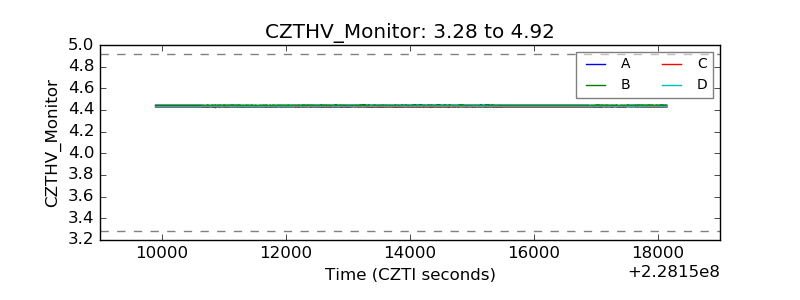 |
| D_VDD | 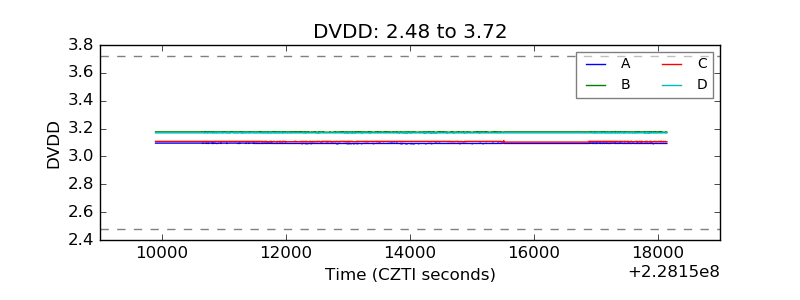 |
| Temperature 1 |  |
| Veto HV Monitor | 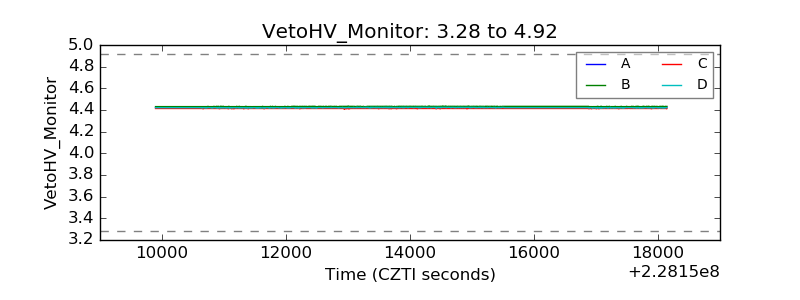 |
| Veto LLD | 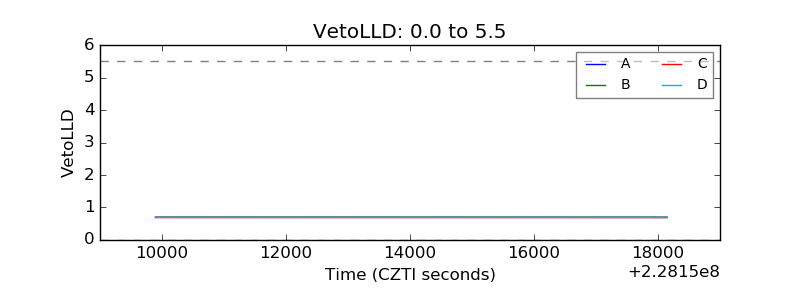 |
| Alpha Counter | 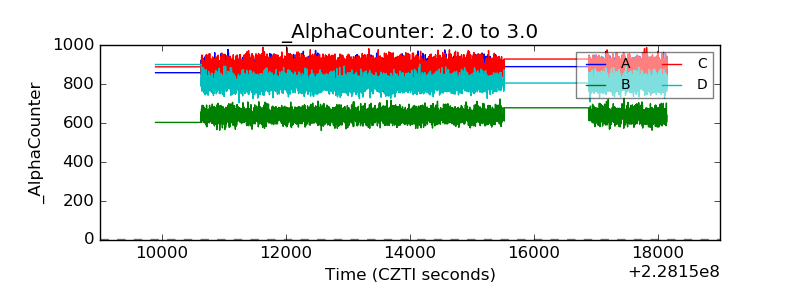 |
| _CPM_Rate | 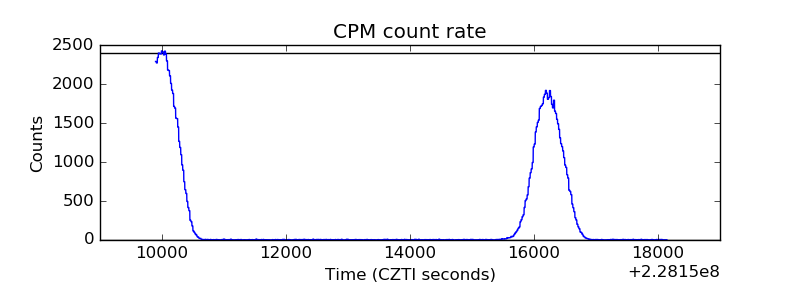 |
| CZT Counter | 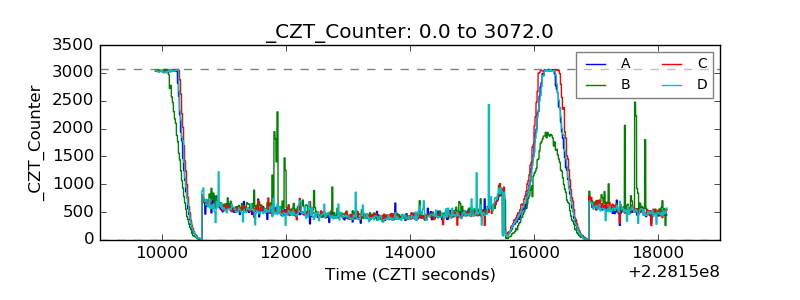 |
| +2.5 Volts monitor | 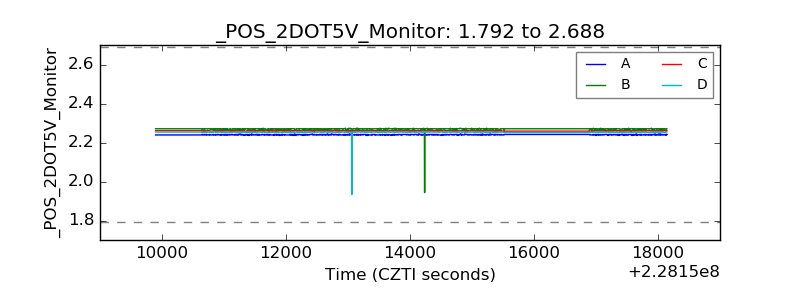 |
| +5 Volts monitor | 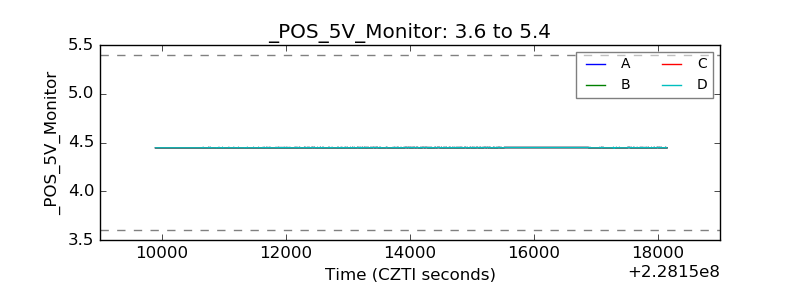 |
| _ROLL_ROT | 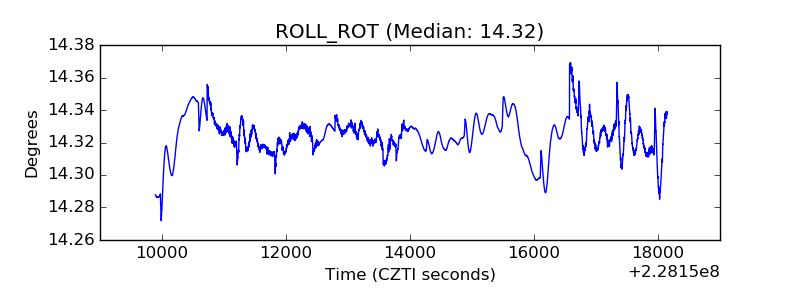 |
| _Roll_DEC | 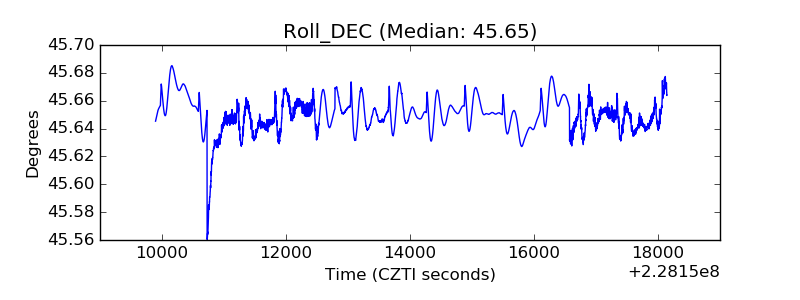 |
| _Roll_RA | 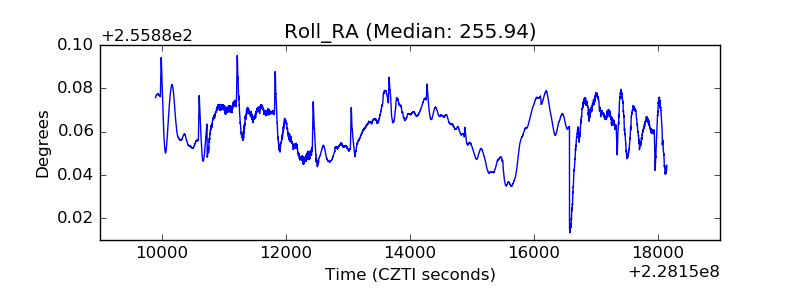 |
| Veto Counter | 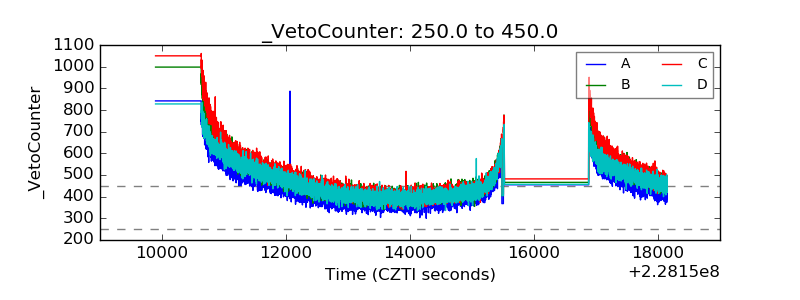 |