| Param | Original file | Final file |
|---|---|---|
| Filename | modeM0/AS1A02_055T01_9000001114_08063cztM0_level2.evt | modeM0/AS1A02_055T01_9000001114_08063cztM0_level2_quad_clean.evt |
| Size (bytes) | 465,897,600 | 106,139,520 |
| Size | 444.3 MB | 101.2 MB |
| Events in quadrant A | 3,200,204 | 678,564 |
| Events in quadrant B | 3,694,127 | 696,329 |
| Events in quadrant C | 3,269,949 | 707,266 |
| Events in quadrant D | 3,495,333 | 670,644 |
| Mode M0 | |||
|---|---|---|---|
| Quadrant | BADHDUFLAG | Total packets | Discarded packets |
| A | 0 | 13929 | 3 |
| B | 0 | 15416 | 2 |
| C | 0 | 14020 | 2 |
| D | 0 | 14914 | 2 |
| Mode M9 | |||
|---|---|---|---|
| Quadrant | BADHDUFLAG | Total packets | Discarded packets |
| A | 0 | 27 | 0 |
| B | 0 | 27 | 0 |
| C | 0 | 27 | 0 |
| D | 0 | 27 | 0 |
| Mode SS | |||
|---|---|---|---|
| Quadrant | BADHDUFLAG | Total packets | Discarded packets |
| A | 0 | 138 | 0 |
| B | 0 | 138 | 0 |
| C | 0 | 138 | 0 |
| D | 0 | 138 | 0 |
| Quadrant | Total seconds | Saturated seconds | Saturation percentage |
|---|---|---|---|
| A | 6623 | 74 | 1.117318% |
| B | 6623 | 193 | 2.914087% |
| C | 6623 | 68 | 1.026725% |
| D | 6623 | 143 | 2.159142% |
Noise dominated data is calculated using 1-second bins in cleaned event files. If a bin has >2000 counts, and if more than 50% of those come from <1% of pixels, then it is considered to be noise-dominated and hence unusable.
| Quadrant | # 1 sec bins | Bins with >0 counts | Bins with >2000 counts | High rate bins dominated by noise | Noise dominated (total time) | Noise dominated (detector-on time) | Marked lightcurve |
|---|---|---|---|---|---|---|---|
| A | 9288 | 6626 | 0 | 0 | 0.00% | 0.00% | 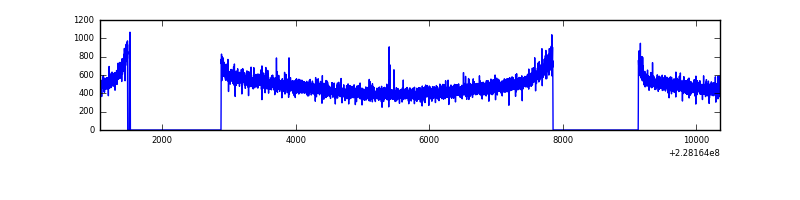 |
| B | 9288 | 6626 | 48 | 48 | 0.52% | 0.72% | 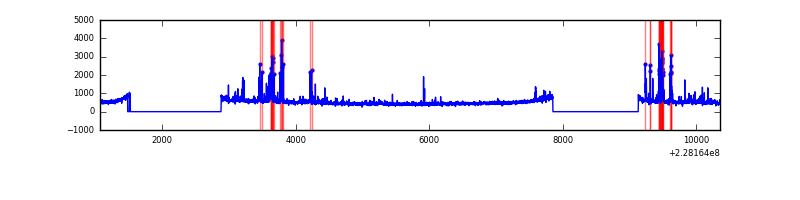 |
| C | 9288 | 6626 | 0 | 0 | 0.00% | 0.00% | 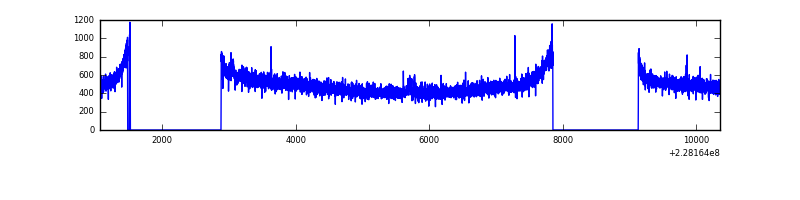 |
| D | 9288 | 6626 | 54 | 54 | 0.58% | 0.81% | 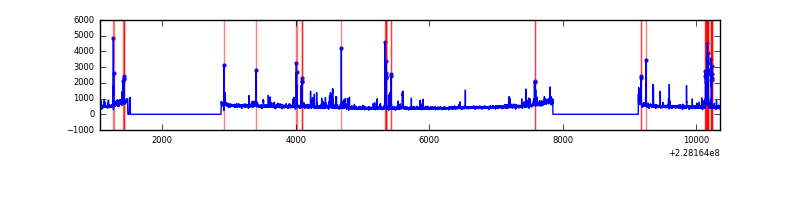 |
Top three noisy pixels from each quadrant. If the there are fewer than three noisy pixels in the level2.evt file, extra rows are filled as -1
| Pixel properties | Quadrant properties | ||||||
|---|---|---|---|---|---|---|---|
| Quadrant | DetID | PixID | Counts | Sigma | Mean | Median | Sigma |
| A | 0 | 226 | 7766 | 41.67 | 829 | 811 | 166.9 |
| A | 12 | 194 | 7298 | 38.87 | 829 | 811 | 166.9 |
| A | 13 | 254 | 4390 | 21.44 | 829 | 811 | 166.9 |
| B | 4 | 239 | 278015 | 1748.09 | 840 | 820 | 158.6 |
| B | 4 | 81 | 79771 | 497.89 | 840 | 820 | 158.6 |
| B | 11 | 51 | 35616 | 219.44 | 840 | 820 | 158.6 |
| C | 1 | 16 | 21763 | 109.98 | 830 | 835 | 190.3 |
| C | 6 | 15 | 9689 | 46.53 | 830 | 835 | 190.3 |
| C | 13 | 61 | 6311 | 28.78 | 830 | 835 | 190.3 |
| D | 1 | 52 | 174647 | 805.22 | 812 | 795 | 215.9 |
| D | 1 | 83 | 126418 | 581.84 | 812 | 795 | 215.9 |
| D | 12 | 233 | 47516 | 216.39 | 812 | 795 | 215.9 |
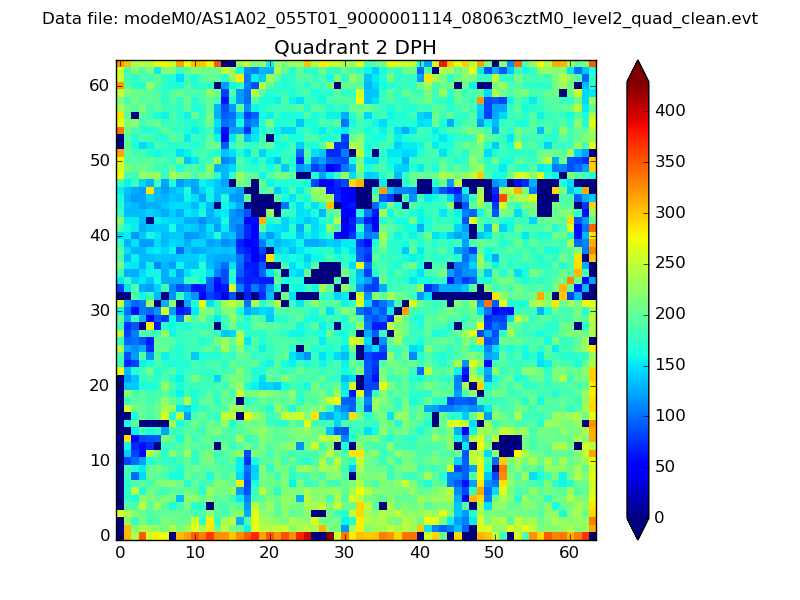
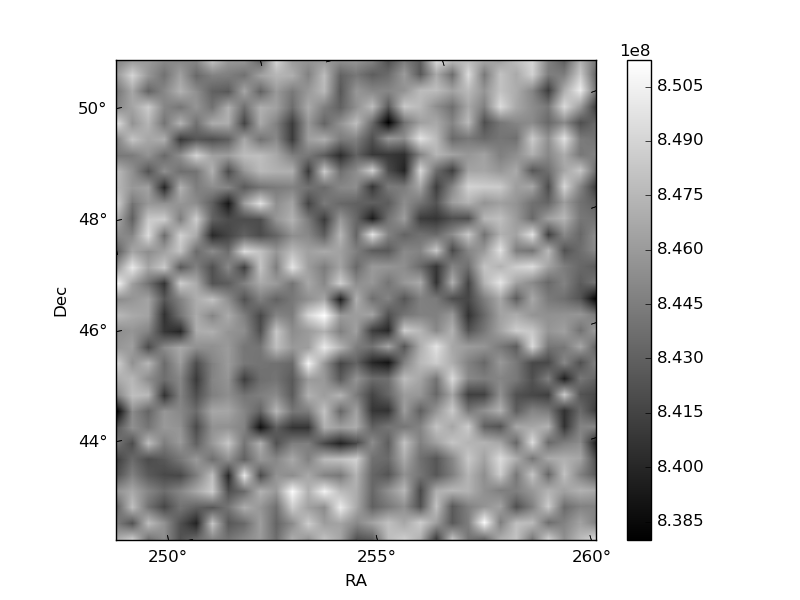
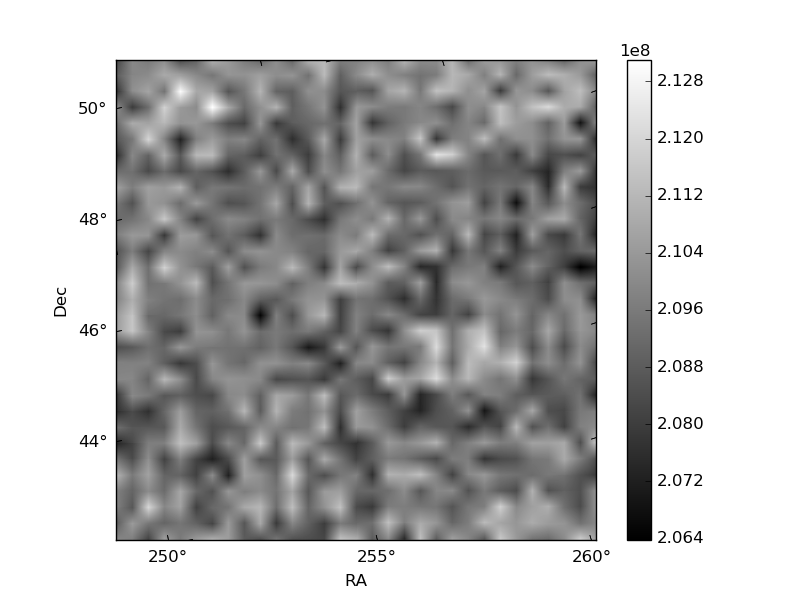
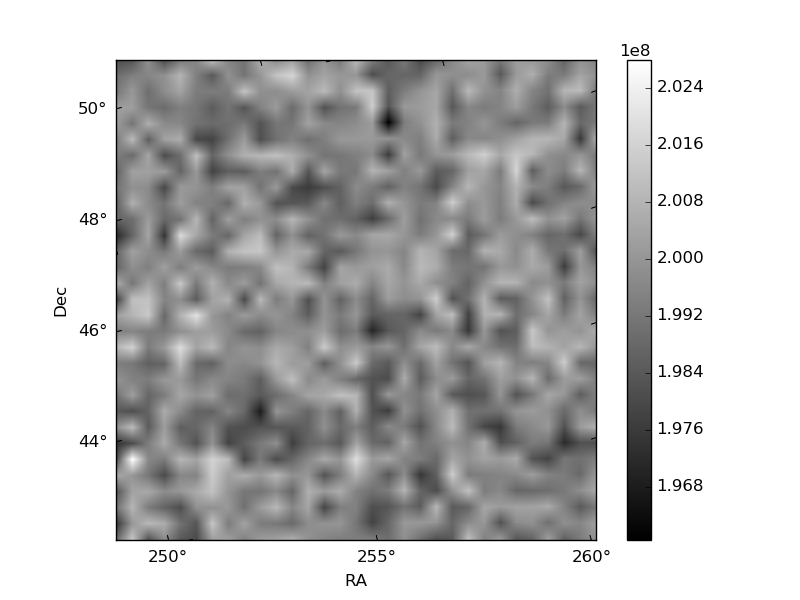
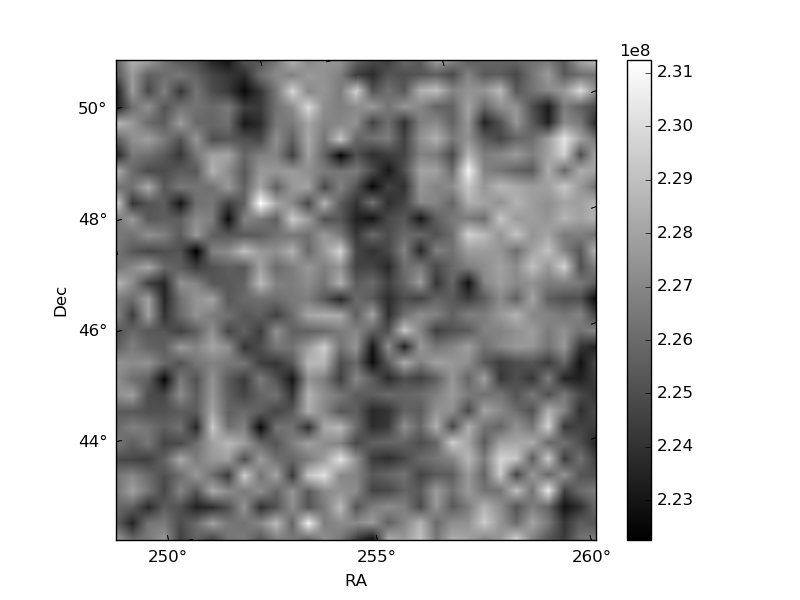
Histogram calculated using DETX and DETY for each event in the final _common_clean file
| Quadrant A | 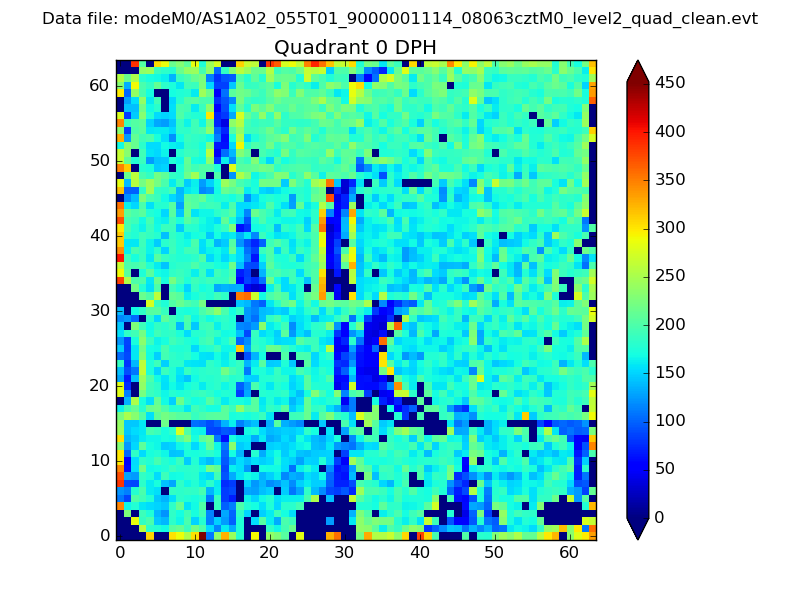 |
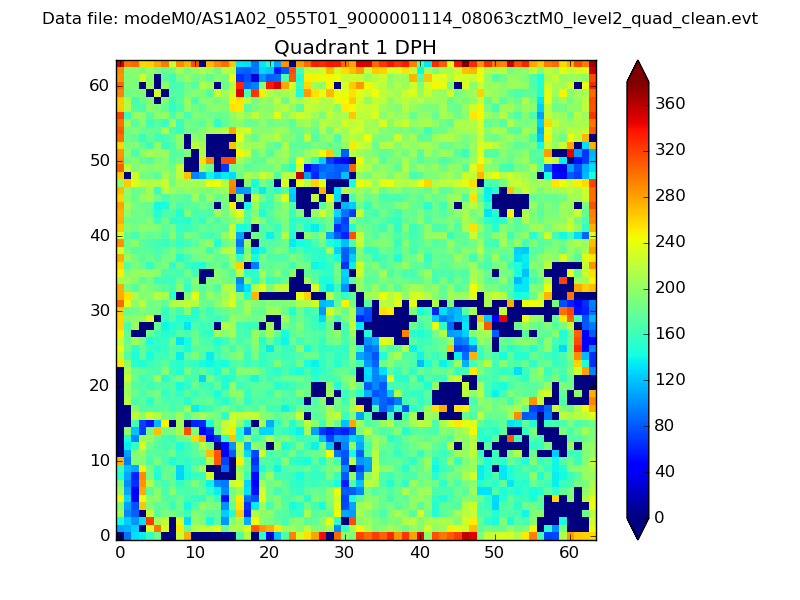 |
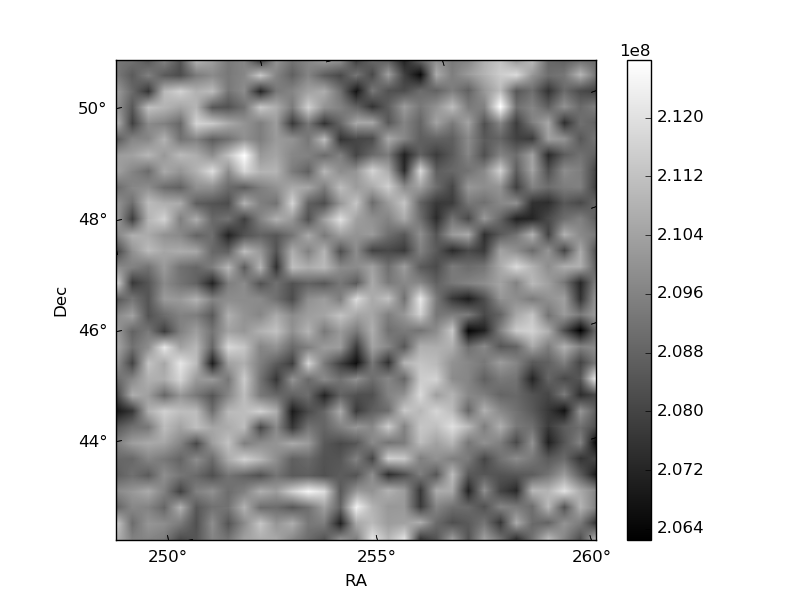
Quadrant B |
|---|---|---|---|
| Quadrant D | 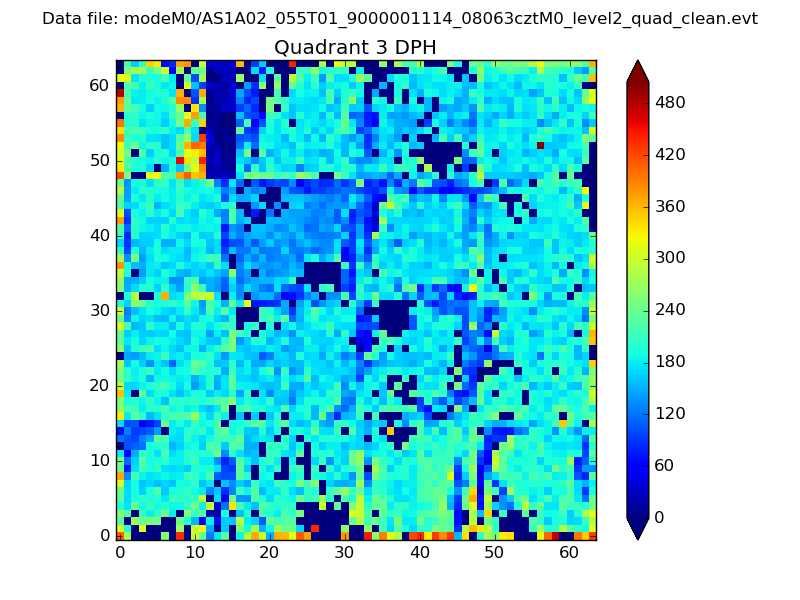 |
 |
Quadrant C |
| Plot type | Count rate plots | Images |
|---|---|---|
| Comparison with Poisson distribution Blue bars denote a histogram of data divided into 1 sec bins. Red curve is a Poisson curve with rate = median count rate of data. |
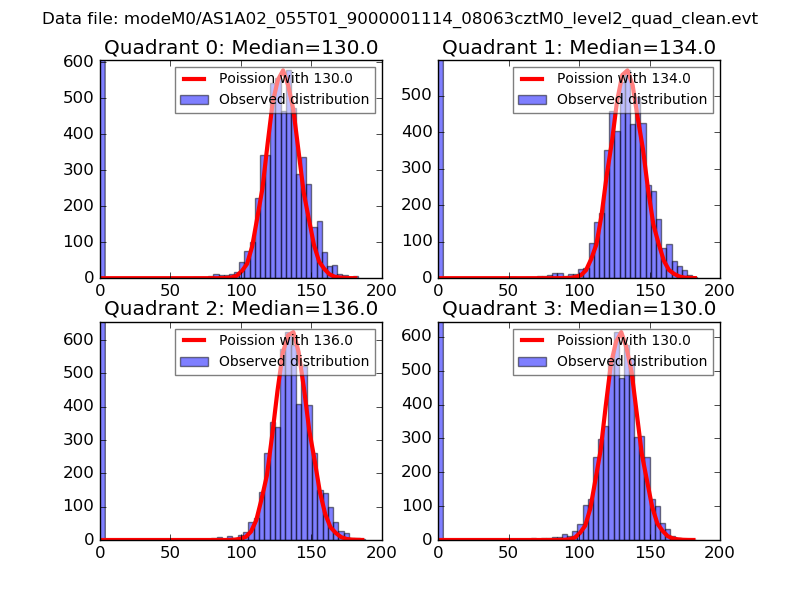 |
 |
| Quadrant-wise count rates Data is divided into 100 sec bins |
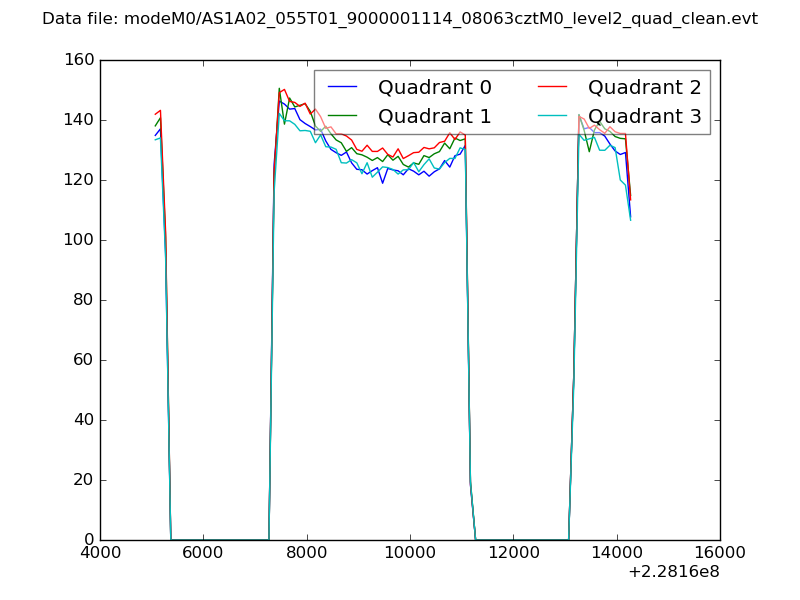 |
|
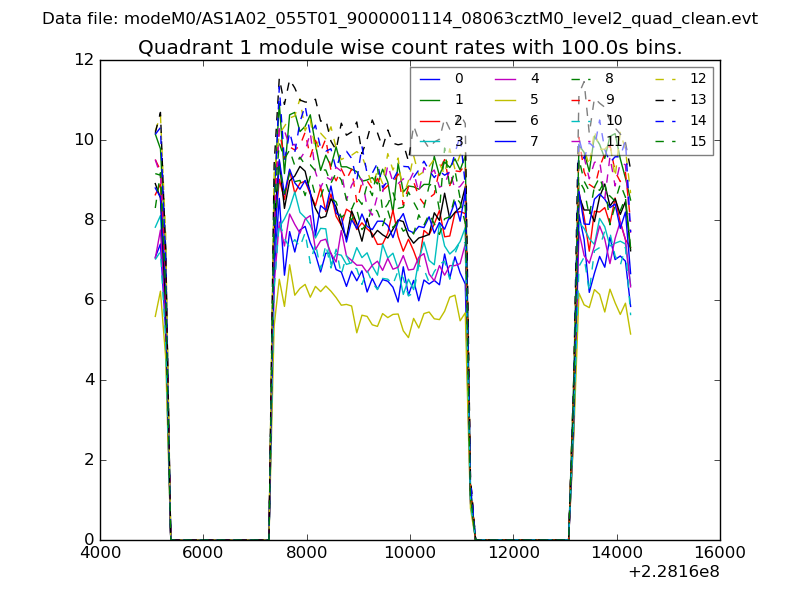
| Module-wise count rates for Quadrant A Data is divided into 100 sec bins |
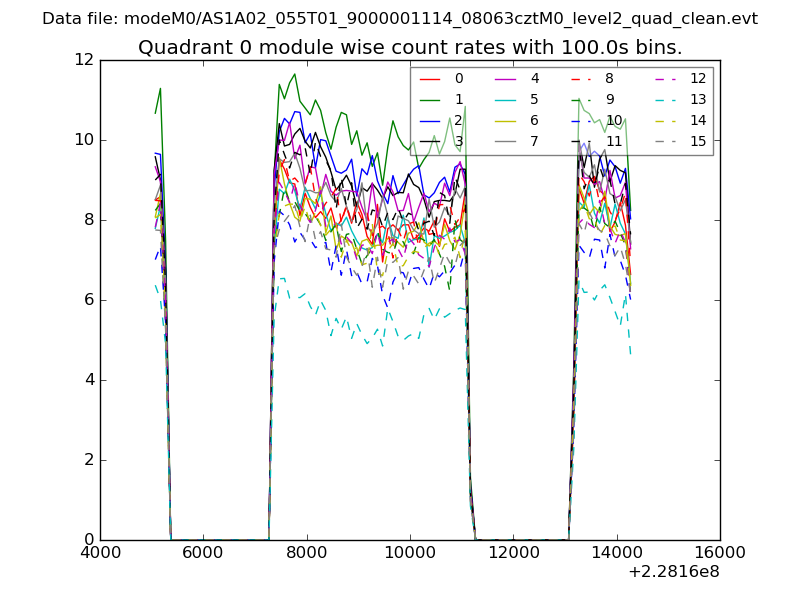 |
 |
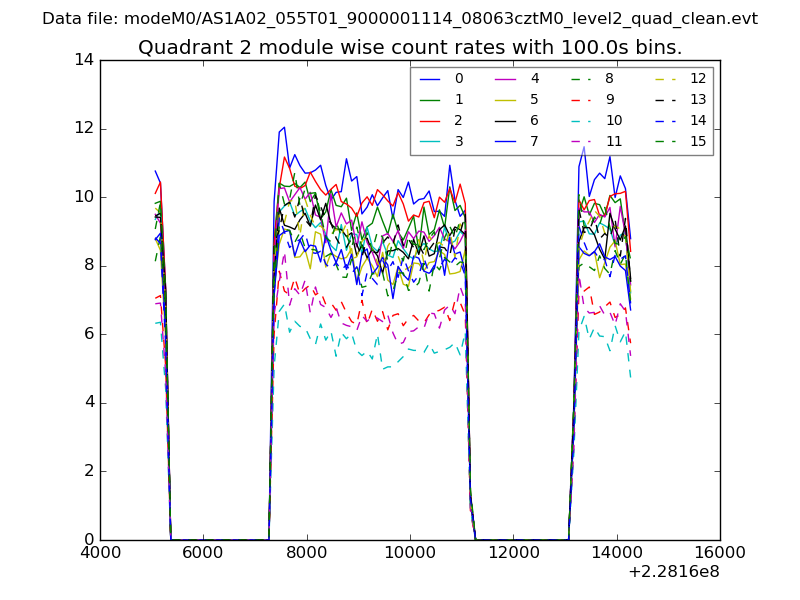
| Module-wise count rates for Quadrant B Data is divided into 100 sec bins |
 |
 |
| Module-wise count rates for Quadrant C Data is divided into 100 sec bins |
 |
 |
| Module-wise count rates for Quadrant D Data is divided into 100 sec bins |
 |
 |
| Parameter | Plot |
|---|---|
| CZT HV Monitor | 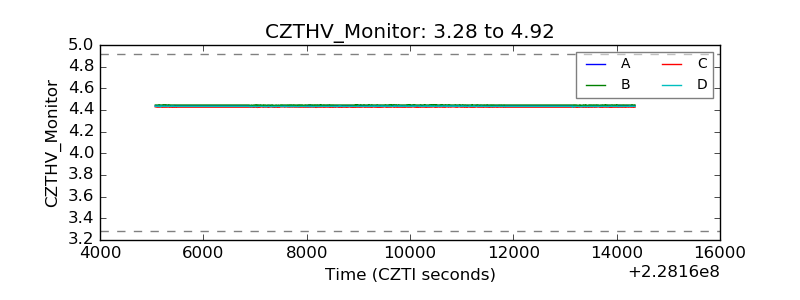 |
| D_VDD | 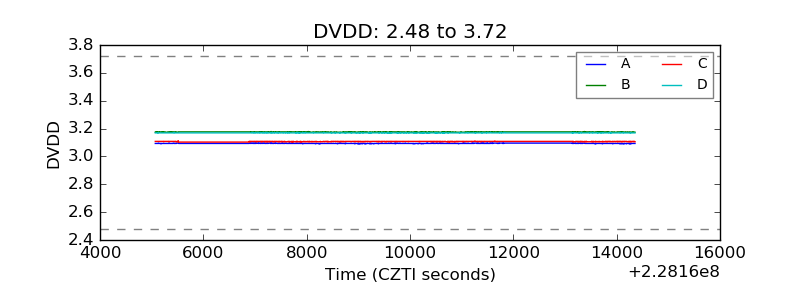 |
| Temperature 1 | 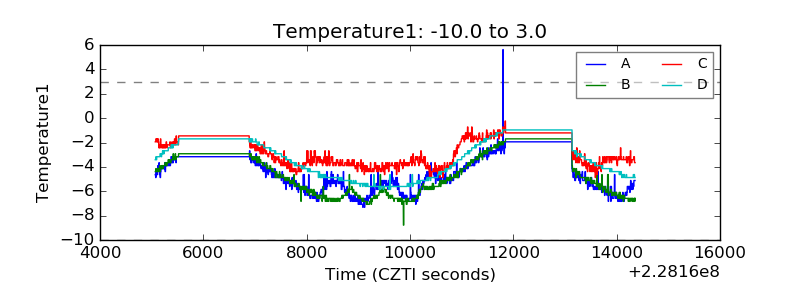 |
| Veto HV Monitor | 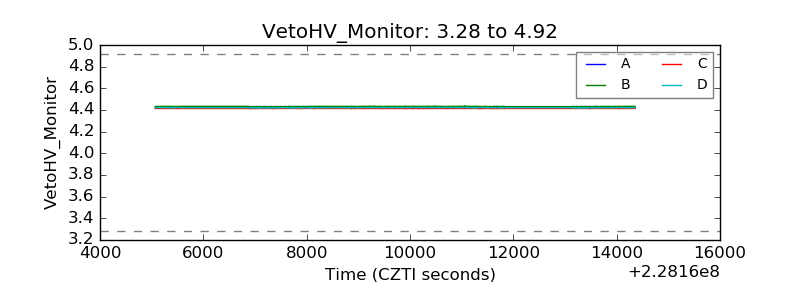 |
| Veto LLD |  |
| Alpha Counter | 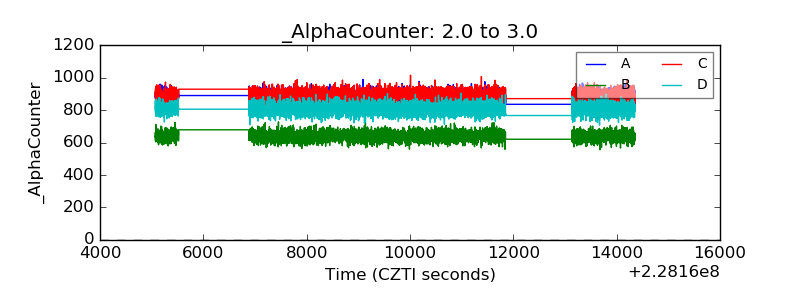 |
| _CPM_Rate | 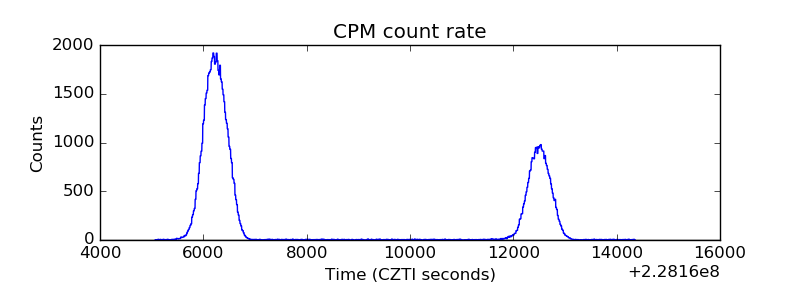 |
| CZT Counter | 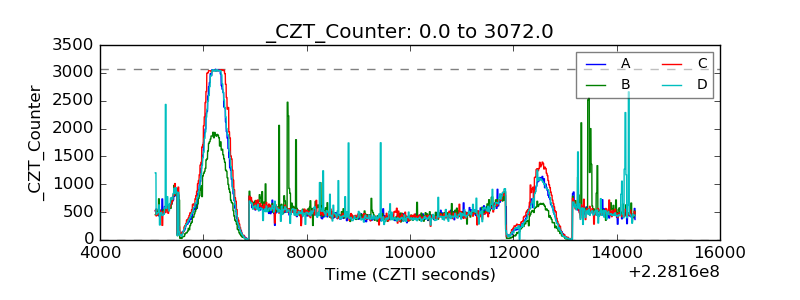 |
| +2.5 Volts monitor |  |
| +5 Volts monitor | 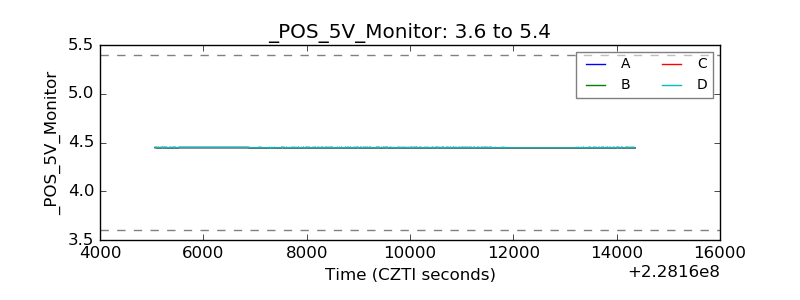 |
| _ROLL_ROT | 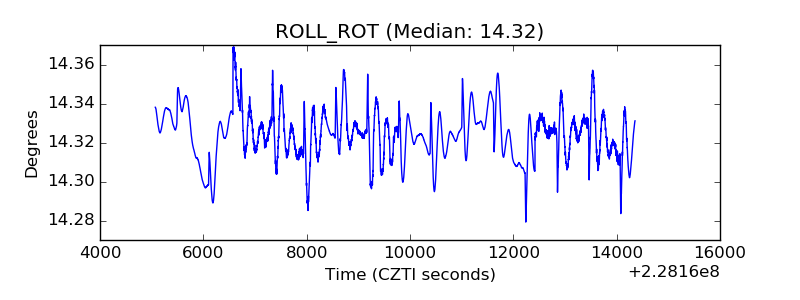 |
| _Roll_DEC | 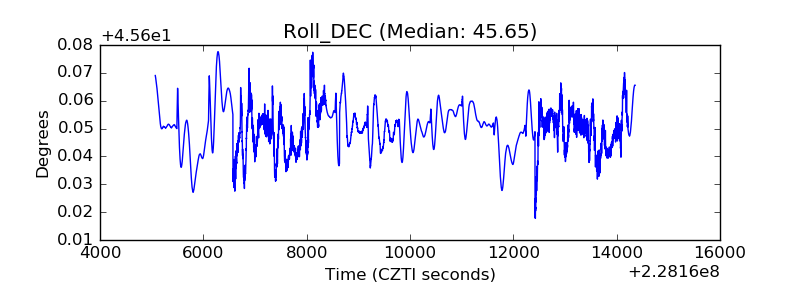 |
| _Roll_RA | 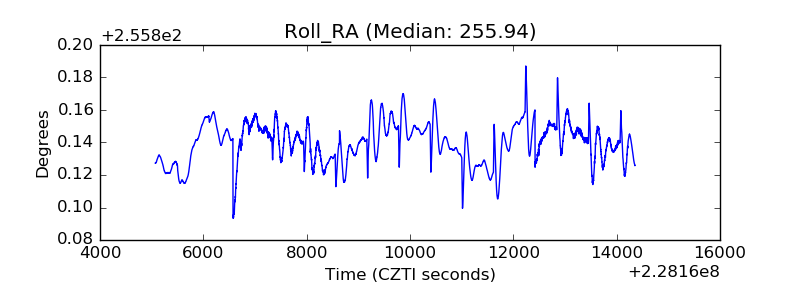 |
| Veto Counter | 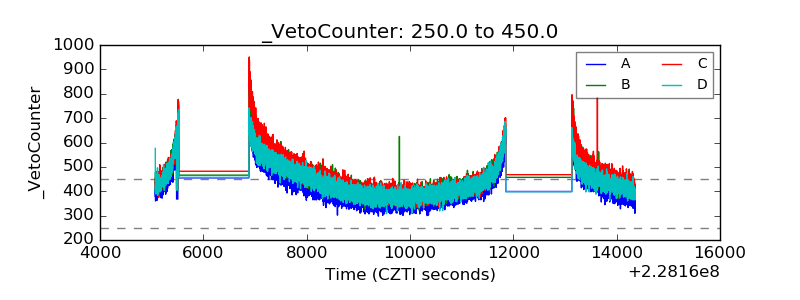 |