| Param | Original file | Final file |
|---|---|---|
| Filename | modeM0/AS1A02_055T01_9000001114_08064cztM0_level2.evt | modeM0/AS1A02_055T01_9000001114_08064cztM0_level2_quad_clean.evt |
| Size (bytes) | 467,962,560 | 101,488,320 |
| Size | 446.3 MB | 96.8 MB |
| Events in quadrant A | 3,172,053 | 639,200 |
| Events in quadrant B | 3,664,958 | 658,790 |
| Events in quadrant C | 3,231,921 | 665,613 |
| Events in quadrant D | 3,636,811 | 631,825 |
| Mode M0 | |||
|---|---|---|---|
| Quadrant | BADHDUFLAG | Total packets | Discarded packets |
| A | 0 | 14264 | 3 |
| B | 0 | 15587 | 2 |
| C | 0 | 14244 | 2 |
| D | 0 | 15759 | 2 |
| Mode M9 | |||
|---|---|---|---|
| Quadrant | BADHDUFLAG | Total packets | Discarded packets |
| A | 0 | 23 | 0 |
| B | 0 | 23 | 0 |
| C | 0 | 23 | 0 |
| D | 0 | 23 | 0 |
| Mode SS | |||
|---|---|---|---|
| Quadrant | BADHDUFLAG | Total packets | Discarded packets |
| A | 0 | 142 | 0 |
| B | 0 | 142 | 0 |
| C | 0 | 142 | 0 |
| D | 0 | 142 | 0 |
| Quadrant | Total seconds | Saturated seconds | Saturation percentage |
|---|---|---|---|
| A | 6861 | 63 | 0.918233% |
| B | 6861 | 181 | 2.638099% |
| C | 6861 | 62 | 0.903658% |
| D | 6861 | 176 | 2.565224% |
Noise dominated data is calculated using 1-second bins in cleaned event files. If a bin has >2000 counts, and if more than 50% of those come from <1% of pixels, then it is considered to be noise-dominated and hence unusable.
| Quadrant | # 1 sec bins | Bins with >0 counts | Bins with >2000 counts | High rate bins dominated by noise | Noise dominated (total time) | Noise dominated (detector-on time) | Marked lightcurve |
|---|---|---|---|---|---|---|---|
| A | 9151 | 6863 | 0 | 0 | 0.00% | 0.00% | 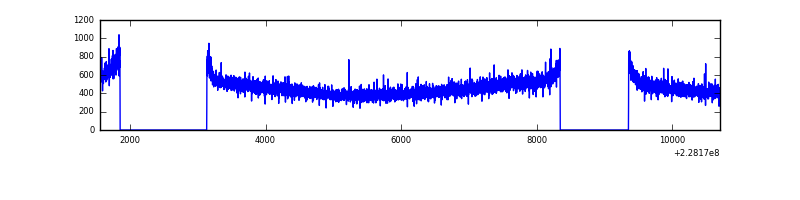 |
| B | 9151 | 6863 | 47 | 47 | 0.51% | 0.68% | 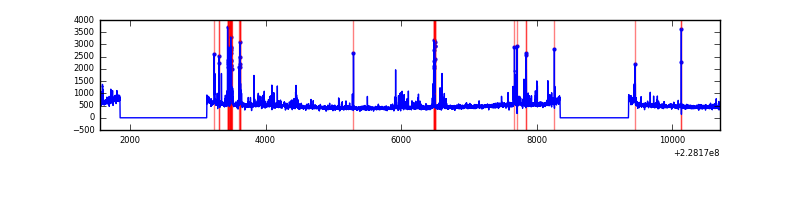 |
| C | 9151 | 6863 | 0 | 0 | 0.00% | 0.00% | 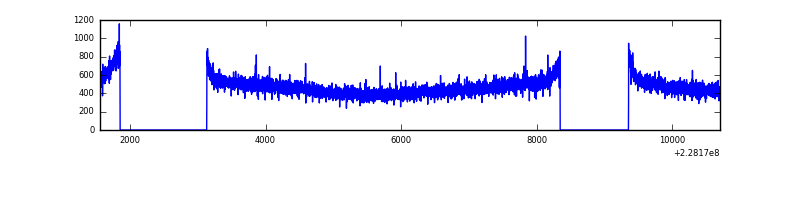 |
| D | 9151 | 6863 | 92 | 92 | 1.01% | 1.34% | 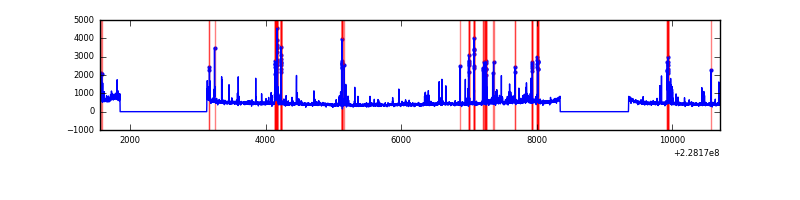 |
Top three noisy pixels from each quadrant. If the there are fewer than three noisy pixels in the level2.evt file, extra rows are filled as -1
| Pixel properties | Quadrant properties | ||||||
|---|---|---|---|---|---|---|---|
| Quadrant | DetID | PixID | Counts | Sigma | Mean | Median | Sigma |
| A | 0 | 226 | 7625 | 40.76 | 823 | 806 | 167.3 |
| A | 12 | 194 | 7285 | 38.73 | 823 | 806 | 167.3 |
| A | 13 | 254 | 3593 | 16.66 | 823 | 806 | 167.3 |
| B | 4 | 239 | 210618 | 1322.98 | 833 | 811 | 158.6 |
| B | 4 | 81 | 148684 | 932.44 | 833 | 811 | 158.6 |
| B | 0 | 214 | 24141 | 147.11 | 833 | 811 | 158.6 |
| C | 1 | 16 | 21755 | 109.99 | 822 | 827 | 190.3 |
| C | 13 | 61 | 6402 | 29.3 | 822 | 827 | 190.3 |
| C | 8 | 222 | 2463 | 8.6 | 822 | 827 | 190.3 |
| D | 1 | 83 | 257564 | 1249.85 | 800 | 779 | 205.5 |
| D | 1 | 52 | 237287 | 1151.16 | 800 | 779 | 205.5 |
| D | 2 | 14 | 36715 | 174.91 | 800 | 779 | 205.5 |
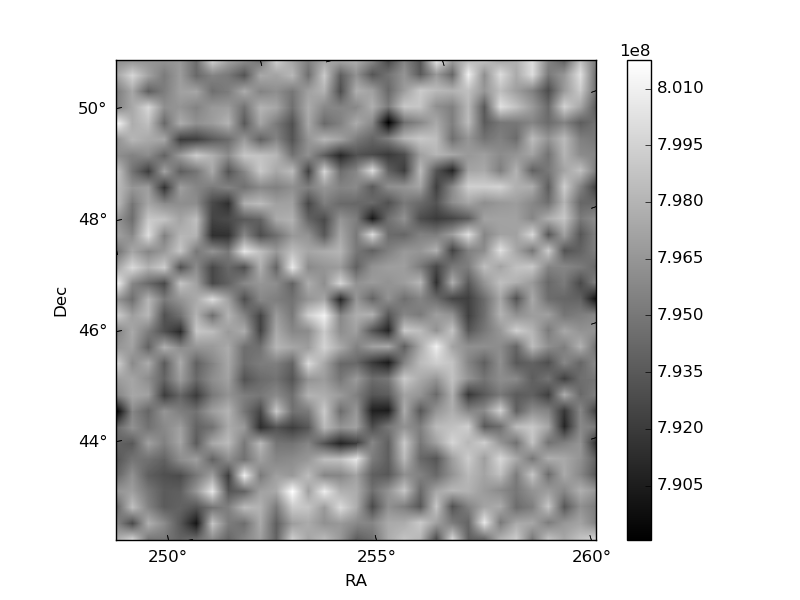
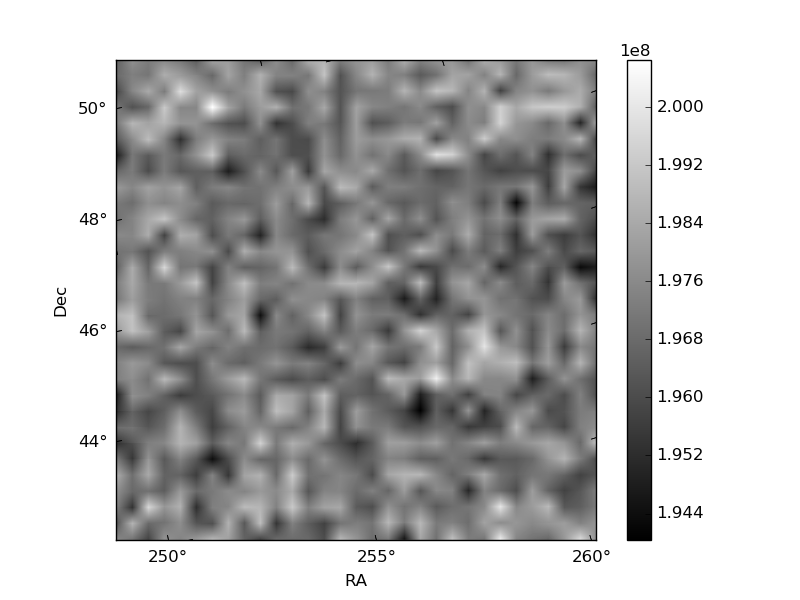
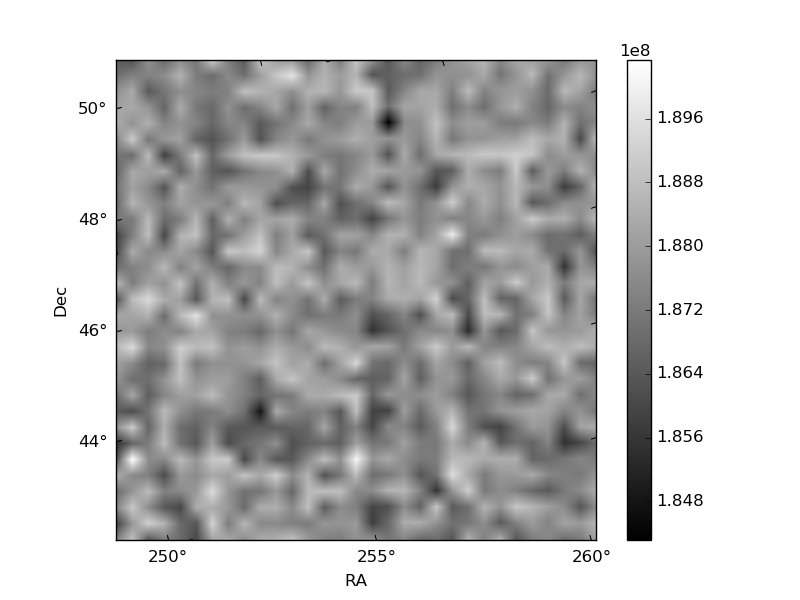
Histogram calculated using DETX and DETY for each event in the final _common_clean file
| Quadrant A | 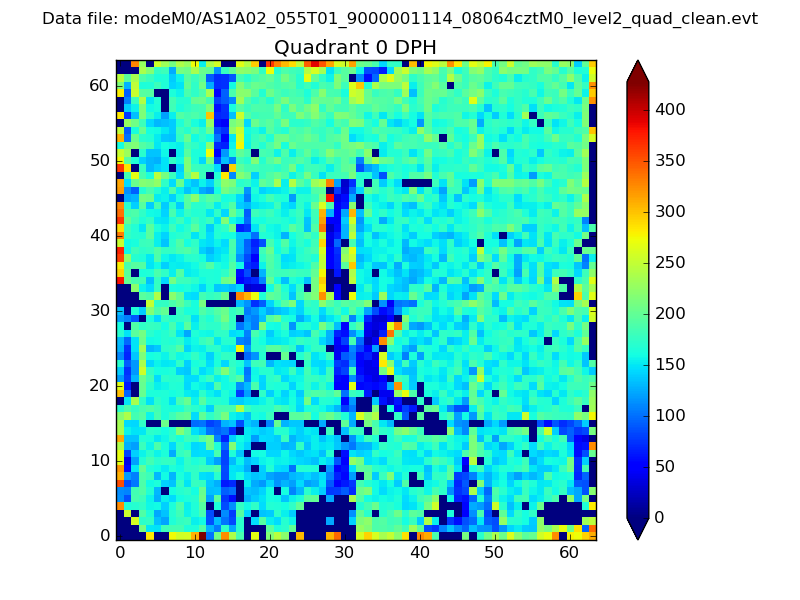 |
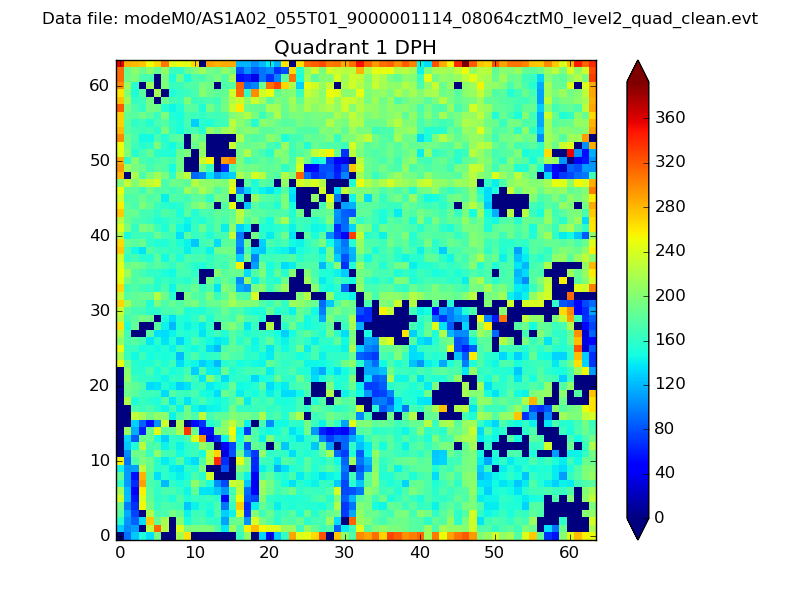 |
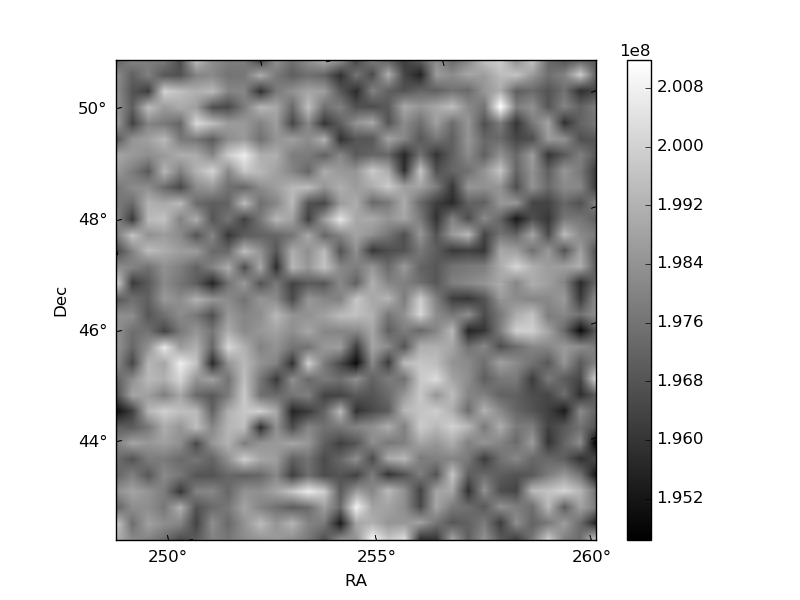
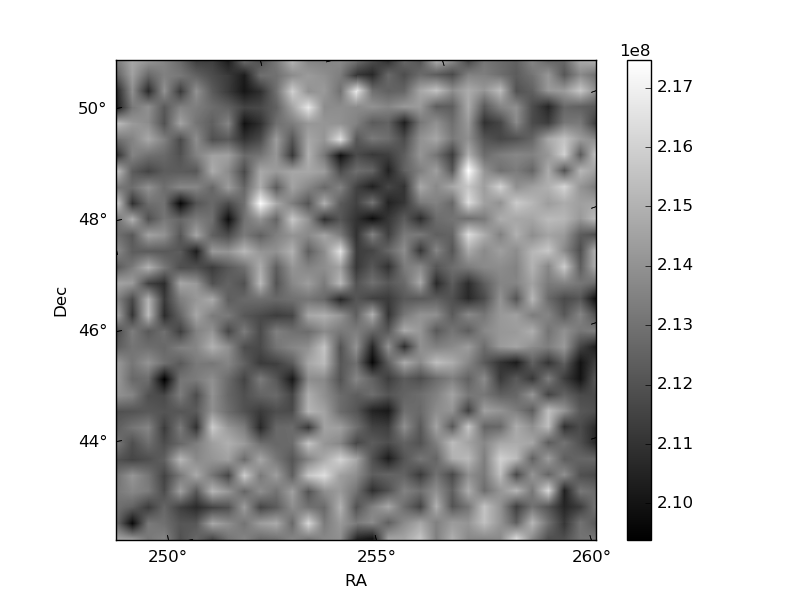
Quadrant B |
|---|---|---|---|
| Quadrant D | 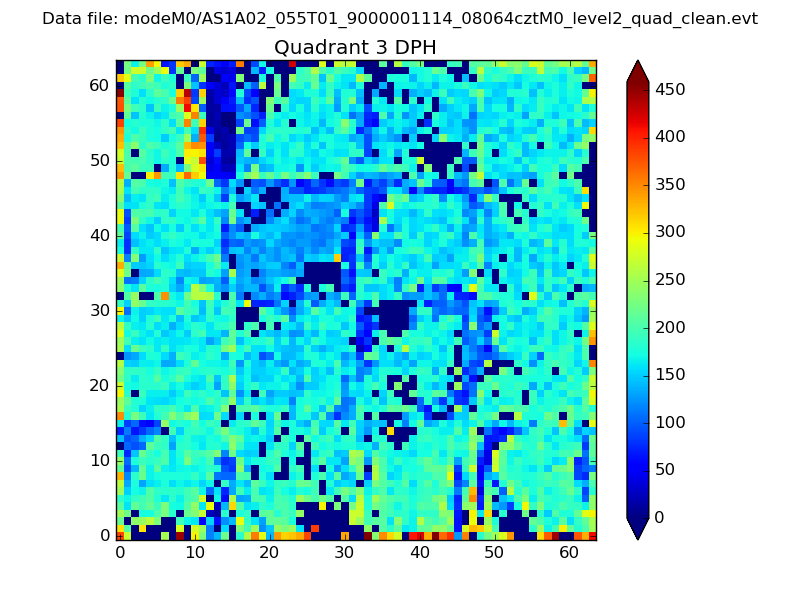 |
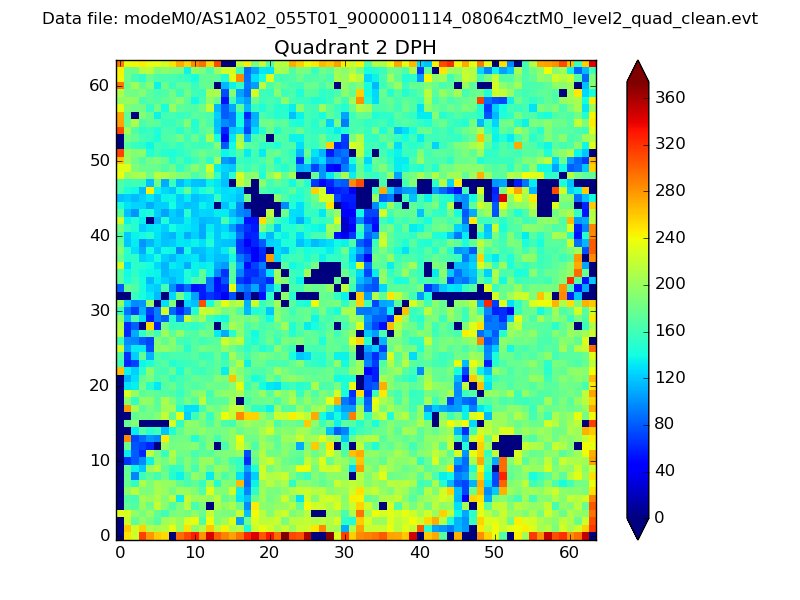 |
Quadrant C |
| Plot type | Count rate plots | Images |
|---|---|---|
| Comparison with Poisson distribution Blue bars denote a histogram of data divided into 1 sec bins. Red curve is a Poisson curve with rate = median count rate of data. |
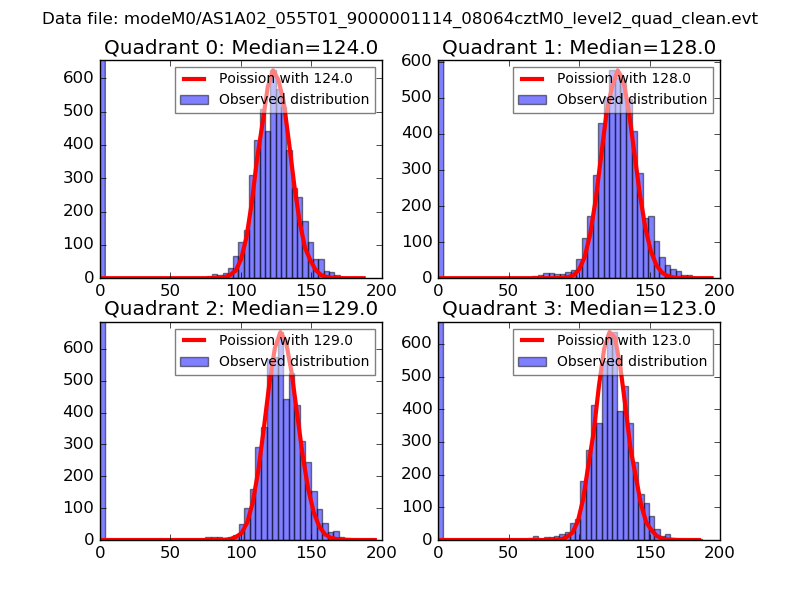 |
 |
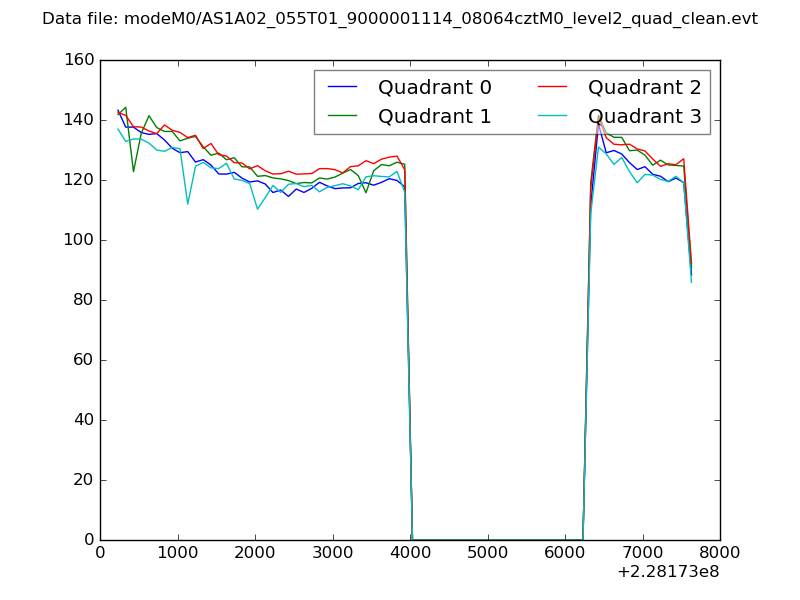
| Quadrant-wise count rates Data is divided into 100 sec bins |
 |
|
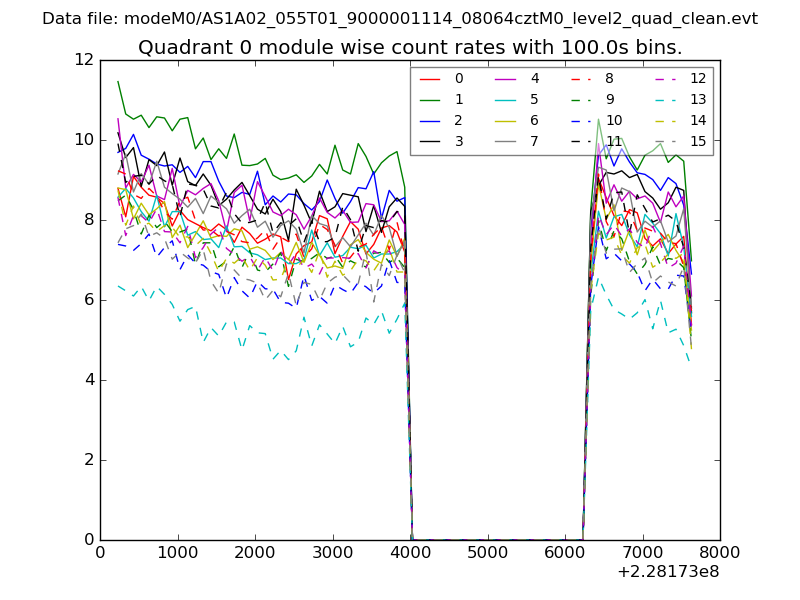
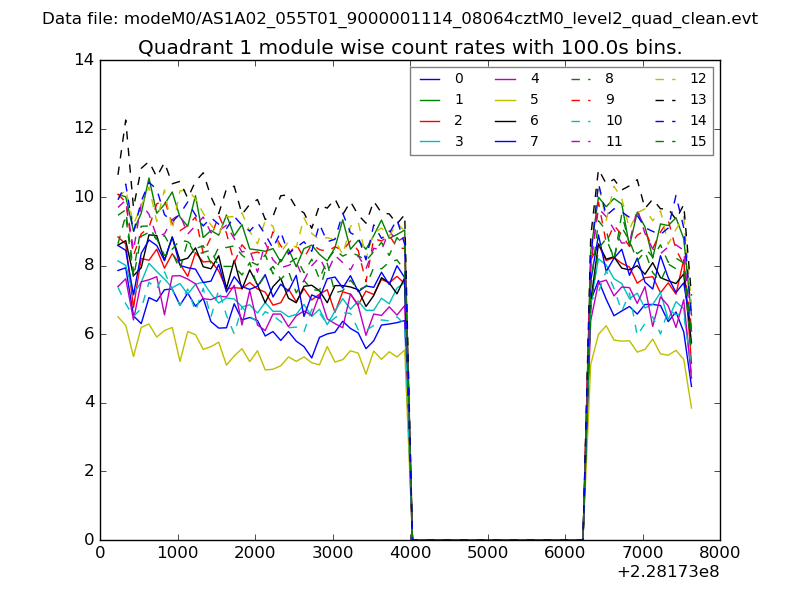
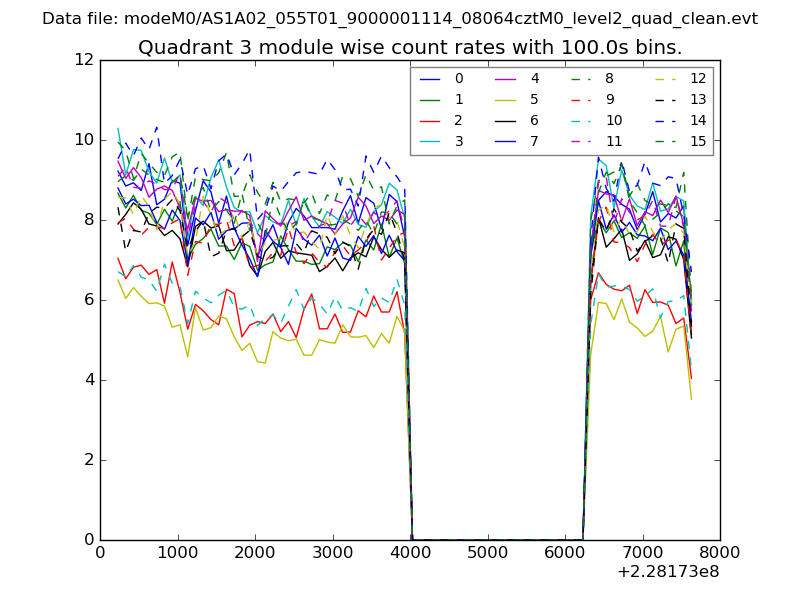
| Module-wise count rates for Quadrant A Data is divided into 100 sec bins |
 |
 |
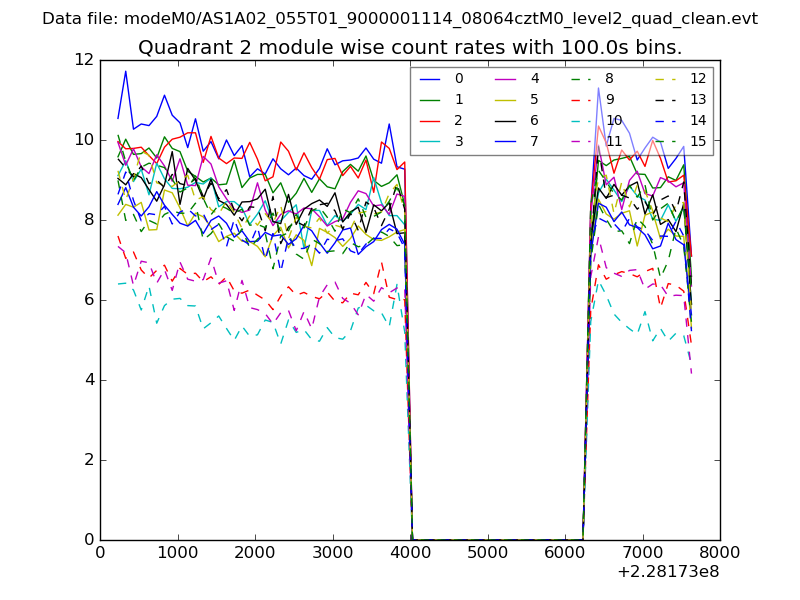
| Module-wise count rates for Quadrant B Data is divided into 100 sec bins |
 |
 |
| Module-wise count rates for Quadrant C Data is divided into 100 sec bins |
 |
 |
| Module-wise count rates for Quadrant D Data is divided into 100 sec bins |
 |
 |
| Parameter | Plot |
|---|---|
| CZT HV Monitor | 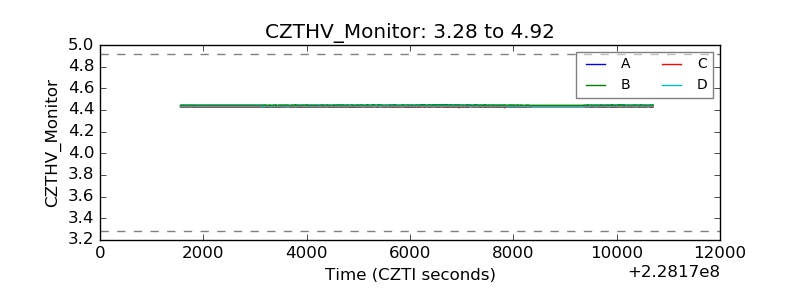 |
| D_VDD | 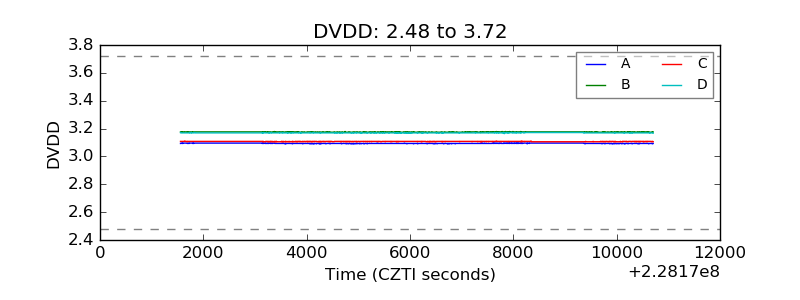 |
| Temperature 1 | 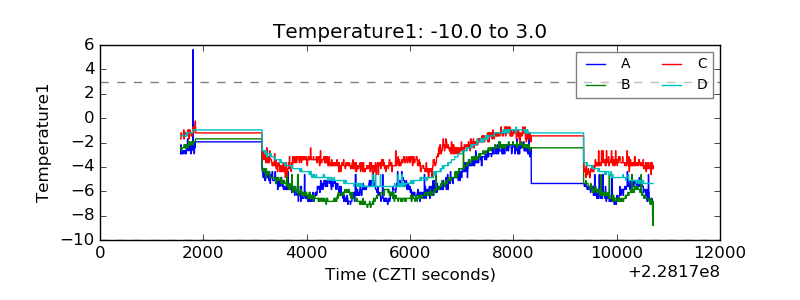 |
| Veto HV Monitor | 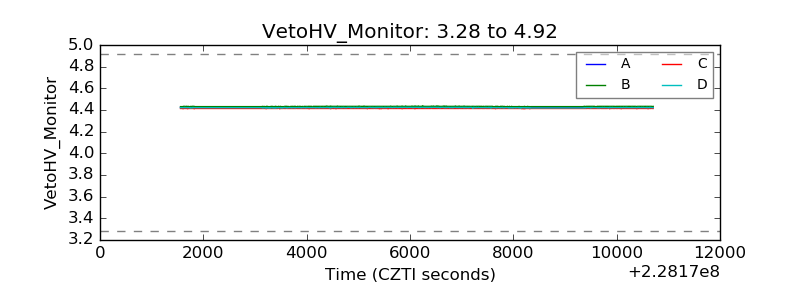 |
| Veto LLD | 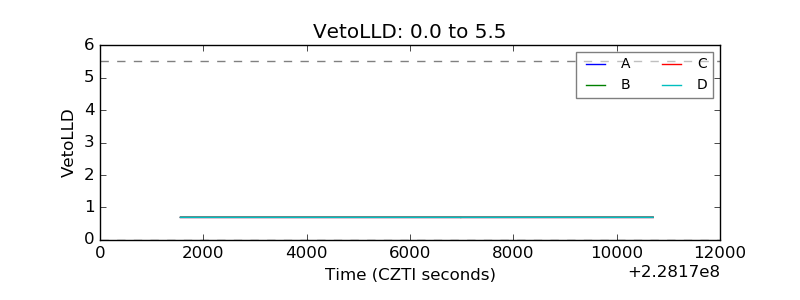 |
| Alpha Counter | 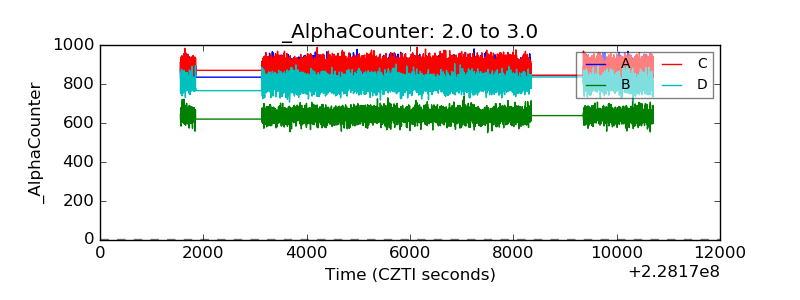 |
| _CPM_Rate | 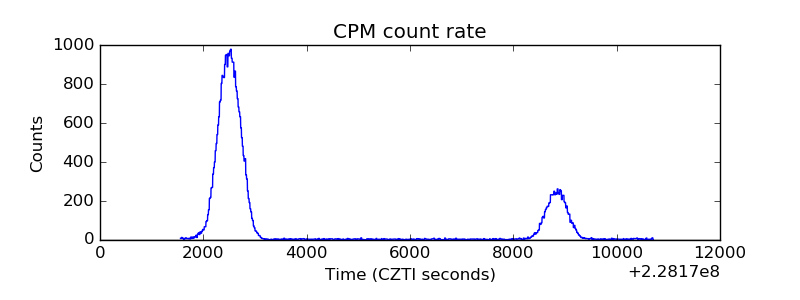 |
| CZT Counter | 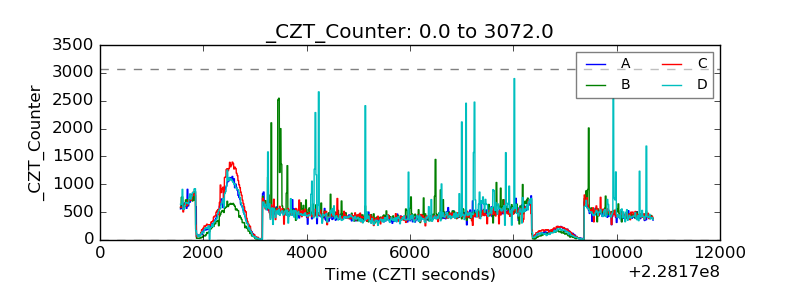 |
| +2.5 Volts monitor | 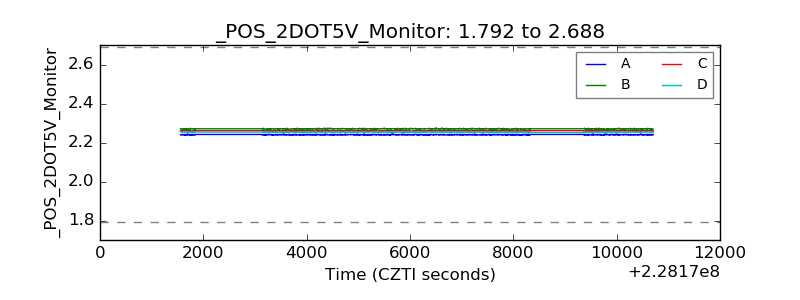 |
| +5 Volts monitor | 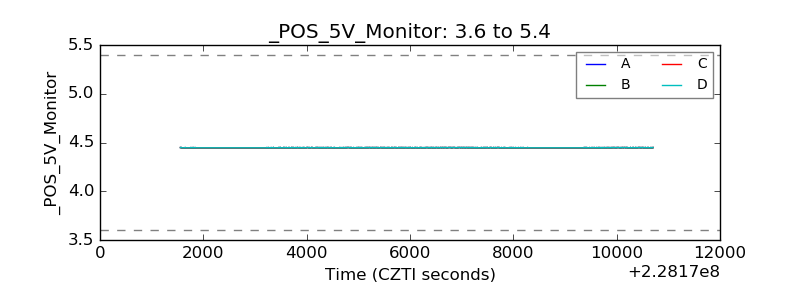 |
| _ROLL_ROT | 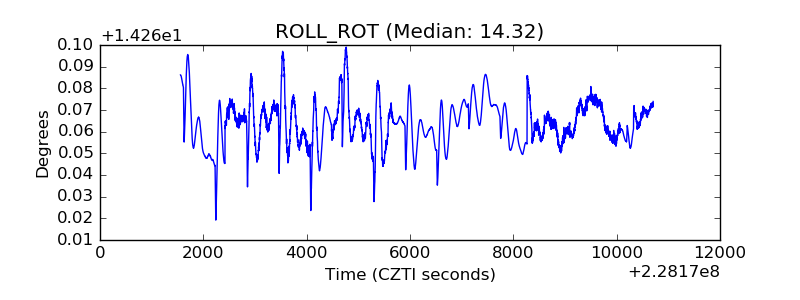 |
| _Roll_DEC | 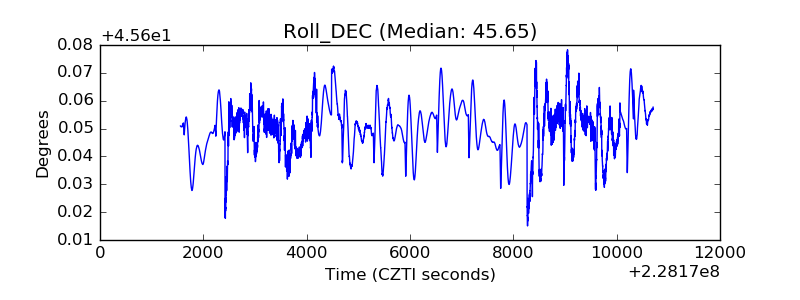 |
| _Roll_RA | 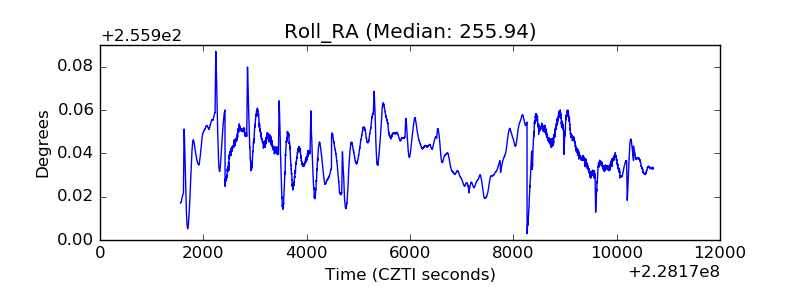 |
| Veto Counter | 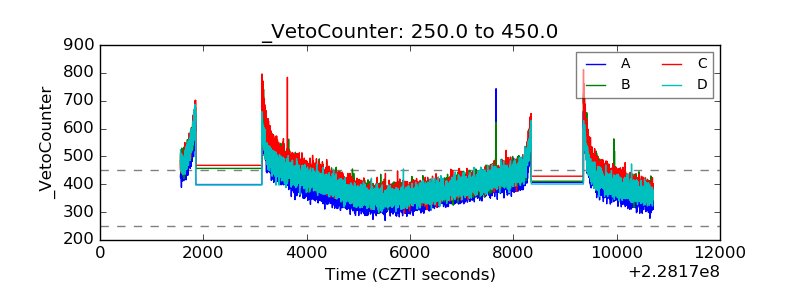 |