| Param | Original file | Final file |
|---|---|---|
| Filename | modeM0/AS1A02_055T01_9000001114_08067cztM0_level2.evt | modeM0/AS1A02_055T01_9000001114_08067cztM0_level2_quad_clean.evt |
| Size (bytes) | 606,974,400 | 114,540,480 |
| Size | 578.9 MB | 109.2 MB |
| Events in quadrant A | 3,907,274 | 729,037 |
| Events in quadrant B | 4,089,555 | 747,918 |
| Events in quadrant C | 3,816,538 | 764,989 |
| Events in quadrant D | 6,017,206 | 661,948 |
| Mode M0 | |||
|---|---|---|---|
| Quadrant | BADHDUFLAG | Total packets | Discarded packets |
| A | 0 | 17815 | 276 |
| B | 0 | 18215 | 451 |
| C | 0 | 17474 | 277 |
| D | 0 | 25158 | 1375 |
| Mode M9 | |||
|---|---|---|---|
| Quadrant | BADHDUFLAG | Total packets | Discarded packets |
| A | 0 | 2 | 0 |
| B | 0 | 2 | 0 |
| C | 0 | 2 | 0 |
| D | 0 | 2 | 0 |
| Mode SS | |||
|---|---|---|---|
| Quadrant | BADHDUFLAG | Total packets | Discarded packets |
| A | 0 | 170 | 2 |
| B | 0 | 170 | 4 |
| C | 0 | 170 | 6 |
| D | 0 | 170 | 2 |
| Quadrant | Total seconds | Saturated seconds | Saturation percentage |
|---|---|---|---|
| A | 8166 | 313 | 3.832966% |
| B | 8117 | 278 | 3.424911% |
| C | 8167 | 82 | 1.004041% |
| D | 8038 | 933 | 11.607365% |
Noise dominated data is calculated using 1-second bins in cleaned event files. If a bin has >2000 counts, and if more than 50% of those come from <1% of pixels, then it is considered to be noise-dominated and hence unusable.
| Quadrant | # 1 sec bins | Bins with >0 counts | Bins with >2000 counts | High rate bins dominated by noise | Noise dominated (total time) | Noise dominated (detector-on time) | Marked lightcurve |
|---|---|---|---|---|---|---|---|
| A | 8441 | 8265 | 4 | 4 | 0.05% | 0.05% | 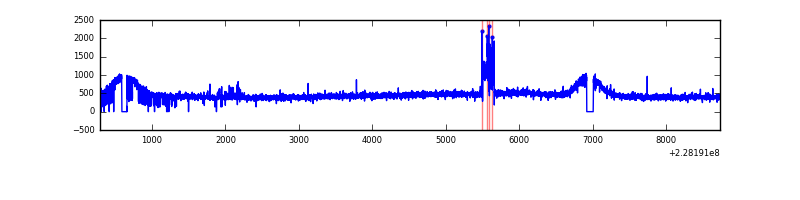 |
| B | 8441 | 8251 | 2 | 2 | 0.02% | 0.02% | 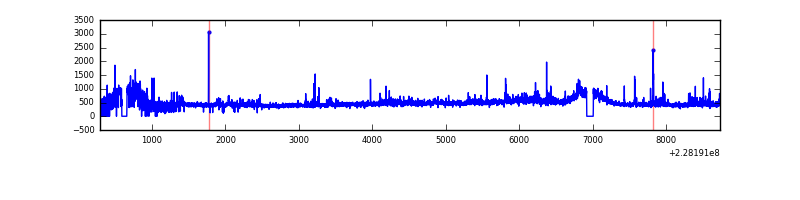 |
| C | 8441 | 8263 | 0 | 0 | 0.00% | 0.00% | 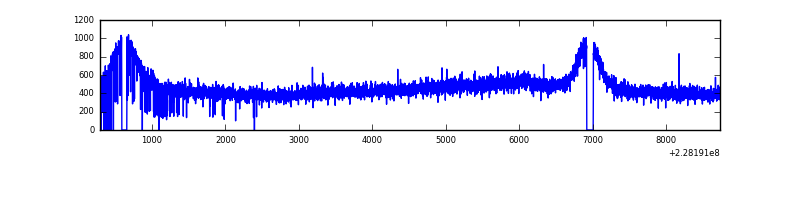 |
| D | 8440 | 8187 | 628 | 628 | 7.44% | 7.67% | 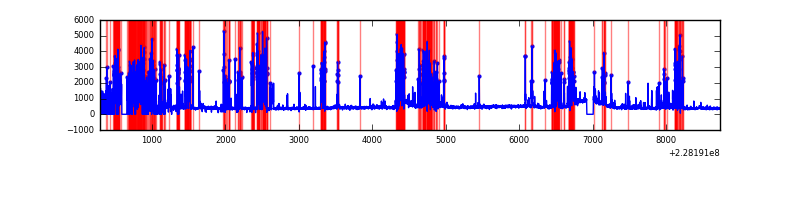 |
Top three noisy pixels from each quadrant. If the there are fewer than three noisy pixels in the level2.evt file, extra rows are filled as -1
| Pixel properties | Quadrant properties | ||||||
|---|---|---|---|---|---|---|---|
| Quadrant | DetID | PixID | Counts | Sigma | Mean | Median | Sigma |
| A | 14 | 111 | 177409 | 882.79 | 968 | 944 | 199.9 |
| A | 0 | 226 | 9065 | 40.63 | 968 | 944 | 199.9 |
| A | 12 | 194 | 8874 | 39.67 | 968 | 944 | 199.9 |
| B | 4 | 81 | 186348 | 973.02 | 982 | 957 | 190.5 |
| B | 11 | 51 | 50249 | 258.71 | 982 | 957 | 190.5 |
| B | 0 | 214 | 27492 | 139.27 | 982 | 957 | 190.5 |
| C | 1 | 16 | 24824 | 106.1 | 964 | 966 | 224.9 |
| C | 8 | 128 | 16455 | 68.88 | 964 | 966 | 224.9 |
| C | 8 | 112 | 7592 | 29.47 | 964 | 966 | 224.9 |
| D | 1 | 52 | 2046557 | 8663.91 | 870 | 850 | 236.1 |
| D | 1 | 83 | 521873 | 2206.62 | 870 | 850 | 236.1 |
| D | 7 | 71 | 83340 | 349.36 | 870 | 850 | 236.1 |
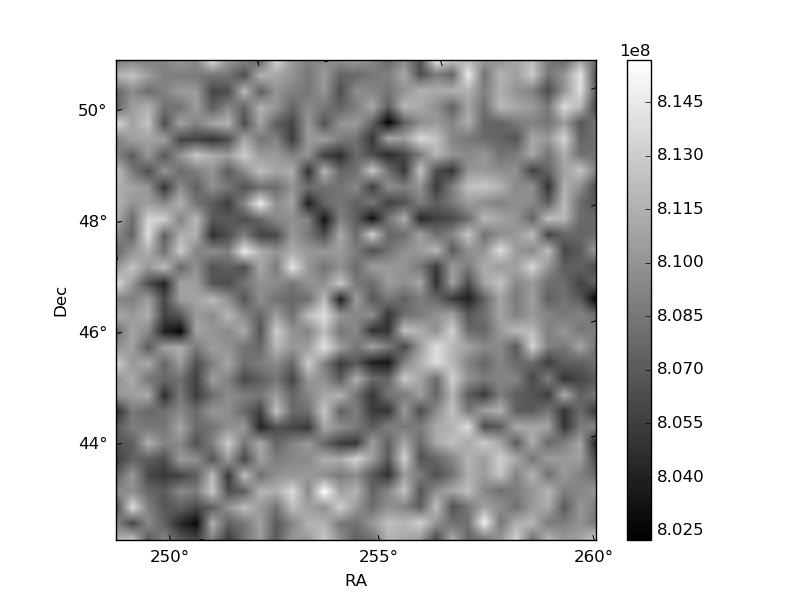
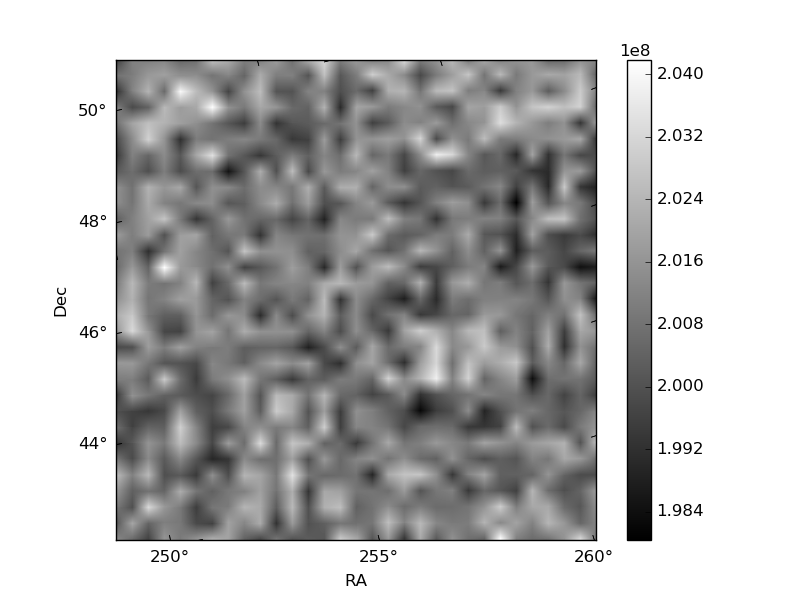
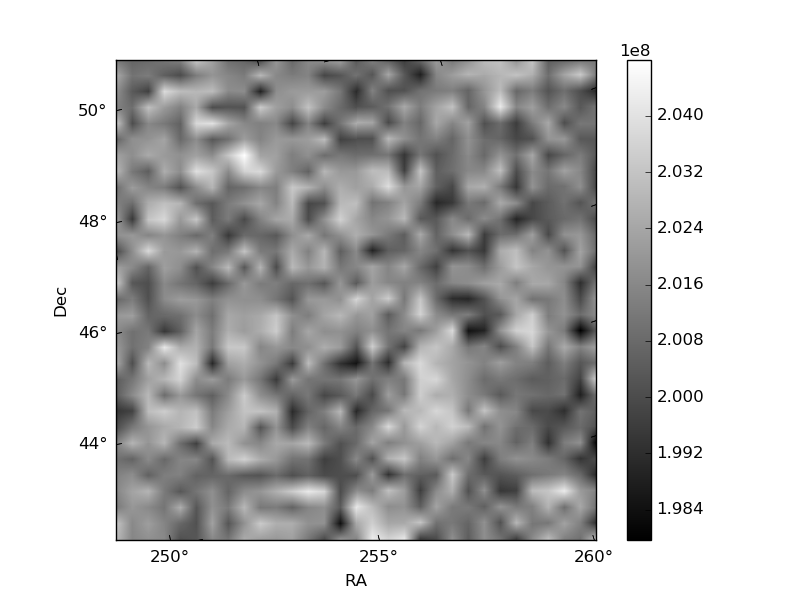
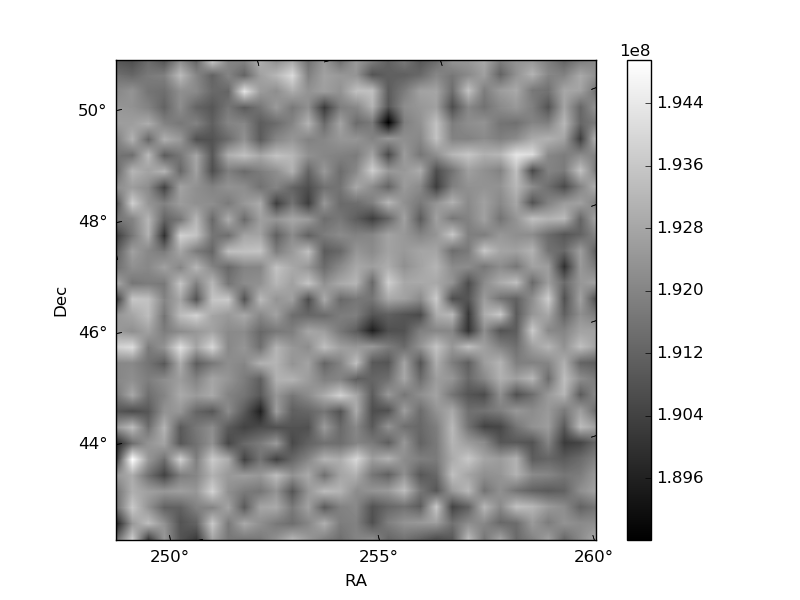
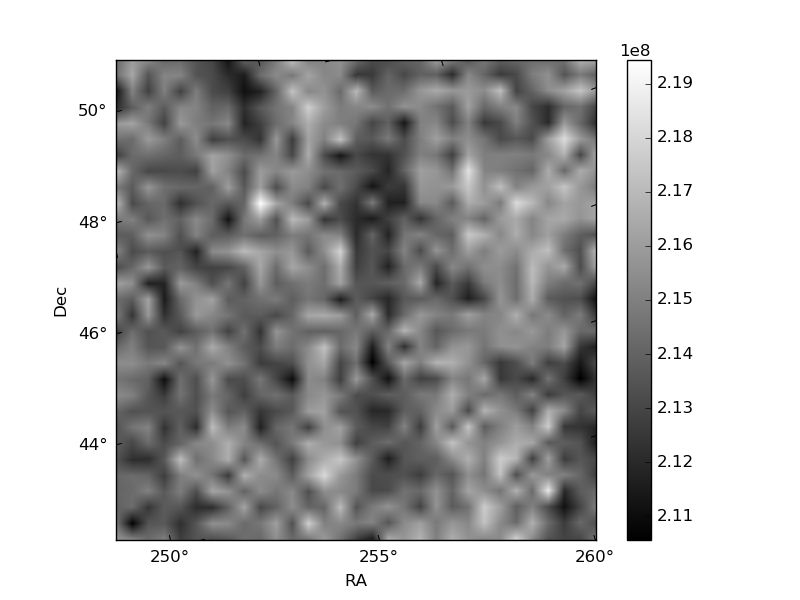
Histogram calculated using DETX and DETY for each event in the final _common_clean file
| Quadrant A | 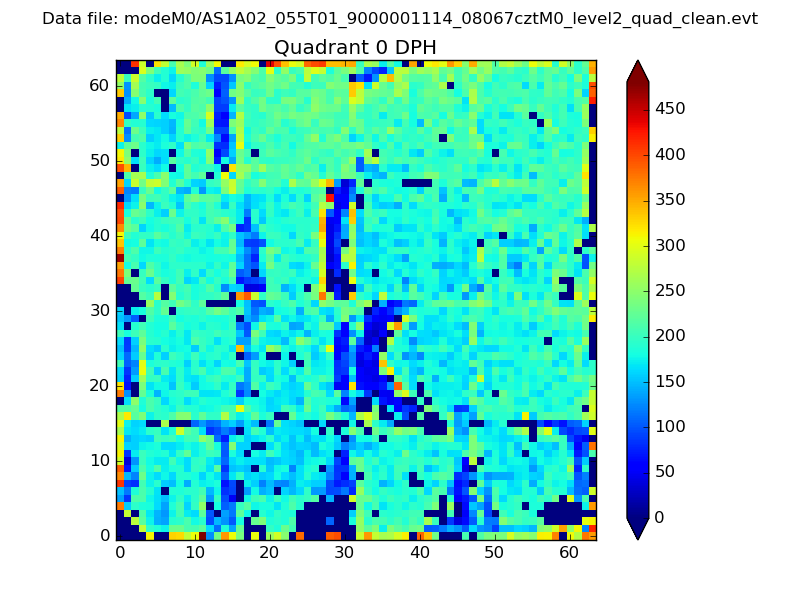 |
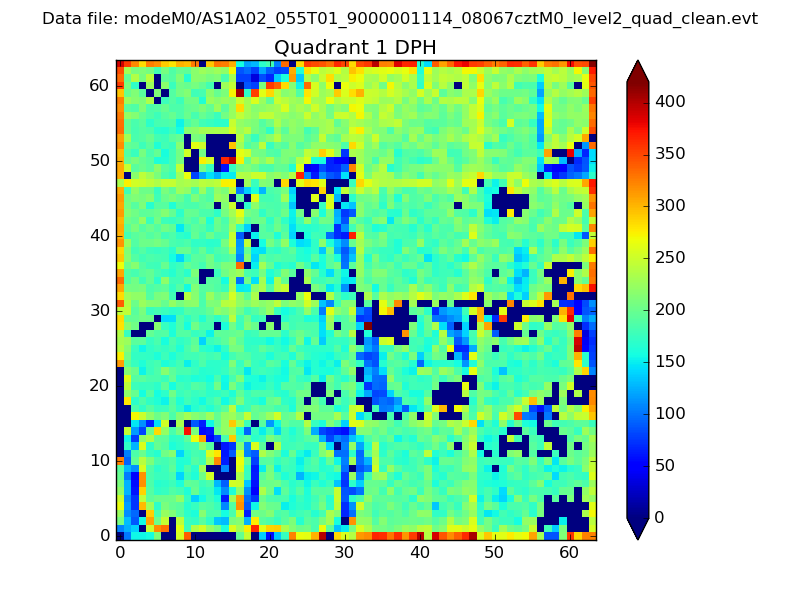 |
Quadrant B |
|---|---|---|---|
| Quadrant D | 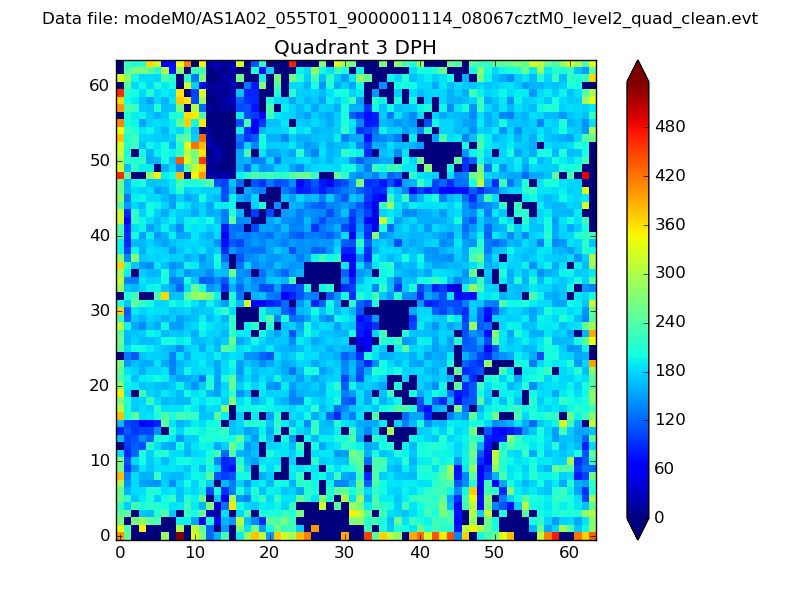 |
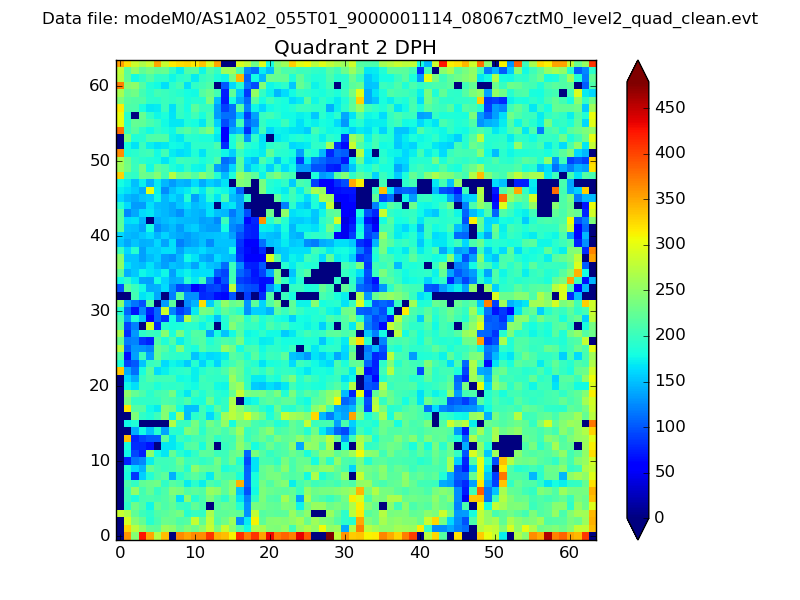 |
Quadrant C |
| Plot type | Count rate plots | Images |
|---|---|---|
| Comparison with Poisson distribution Blue bars denote a histogram of data divided into 1 sec bins. Red curve is a Poisson curve with rate = median count rate of data. |
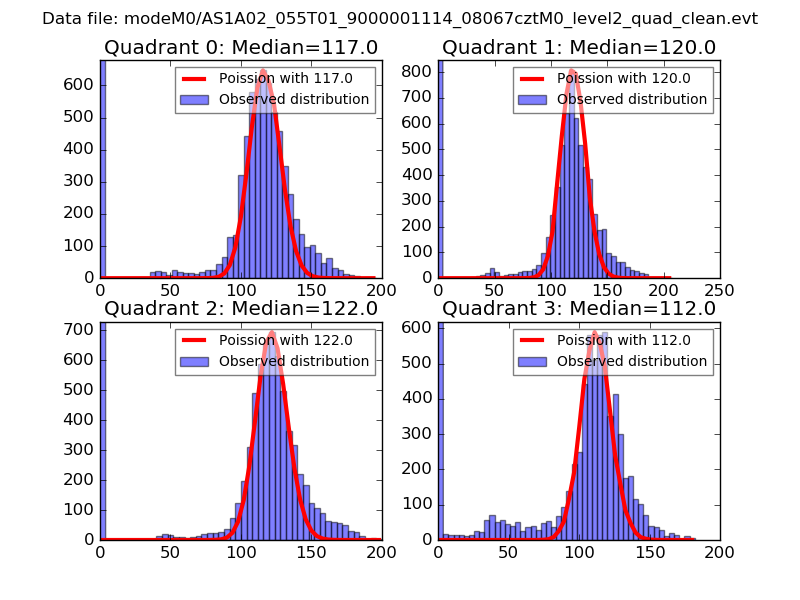 |
 |
| Quadrant-wise count rates Data is divided into 100 sec bins |
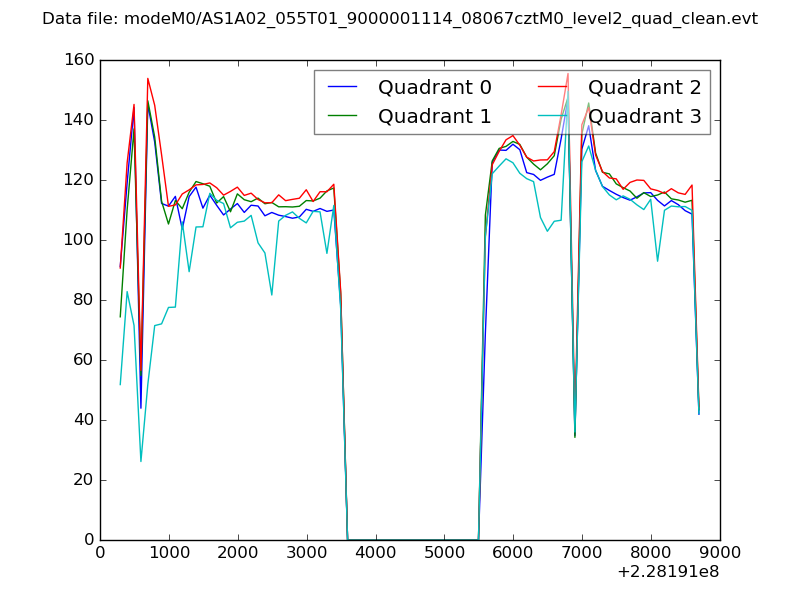 |
|
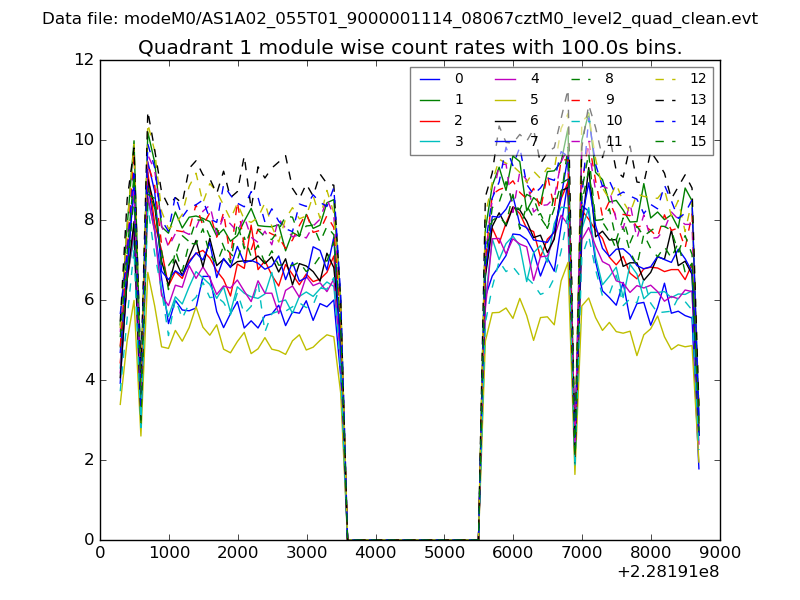
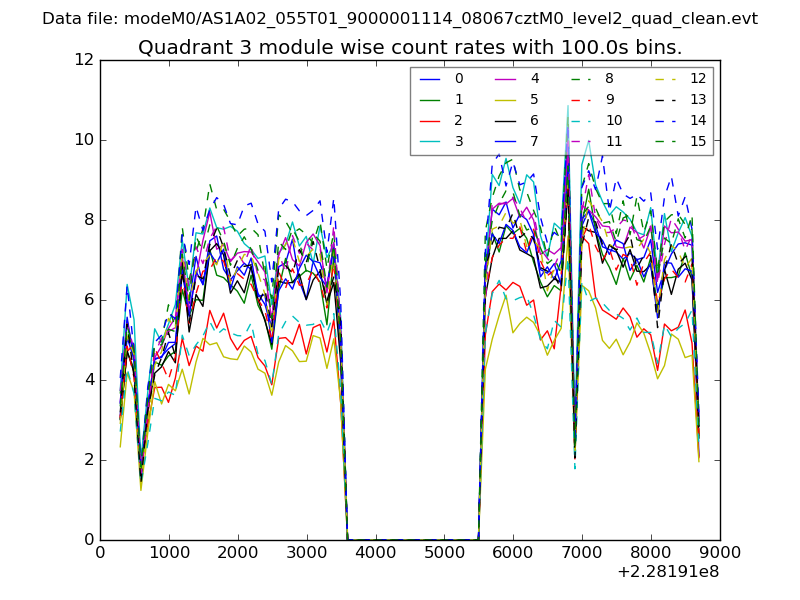
| Module-wise count rates for Quadrant A Data is divided into 100 sec bins |
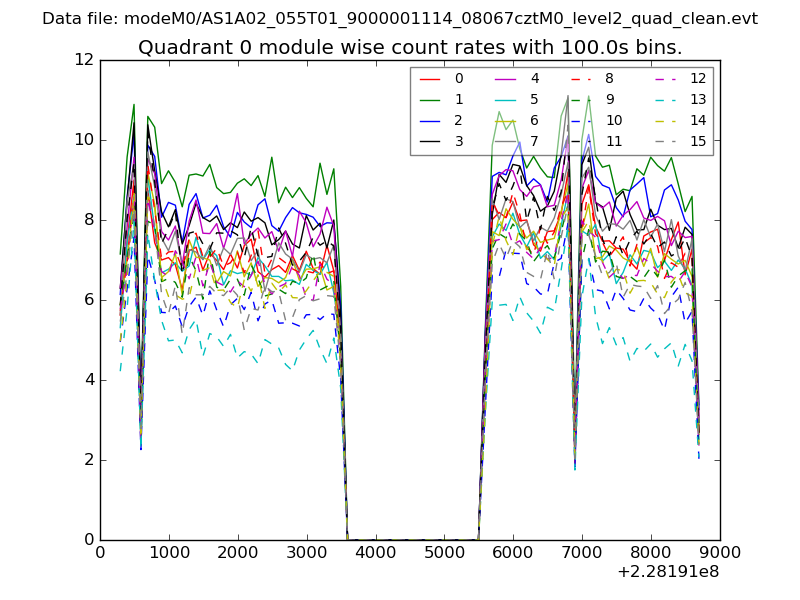 |
 |
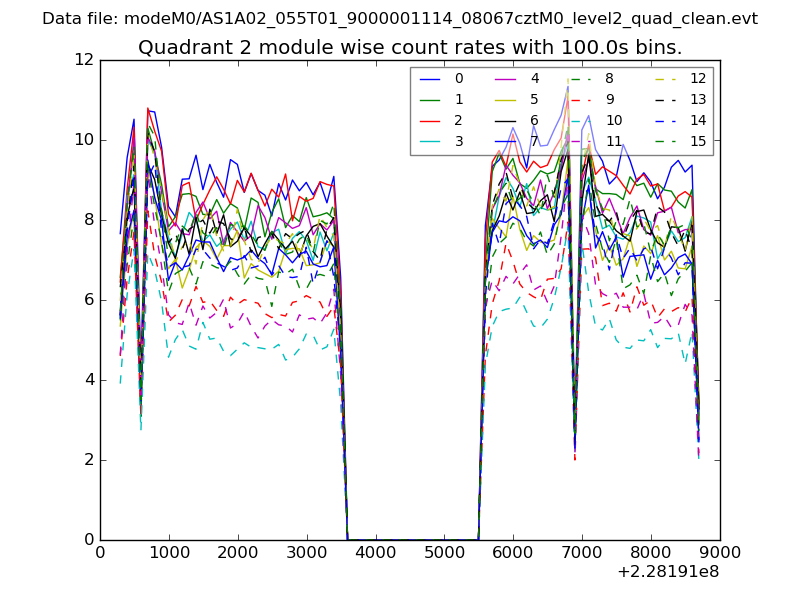
| Module-wise count rates for Quadrant B Data is divided into 100 sec bins |
 |
 |
| Module-wise count rates for Quadrant C Data is divided into 100 sec bins |
 |
 |
| Module-wise count rates for Quadrant D Data is divided into 100 sec bins |
 |
 |
| Parameter | Plot |
|---|---|
| CZT HV Monitor | 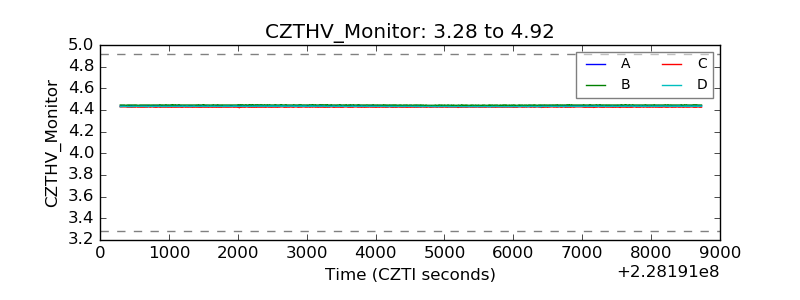 |
| D_VDD | 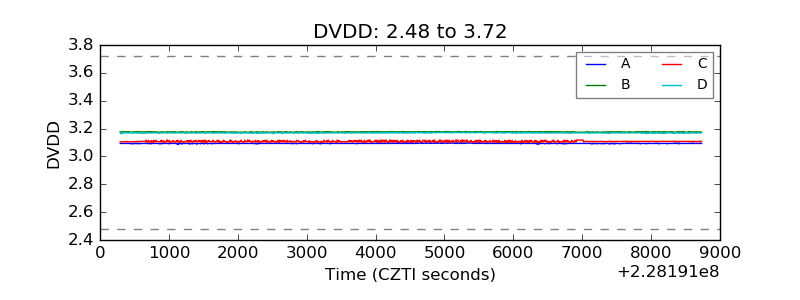 |
| Temperature 1 | 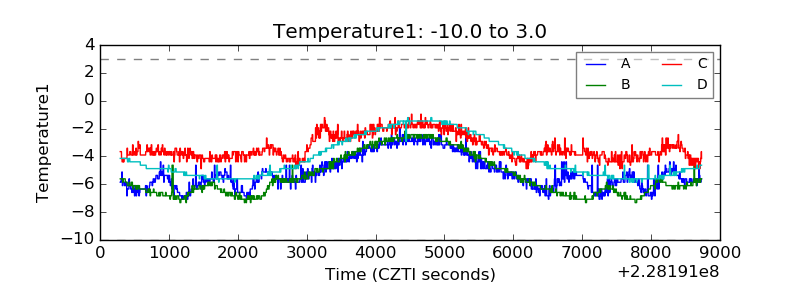 |
| Veto HV Monitor | 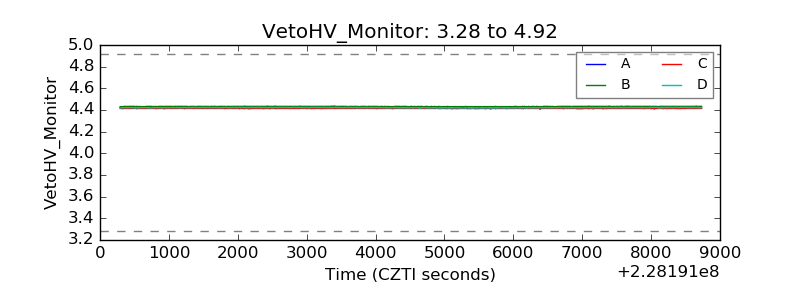 |
| Veto LLD | 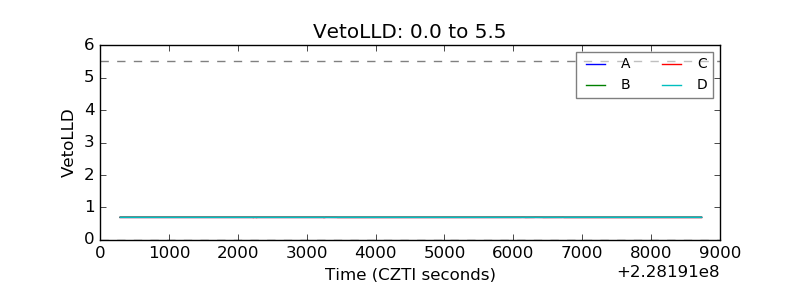 |
| Alpha Counter | 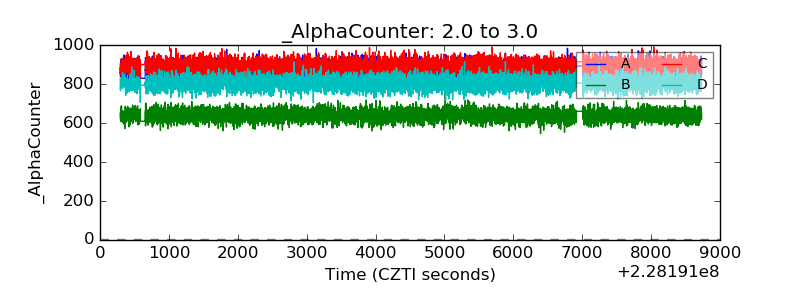 |
| _CPM_Rate | 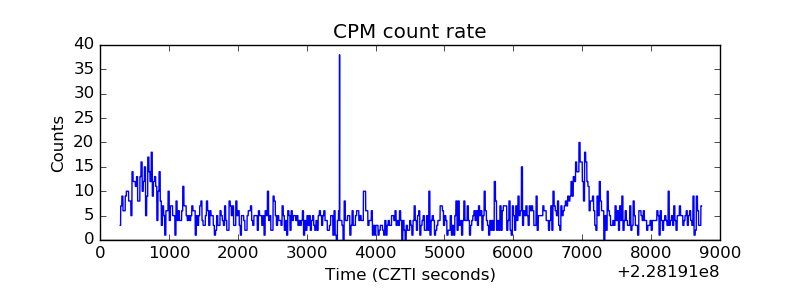 |
| CZT Counter | 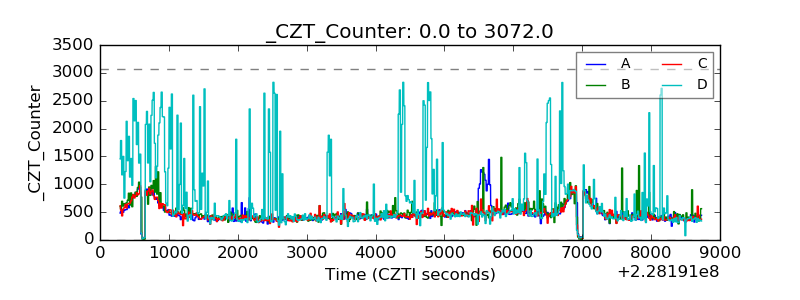 |
| +2.5 Volts monitor |  |
| +5 Volts monitor |  |
| _ROLL_ROT | 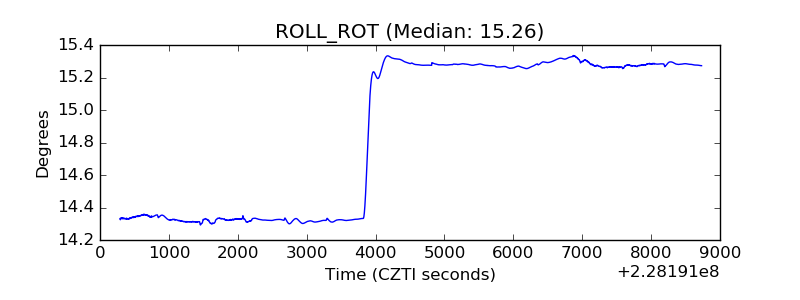 |
| _Roll_DEC | 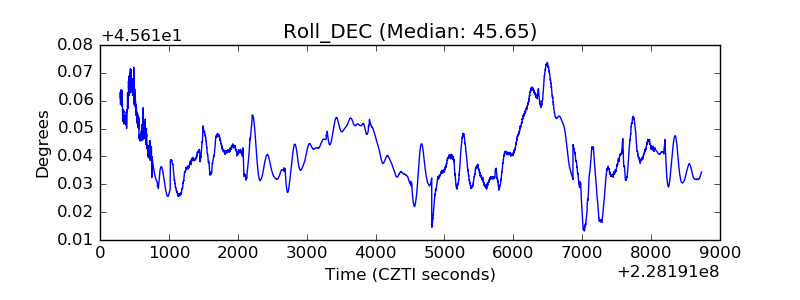 |
| _Roll_RA | 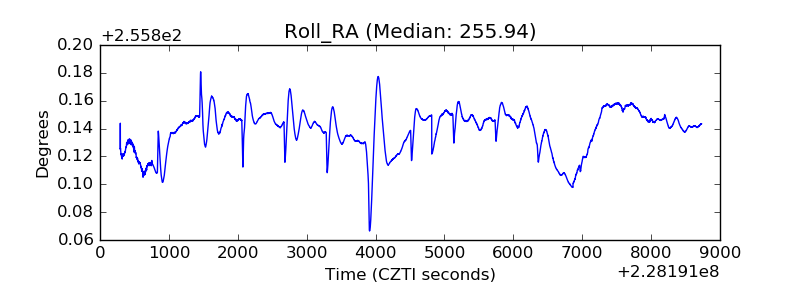 |
| Veto Counter | 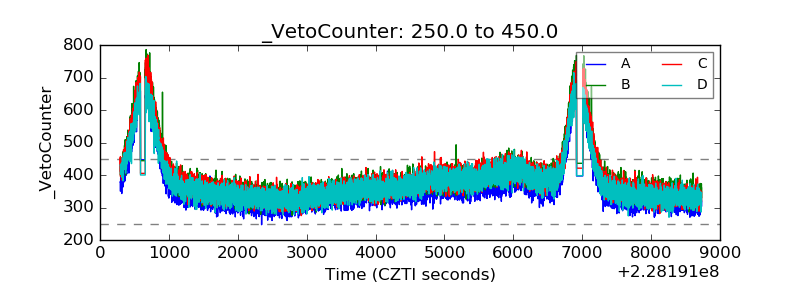 |