| Param | Original file | Final file |
|---|---|---|
| Filename | modeM0/AS1A02_055T01_9000001114_08070cztM0_level2.evt | modeM0/AS1A02_055T01_9000001114_08070cztM0_level2_quad_clean.evt |
| Size (bytes) | 1,187,942,400 | 220,023,360 |
| Size | 1.1 GB | 209.8 MB |
| Events in quadrant A | 8,033,524 | 1,338,645 |
| Events in quadrant B | 8,820,438 | 1,373,868 |
| Events in quadrant C | 8,160,642 | 1,385,699 |
| Events in quadrant D | 9,736,491 | 1,317,176 |
| Mode M0 | |||
|---|---|---|---|
| Quadrant | BADHDUFLAG | Total packets | Discarded packets |
| A | 0 | 36919 | 249 |
| B | 0 | 38457 | 301 |
| C | 0 | 36992 | 265 |
| D | 0 | 41887 | 301 |
| Mode M9 | |||
|---|---|---|---|
| Quadrant | BADHDUFLAG | Total packets | Discarded packets |
| A | 0 | 16 | 0 |
| B | 0 | 16 | 0 |
| C | 0 | 16 | 0 |
| D | 0 | 16 | 0 |
| Mode SS | |||
|---|---|---|---|
| Quadrant | BADHDUFLAG | Total packets | Discarded packets |
| A | 0 | 372 | 2 |
| B | 0 | 372 | 0 |
| C | 0 | 372 | 2 |
| D | 0 | 372 | 0 |
| Quadrant | Total seconds | Saturated seconds | Saturation percentage |
|---|---|---|---|
| A | 18111 | 155 | 0.855833% |
| B | 18091 | 209 | 1.155271% |
| C | 18108 | 101 | 0.557765% |
| D | 18108 | 436 | 2.407776% |
Noise dominated data is calculated using 1-second bins in cleaned event files. If a bin has >2000 counts, and if more than 50% of those come from <1% of pixels, then it is considered to be noise-dominated and hence unusable.
| Quadrant | # 1 sec bins | Bins with >0 counts | Bins with >2000 counts | High rate bins dominated by noise | Noise dominated (total time) | Noise dominated (detector-on time) | Marked lightcurve |
|---|---|---|---|---|---|---|---|
| A | 19910 | 18163 | 3 | 3 | 0.02% | 0.02% | 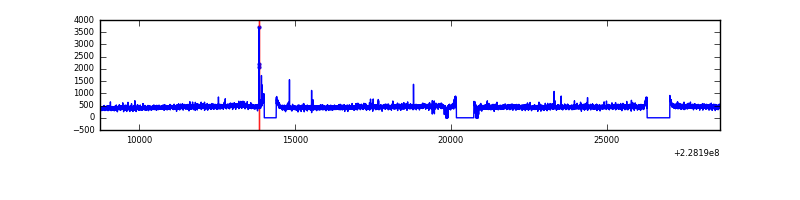 |
| B | 19910 | 18153 | 40 | 40 | 0.20% | 0.22% | 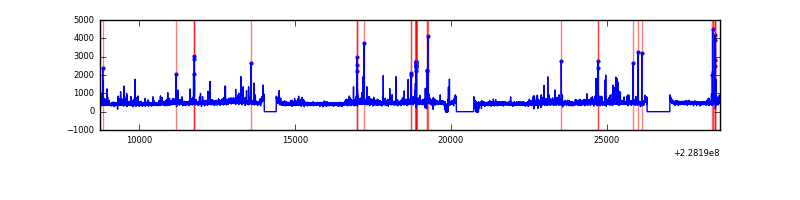 |
| C | 19910 | 18162 | 0 | 0 | 0.00% | 0.00% | 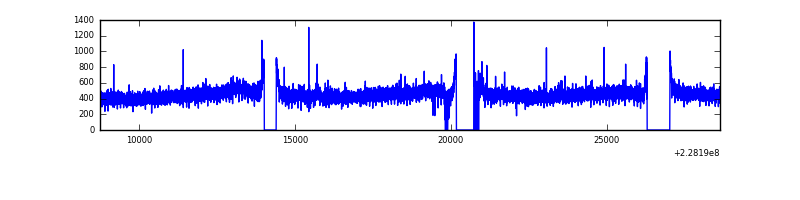 |
| D | 19910 | 18170 | 258 | 258 | 1.30% | 1.42% | 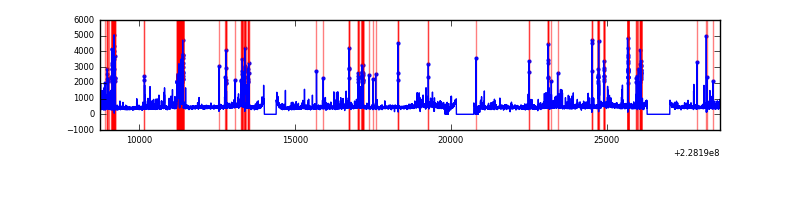 |
Top three noisy pixels from each quadrant. If the there are fewer than three noisy pixels in the level2.evt file, extra rows are filled as -1
| Pixel properties | Quadrant properties | ||||||
|---|---|---|---|---|---|---|---|
| Quadrant | DetID | PixID | Counts | Sigma | Mean | Median | Sigma |
| A | 13 | 251 | 27156 | 59.75 | 2080 | 2036 | 420.5 |
| A | 0 | 226 | 19377 | 41.24 | 2080 | 2036 | 420.5 |
| A | 12 | 194 | 18870 | 40.04 | 2080 | 2036 | 420.5 |
| B | 10 | 16 | 190256 | 472.62 | 2093 | 2040 | 398.2 |
| B | 0 | 214 | 163402 | 405.19 | 2093 | 2040 | 398.2 |
| B | 11 | 51 | 155603 | 385.61 | 2093 | 2040 | 398.2 |
| C | 1 | 16 | 219265 | 462.61 | 2036 | 2044 | 469.6 |
| C | 13 | 61 | 15412 | 28.47 | 2036 | 2044 | 469.6 |
| C | 8 | 222 | 7041 | 10.64 | 2036 | 2044 | 469.6 |
| D | 1 | 52 | 1213255 | 2316.42 | 2002 | 1951 | 522.9 |
| D | 1 | 83 | 594180 | 1132.54 | 2002 | 1951 | 522.9 |
| D | 2 | 14 | 119746 | 225.26 | 2002 | 1951 | 522.9 |
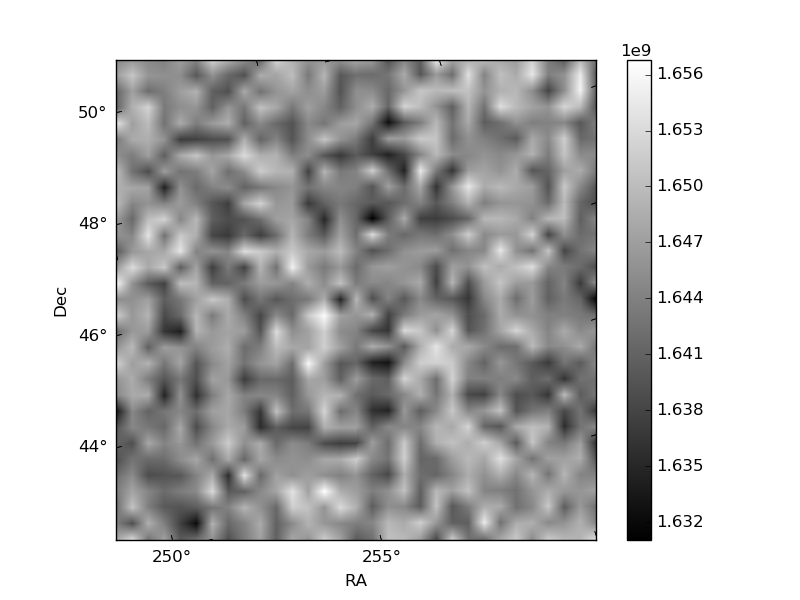
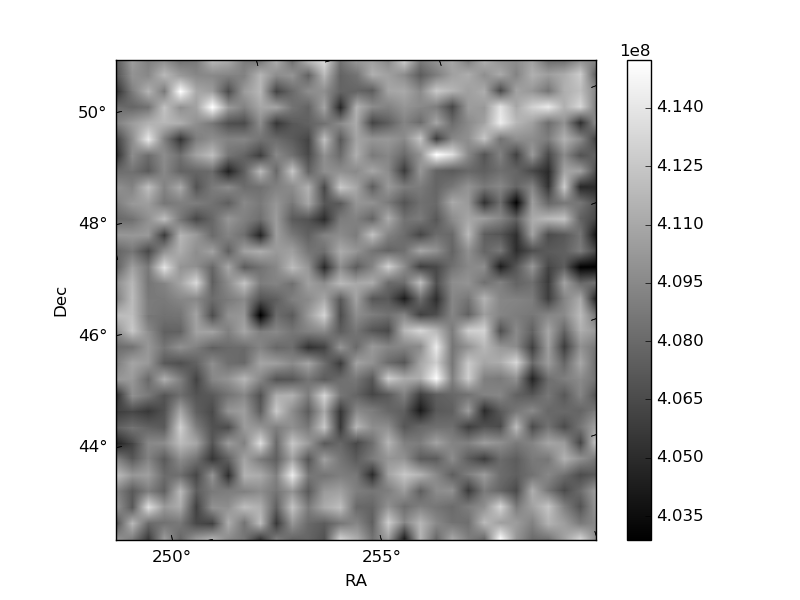
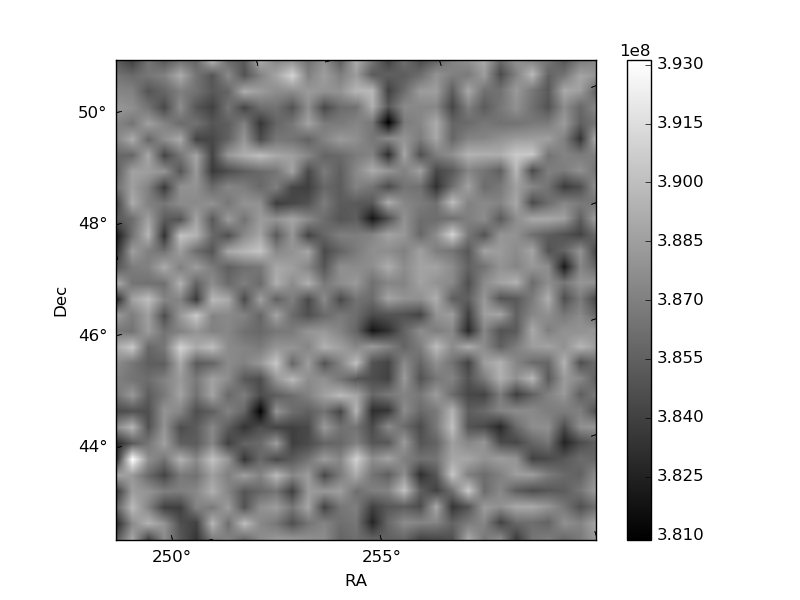
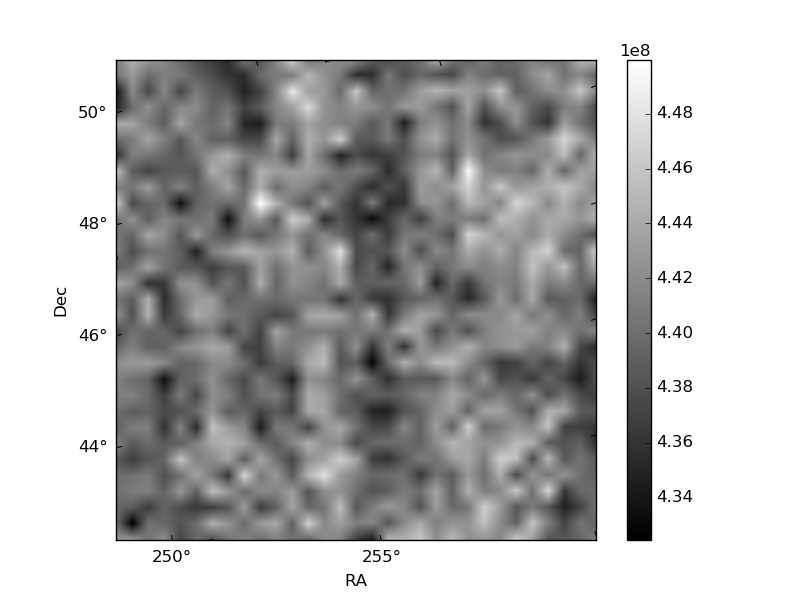
Histogram calculated using DETX and DETY for each event in the final _common_clean file
| Quadrant A | 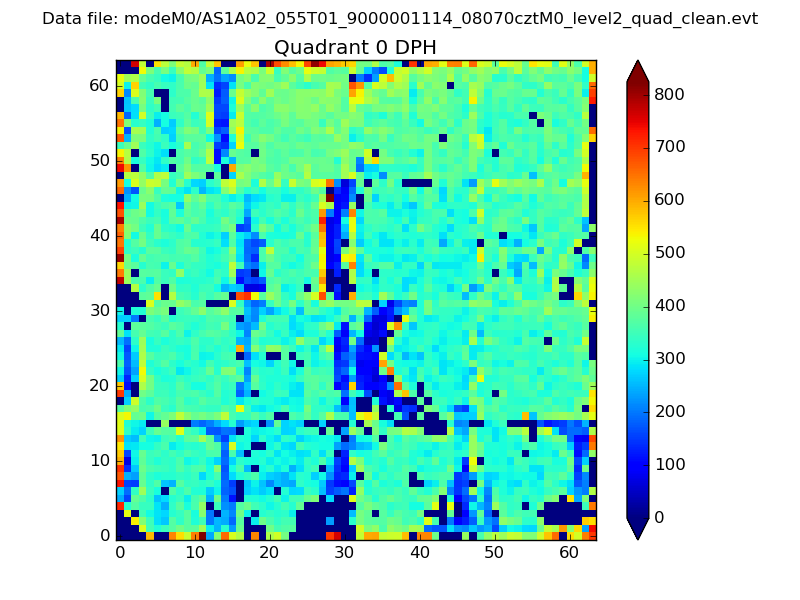 |
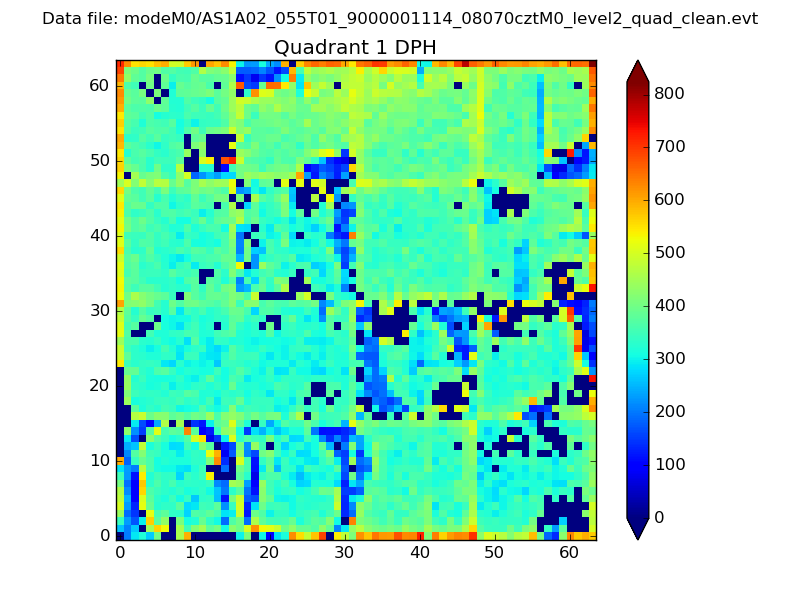 |
Quadrant B |
|---|---|---|---|
| Quadrant D | 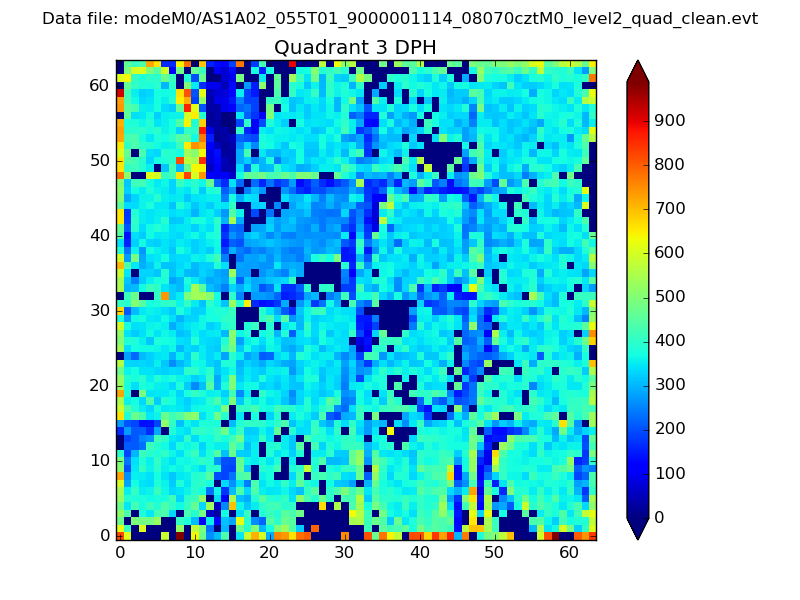 |
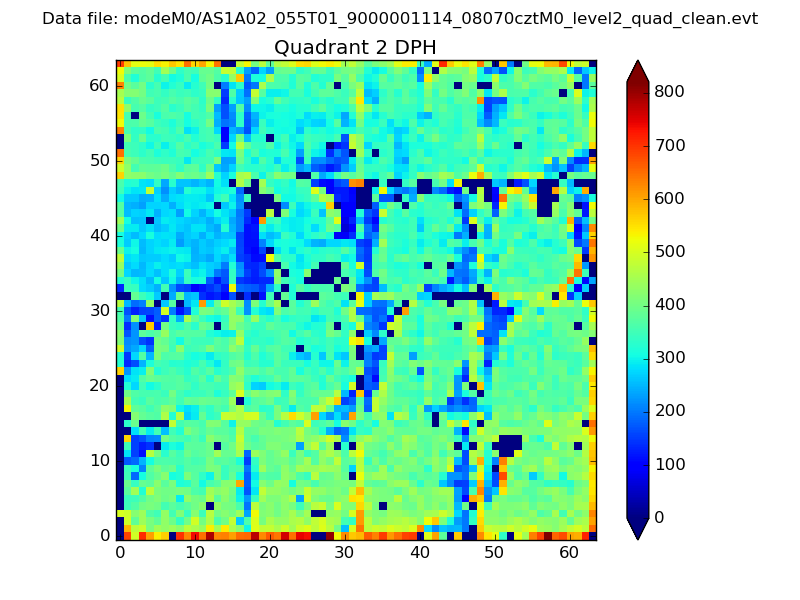 |
Quadrant C |
| Plot type | Count rate plots | Images |
|---|---|---|
| Comparison with Poisson distribution Blue bars denote a histogram of data divided into 1 sec bins. Red curve is a Poisson curve with rate = median count rate of data. |
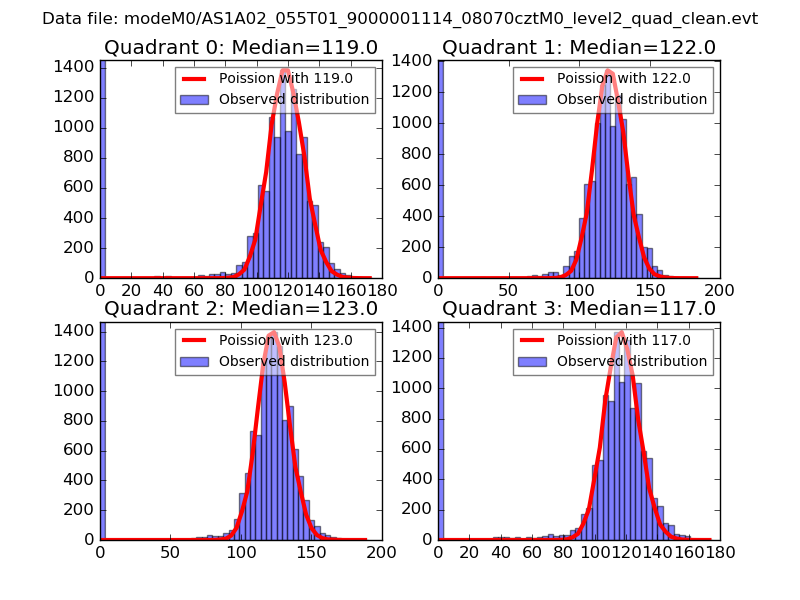 |
 |
| Quadrant-wise count rates Data is divided into 100 sec bins |
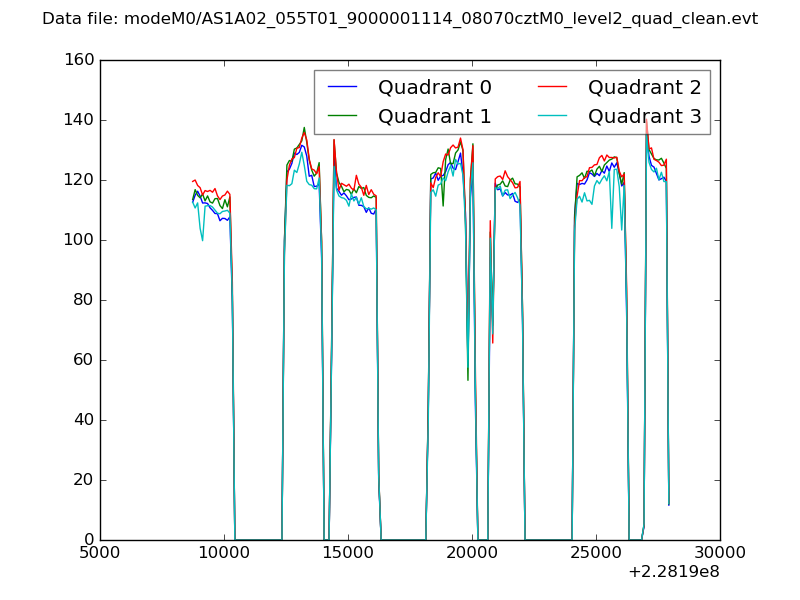 |
|
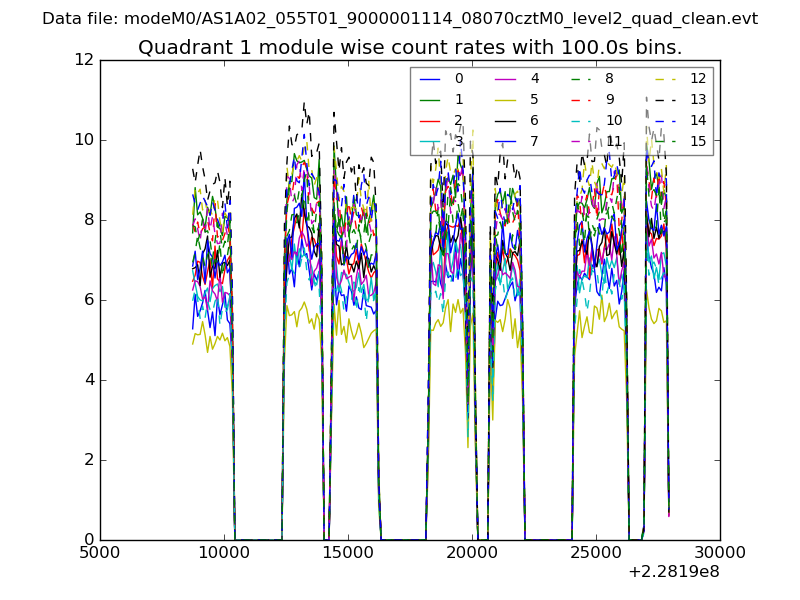
| Module-wise count rates for Quadrant A Data is divided into 100 sec bins |
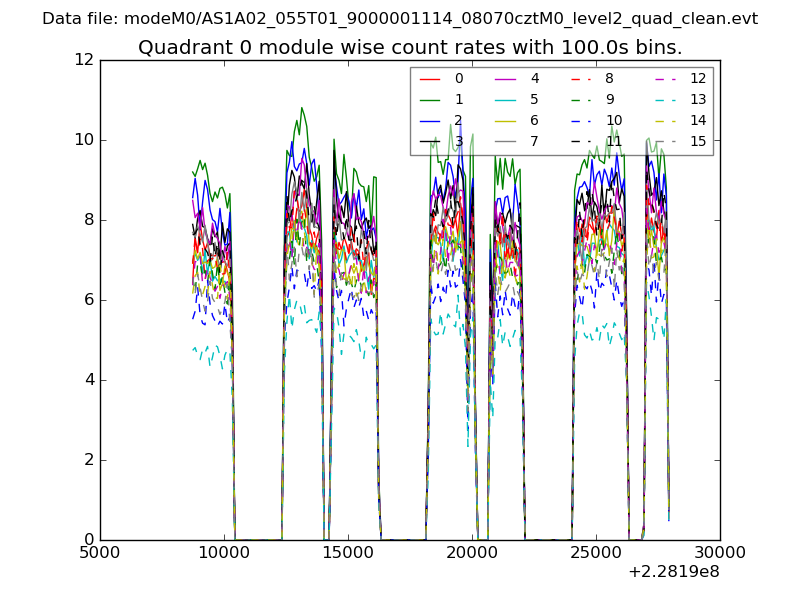 |
 |
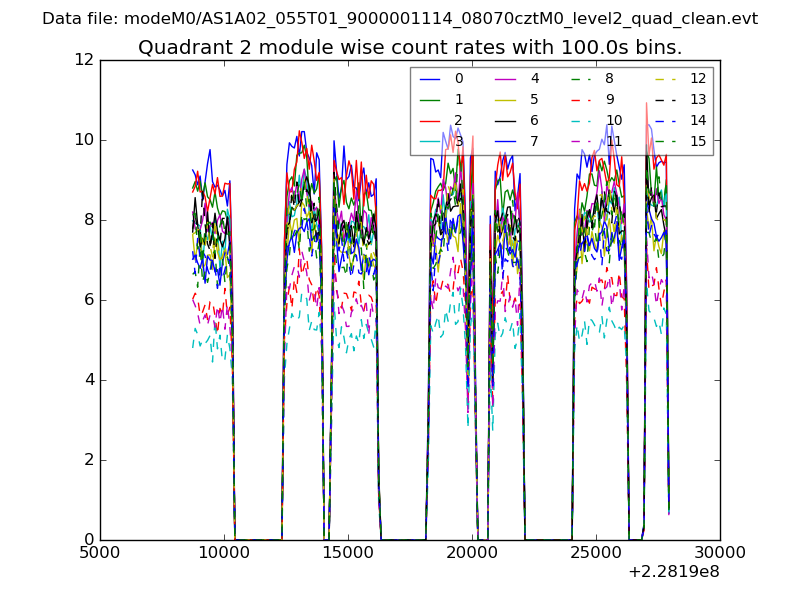
| Module-wise count rates for Quadrant B Data is divided into 100 sec bins |
 |
 |
| Module-wise count rates for Quadrant C Data is divided into 100 sec bins |
 |
 |
| Module-wise count rates for Quadrant D Data is divided into 100 sec bins |
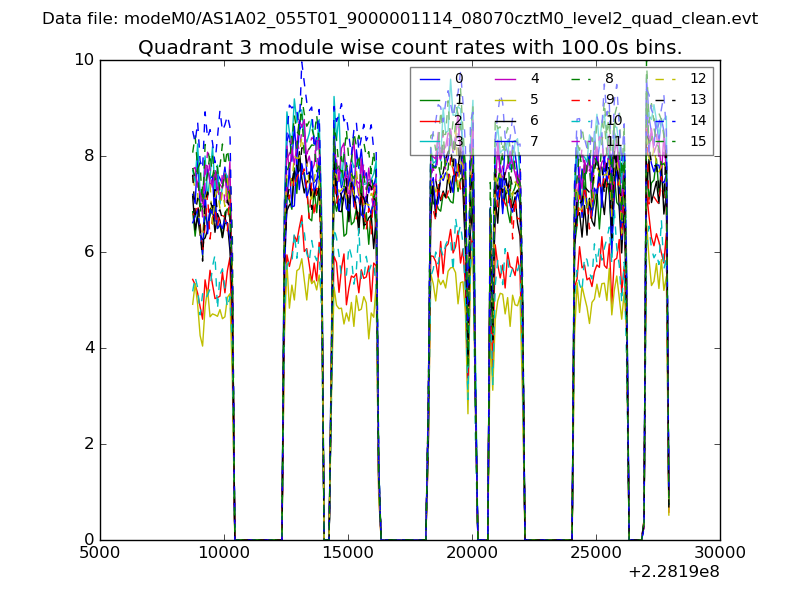 |
 |
| Parameter | Plot |
|---|---|
| CZT HV Monitor | 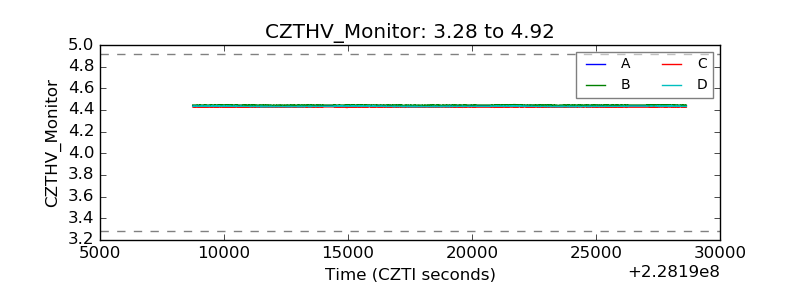 |
| D_VDD | 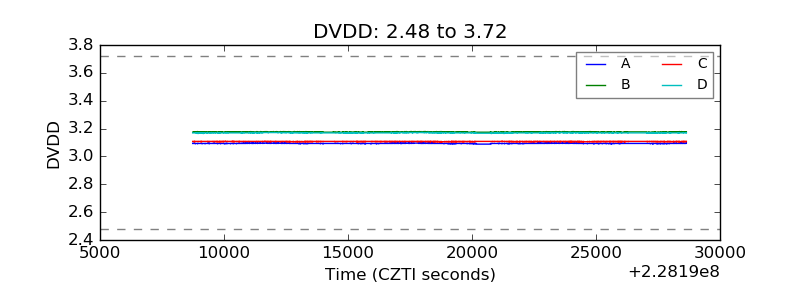 |
| Temperature 1 | 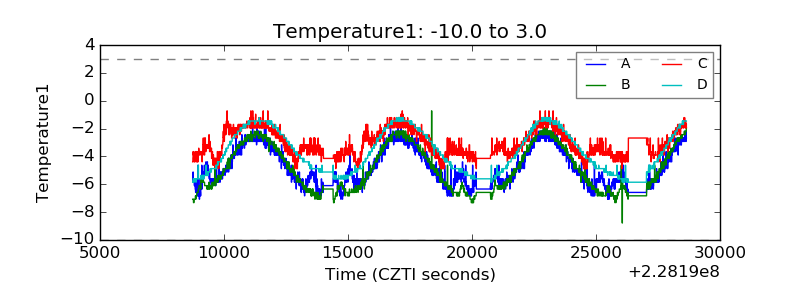 |
| Veto HV Monitor |  |
| Veto LLD | 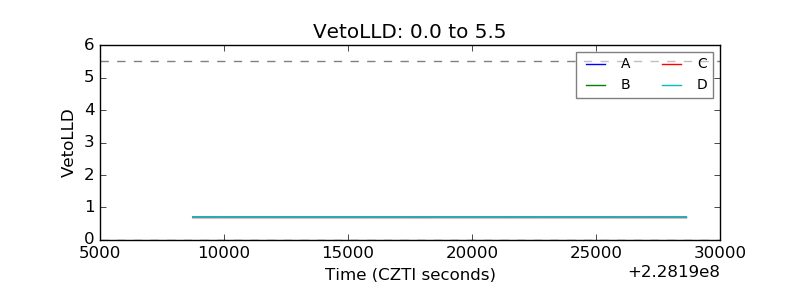 |
| Alpha Counter | 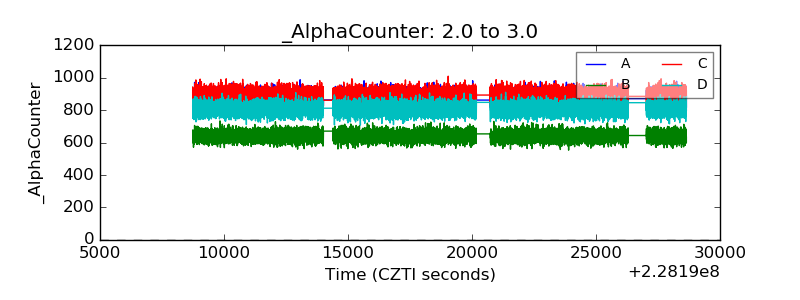 |
| _CPM_Rate | 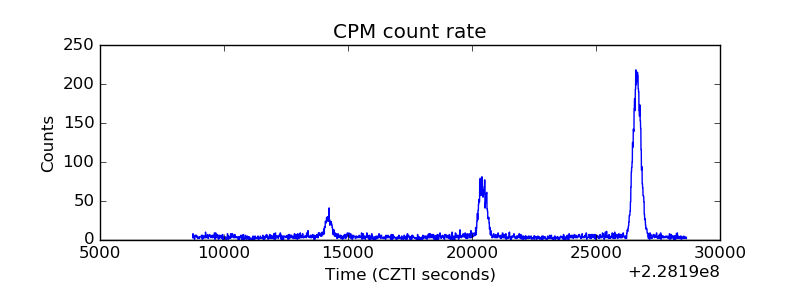 |
| CZT Counter | 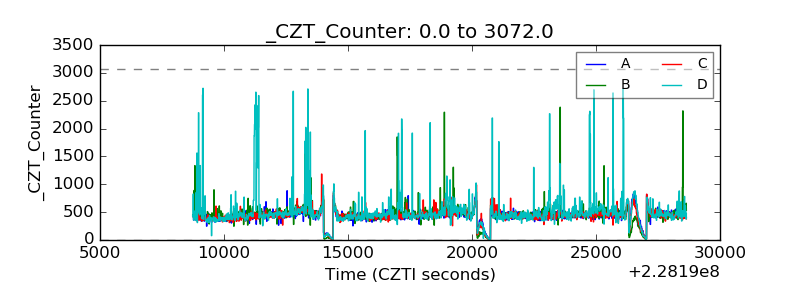 |
| +2.5 Volts monitor |  |
| +5 Volts monitor |  |
| _ROLL_ROT | 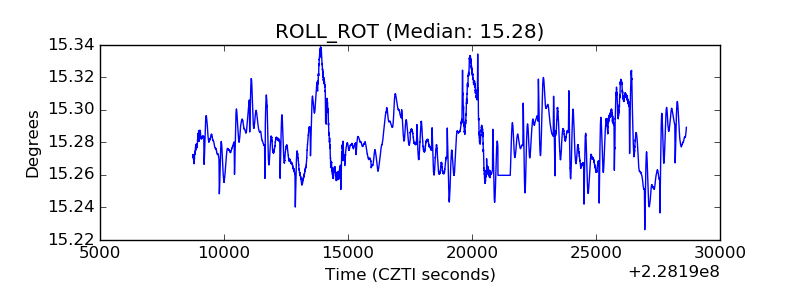 |
| _Roll_DEC | 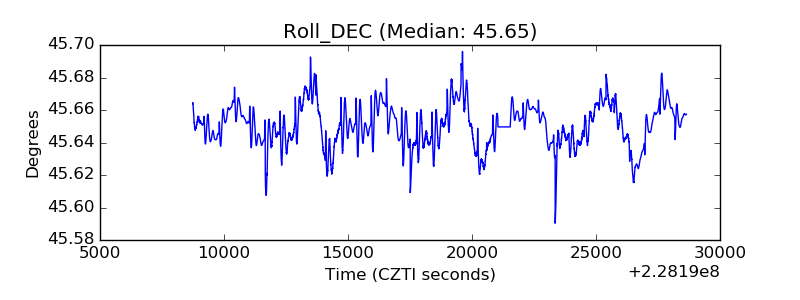 |
| _Roll_RA | 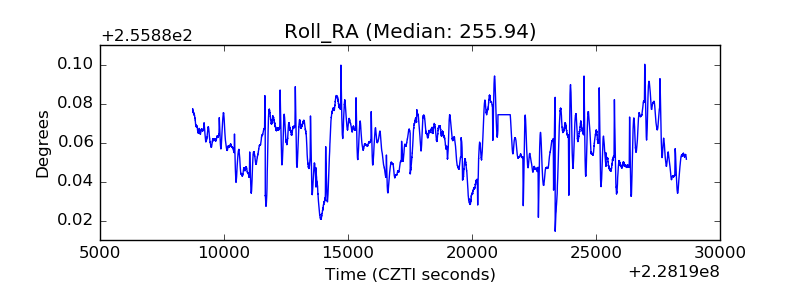 |
| Veto Counter | 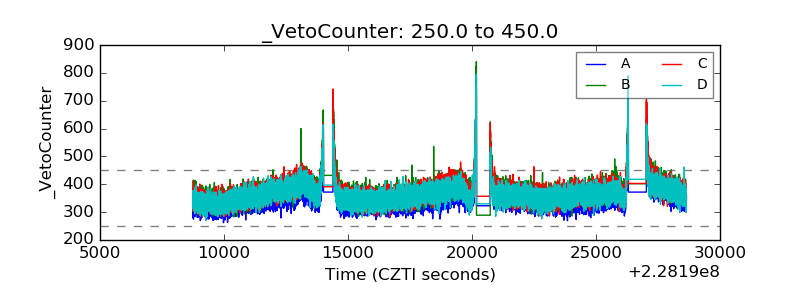 |