| Param | Original file | Final file |
|---|---|---|
| Filename | modeM0/AS1A02_055T01_9000001114_08075cztM0_level2.evt | modeM0/AS1A02_055T01_9000001114_08075cztM0_level2_quad_clean.evt |
| Size (bytes) | 488,378,880 | 72,000,000 |
| Size | 465.8 MB | 68.7 MB |
| Events in quadrant A | 3,235,098 | 437,553 |
| Events in quadrant B | 3,367,417 | 447,690 |
| Events in quadrant C | 3,160,887 | 453,112 |
| Events in quadrant D | 4,610,234 | 412,569 |
| Mode M0 | |||
|---|---|---|---|
| Quadrant | BADHDUFLAG | Total packets | Discarded packets |
| A | 0 | 13827 | 3 |
| B | 0 | 14081 | 2 |
| C | 0 | 13419 | 2 |
| D | 0 | 17729 | 2 |
| Mode M9 | |||
|---|---|---|---|
| Quadrant | BADHDUFLAG | Total packets | Discarded packets |
| A | 0 | 13 | 0 |
| B | 0 | 13 | 0 |
| C | 0 | 13 | 0 |
| D | 0 | 13 | 0 |
| Mode SS | |||
|---|---|---|---|
| Quadrant | BADHDUFLAG | Total packets | Discarded packets |
| A | 0 | 126 | 0 |
| B | 0 | 126 | 0 |
| C | 0 | 126 | 0 |
| D | 0 | 126 | 0 |
| Quadrant | Total seconds | Saturated seconds | Saturation percentage |
|---|---|---|---|
| A | 6142 | 57 | 0.928036% |
| B | 6142 | 76 | 1.237382% |
| C | 6142 | 45 | 0.732660% |
| D | 6142 | 457 | 7.440573% |
Noise dominated data is calculated using 1-second bins in cleaned event files. If a bin has >2000 counts, and if more than 50% of those come from <1% of pixels, then it is considered to be noise-dominated and hence unusable.
| Quadrant | # 1 sec bins | Bins with >0 counts | Bins with >2000 counts | High rate bins dominated by noise | Noise dominated (total time) | Noise dominated (detector-on time) | Marked lightcurve |
|---|---|---|---|---|---|---|---|
| A | 7452 | 6143 | 0 | 0 | 0.00% | 0.00% |  |
| B | 7452 | 6143 | 14 | 14 | 0.19% | 0.23% | 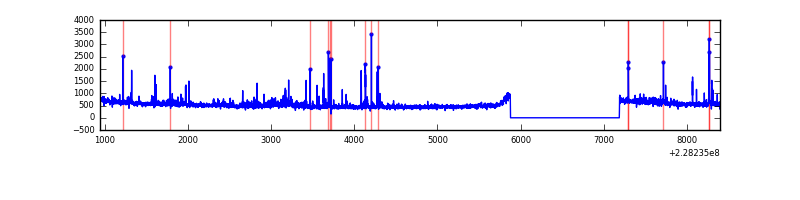 |
| C | 7452 | 6143 | 0 | 0 | 0.00% | 0.00% | 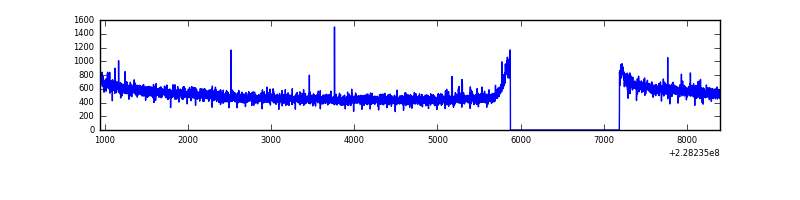 |
| D | 7452 | 6143 | 387 | 387 | 5.19% | 6.30% | 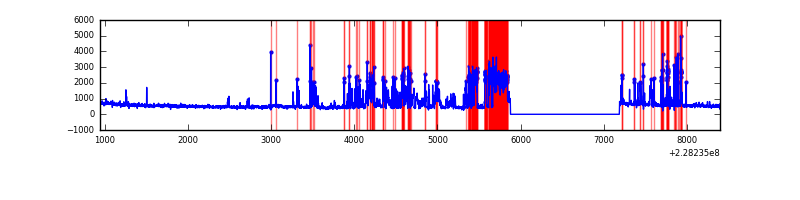 |
Top three noisy pixels from each quadrant. If the there are fewer than three noisy pixels in the level2.evt file, extra rows are filled as -1
| Pixel properties | Quadrant properties | ||||||
|---|---|---|---|---|---|---|---|
| Quadrant | DetID | PixID | Counts | Sigma | Mean | Median | Sigma |
| A | 0 | 128 | 145318 | 898.29 | 801 | 787 | 160.9 |
| A | 0 | 254 | 7631 | 42.54 | 801 | 787 | 160.9 |
| A | 0 | 226 | 7475 | 41.57 | 801 | 787 | 160.9 |
| B | 11 | 51 | 111563 | 736.99 | 804 | 785 | 150.3 |
| B | 10 | 16 | 63587 | 417.81 | 804 | 785 | 150.3 |
| B | 0 | 214 | 42019 | 274.32 | 804 | 785 | 150.3 |
| C | 1 | 16 | 58306 | 320.06 | 791 | 799 | 179.7 |
| C | 8 | 222 | 8895 | 45.06 | 791 | 799 | 179.7 |
| C | 9 | 15 | 6702 | 32.85 | 791 | 799 | 179.7 |
| D | 1 | 52 | 1456302 | 7310.82 | 761 | 744 | 199.1 |
| D | 7 | 71 | 196739 | 984.42 | 761 | 744 | 199.1 |
| D | 1 | 83 | 26628 | 130.0 | 761 | 744 | 199.1 |
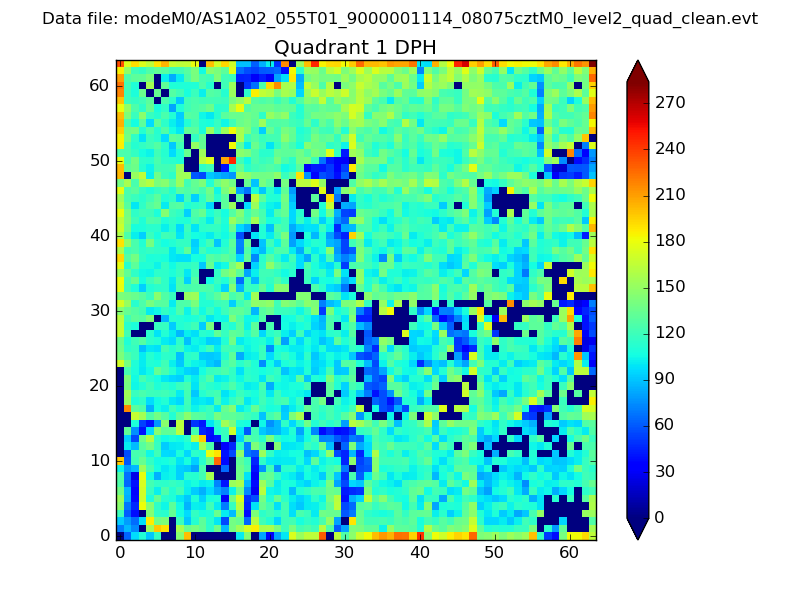
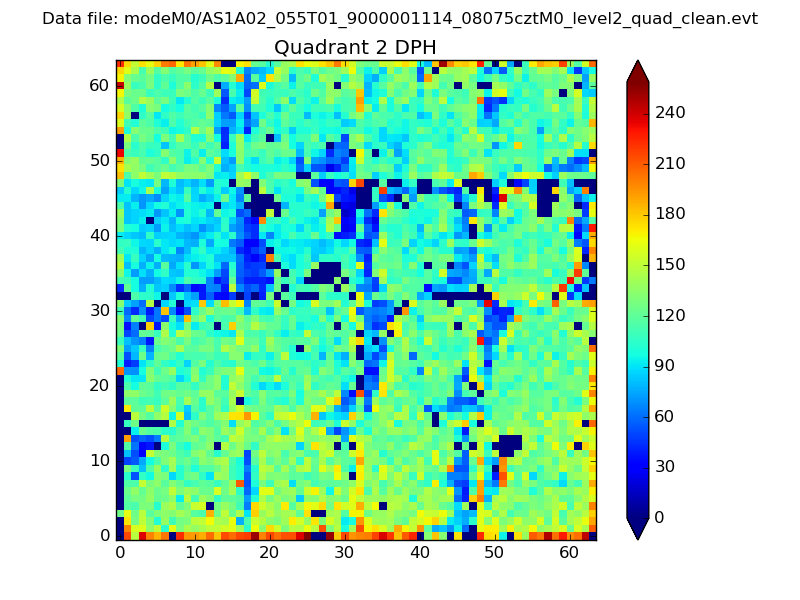
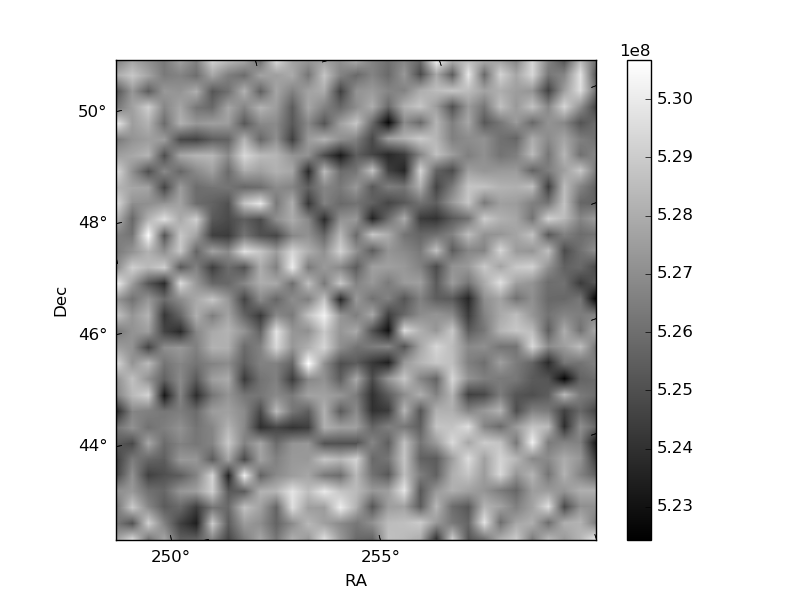
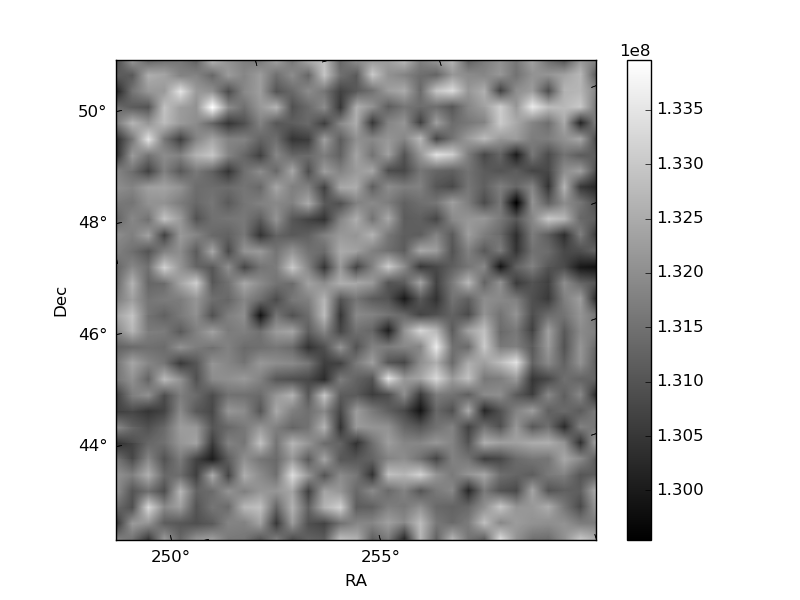
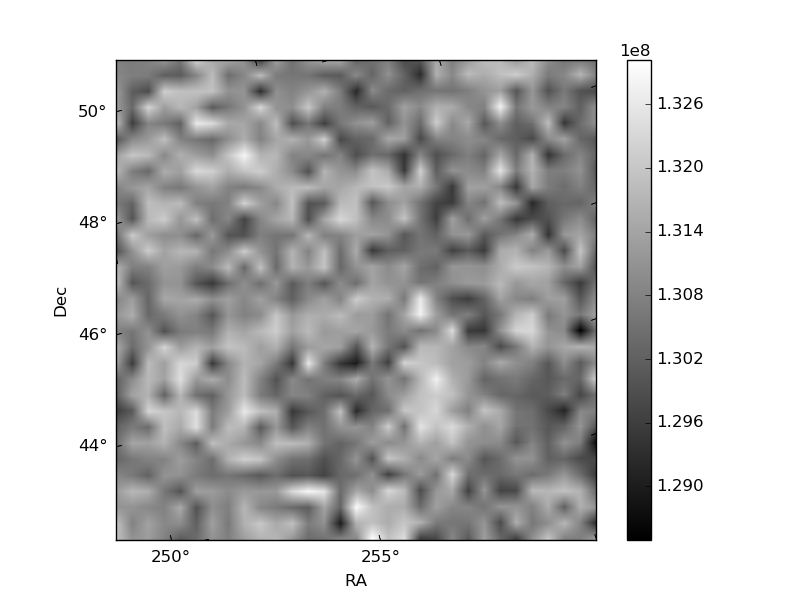
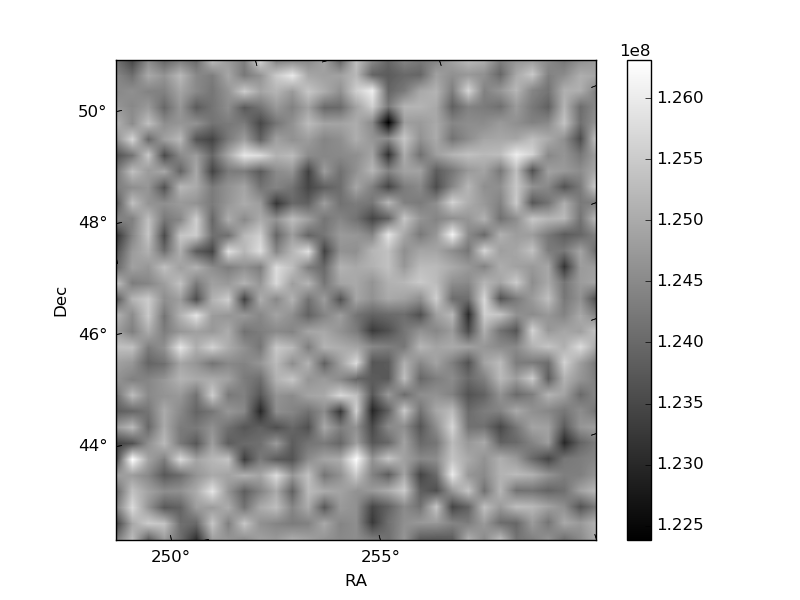
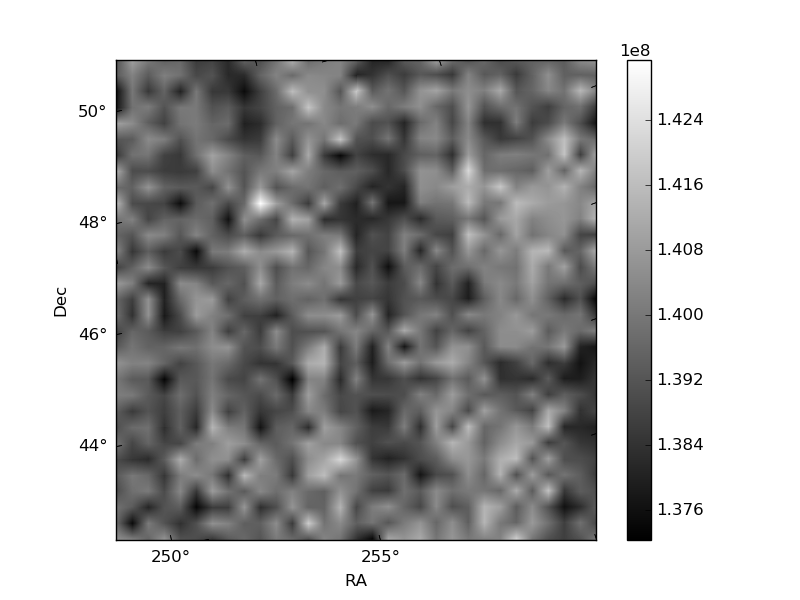
Histogram calculated using DETX and DETY for each event in the final _common_clean file
| Quadrant A | 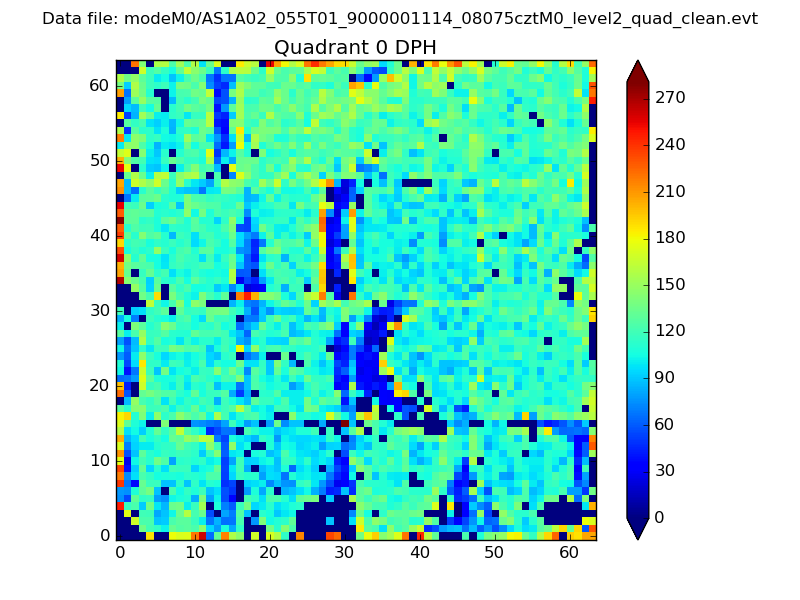 |
 |
Quadrant B |
|---|---|---|---|
| Quadrant D | 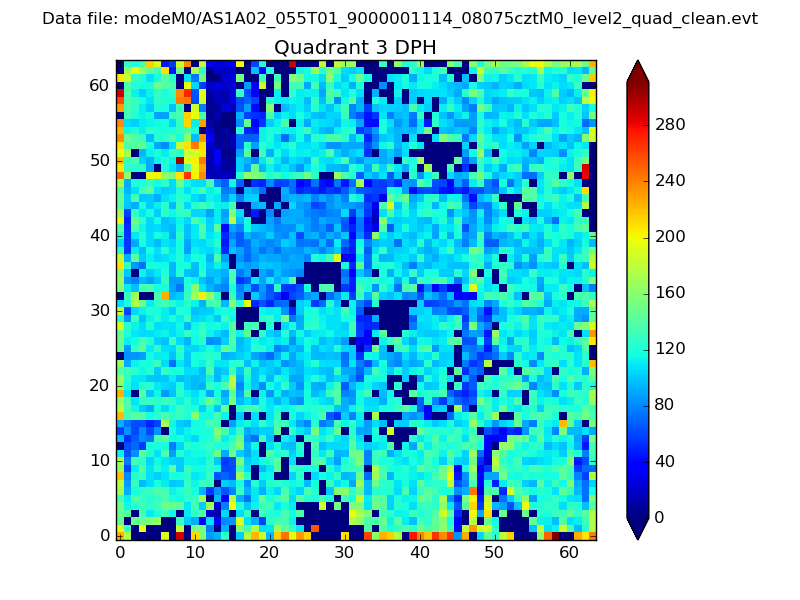 |
 |
Quadrant C |
| Plot type | Count rate plots | Images |
|---|---|---|
| Comparison with Poisson distribution Blue bars denote a histogram of data divided into 1 sec bins. Red curve is a Poisson curve with rate = median count rate of data. |
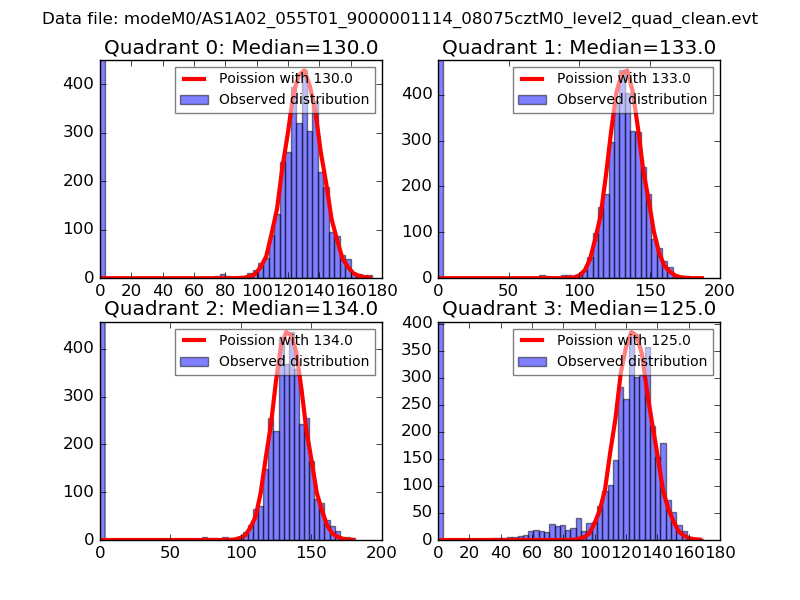 |
 |
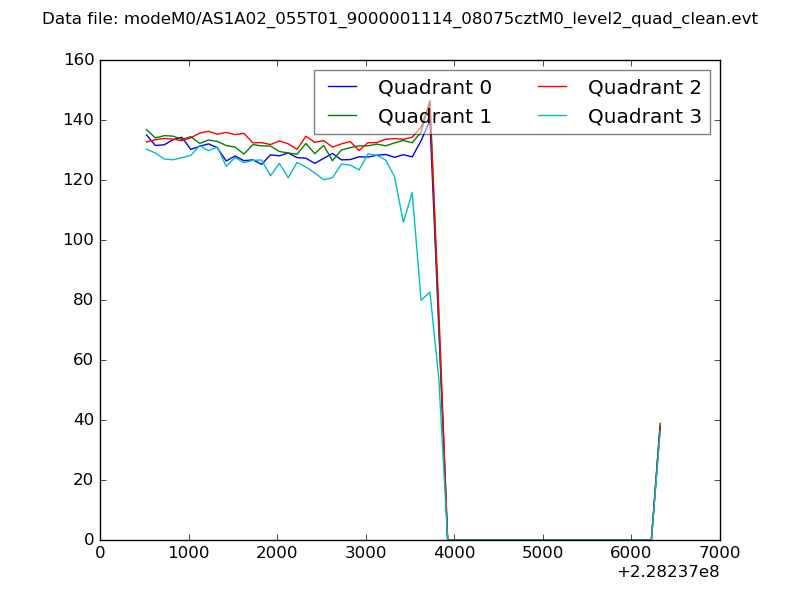
| Quadrant-wise count rates Data is divided into 100 sec bins |
 |
|
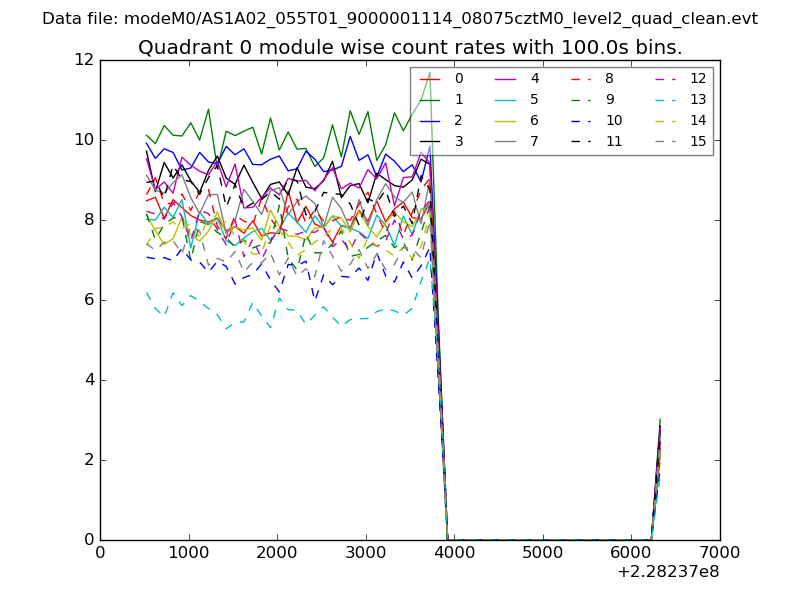
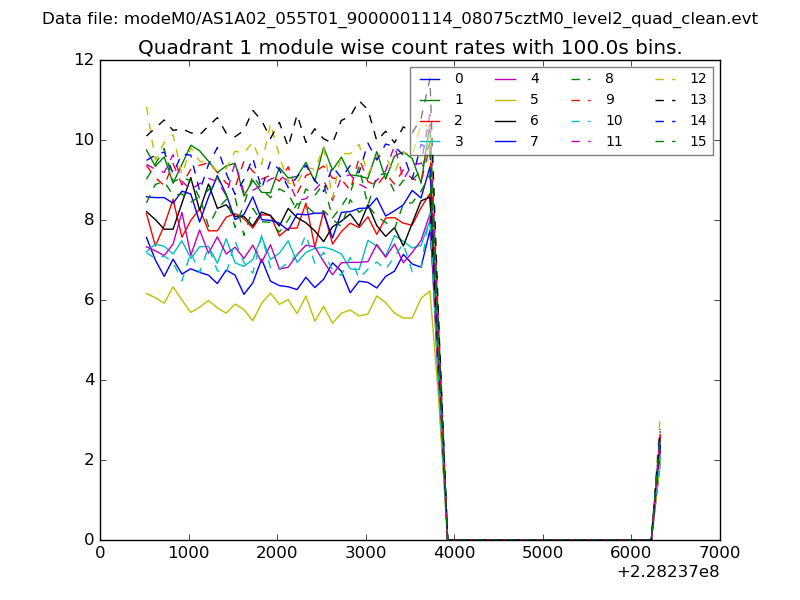
| Module-wise count rates for Quadrant A Data is divided into 100 sec bins |
 |
 |
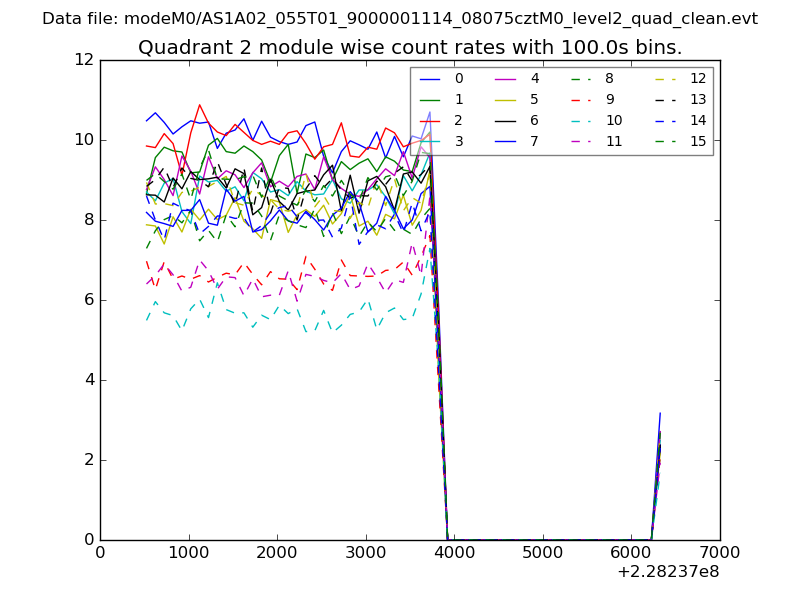
| Module-wise count rates for Quadrant B Data is divided into 100 sec bins |
 |
 |
| Module-wise count rates for Quadrant C Data is divided into 100 sec bins |
 |
 |
| Module-wise count rates for Quadrant D Data is divided into 100 sec bins |
 |
 |
| Parameter | Plot |
|---|---|
| CZT HV Monitor | 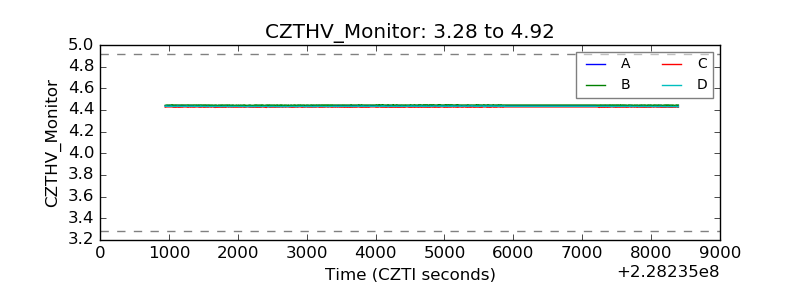 |
| D_VDD |  |
| Temperature 1 | 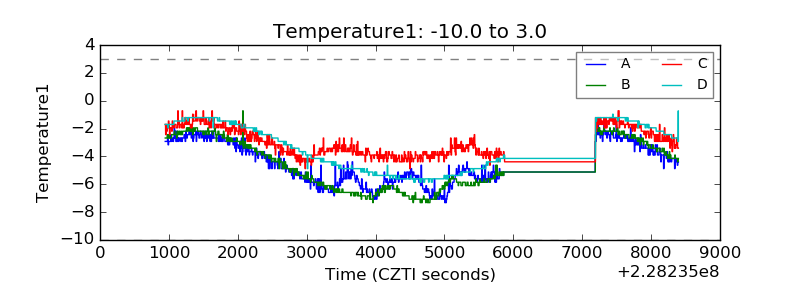 |
| Veto HV Monitor | 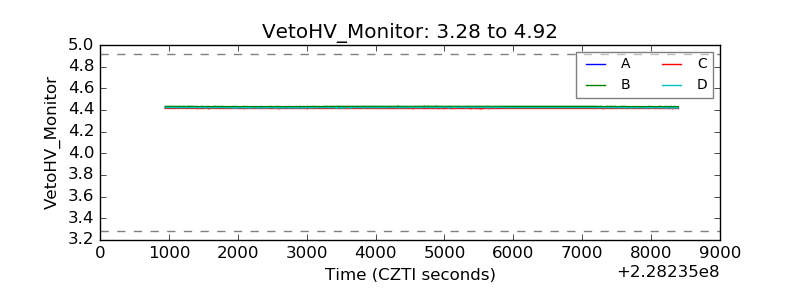 |
| Veto LLD | 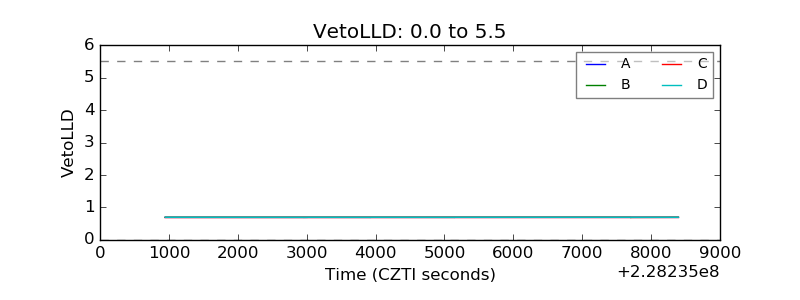 |
| Alpha Counter | 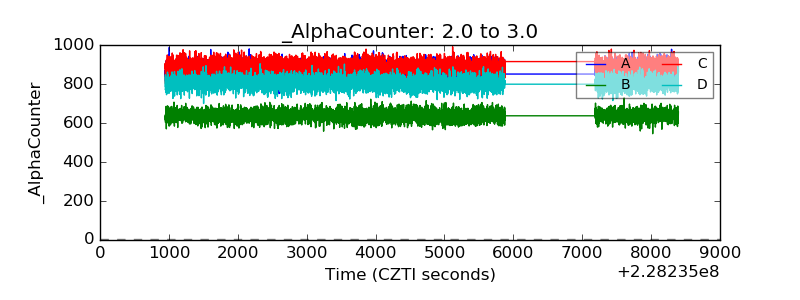 |
| _CPM_Rate | 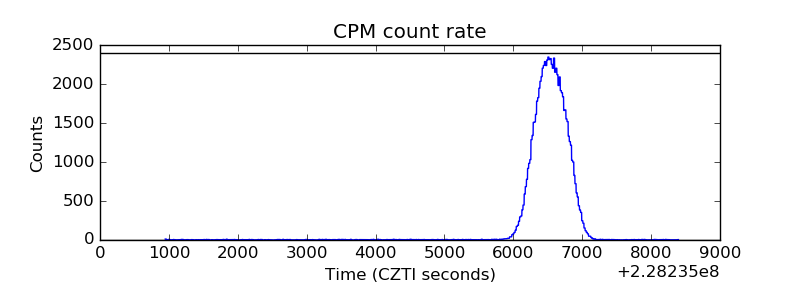 |
| CZT Counter | 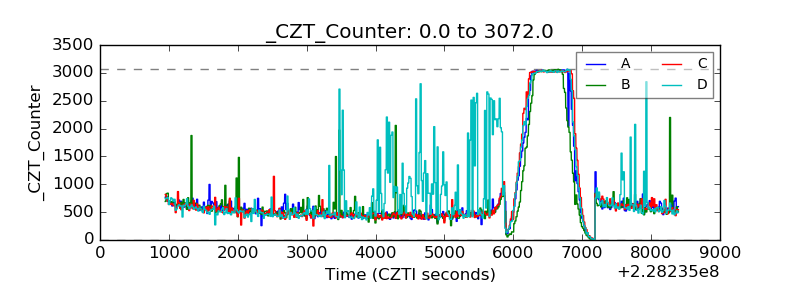 |
| +2.5 Volts monitor |  |
| +5 Volts monitor | 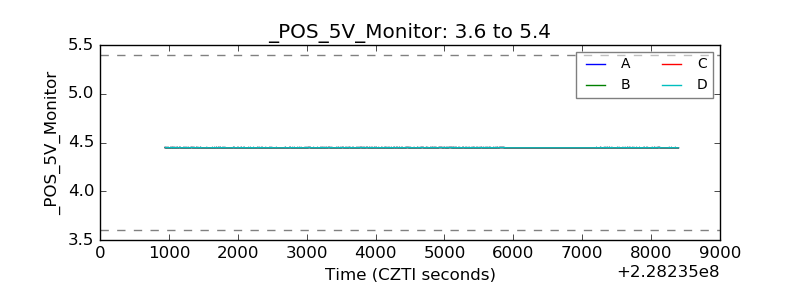 |
| _ROLL_ROT | 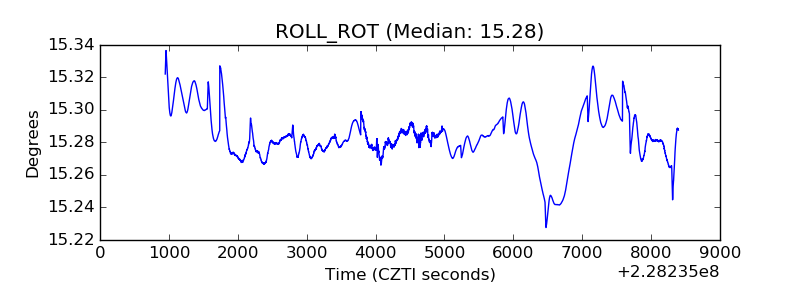 |
| _Roll_DEC | 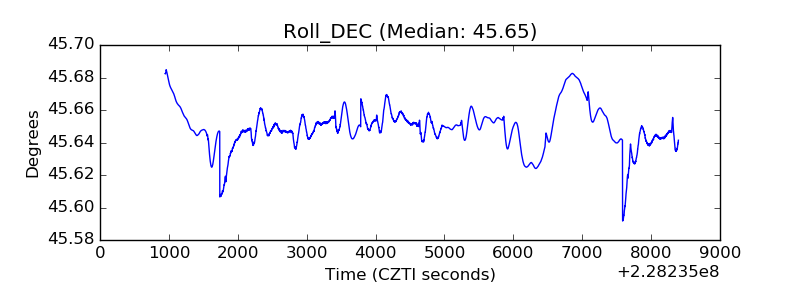 |
| _Roll_RA | 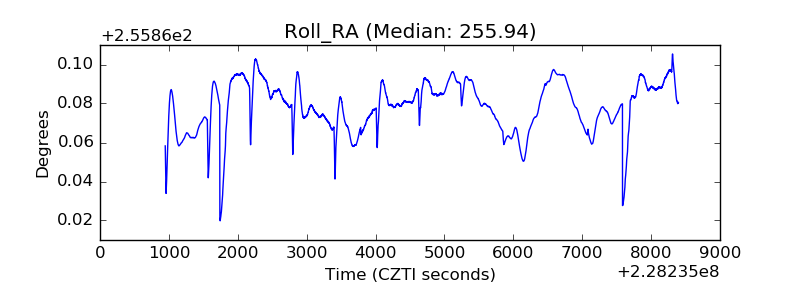 |
| Veto Counter | 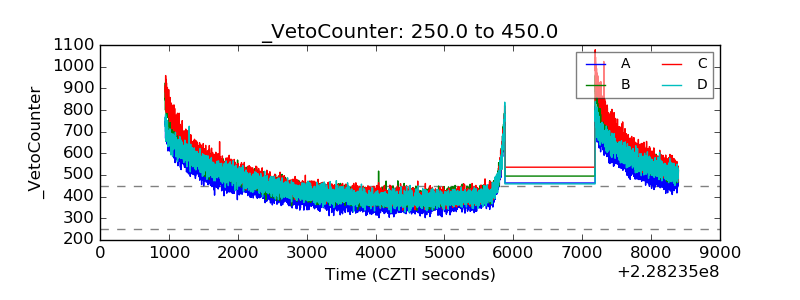 |