| Param | Original file | Final file |
|---|---|---|
| Filename | modeM0/AS1A02_055T01_9000001114_08076cztM0_level2.evt | modeM0/AS1A02_055T01_9000001114_08076cztM0_level2_quad_clean.evt |
| Size (bytes) | 484,793,280 | 90,604,800 |
| Size | 462.3 MB | 86.4 MB |
| Events in quadrant A | 3,264,009 | 571,390 |
| Events in quadrant B | 3,373,246 | 589,356 |
| Events in quadrant C | 3,250,152 | 595,053 |
| Events in quadrant D | 4,371,816 | 553,273 |
| Mode M0 | |||
|---|---|---|---|
| Quadrant | BADHDUFLAG | Total packets | Discarded packets |
| A | 0 | 13792 | 3 |
| B | 0 | 14065 | 2 |
| C | 0 | 13715 | 2 |
| D | 0 | 17171 | 2 |
| Mode M9 | |||
|---|---|---|---|
| Quadrant | BADHDUFLAG | Total packets | Discarded packets |
| A | 0 | 27 | 0 |
| B | 0 | 27 | 0 |
| C | 0 | 27 | 0 |
| D | 0 | 27 | 0 |
| Mode SS | |||
|---|---|---|---|
| Quadrant | BADHDUFLAG | Total packets | Discarded packets |
| A | 0 | 128 | 0 |
| B | 0 | 128 | 0 |
| C | 0 | 128 | 0 |
| D | 0 | 128 | 0 |
| Quadrant | Total seconds | Saturated seconds | Saturation percentage |
|---|---|---|---|
| A | 6228 | 107 | 1.718048% |
| B | 6228 | 129 | 2.071291% |
| C | 6228 | 89 | 1.429030% |
| D | 6228 | 499 | 8.012203% |
Noise dominated data is calculated using 1-second bins in cleaned event files. If a bin has >2000 counts, and if more than 50% of those come from <1% of pixels, then it is considered to be noise-dominated and hence unusable.
| Quadrant | # 1 sec bins | Bins with >0 counts | Bins with >2000 counts | High rate bins dominated by noise | Noise dominated (total time) | Noise dominated (detector-on time) | Marked lightcurve |
|---|---|---|---|---|---|---|---|
| A | 8873 | 6230 | 0 | 0 | 0.00% | 0.00% | 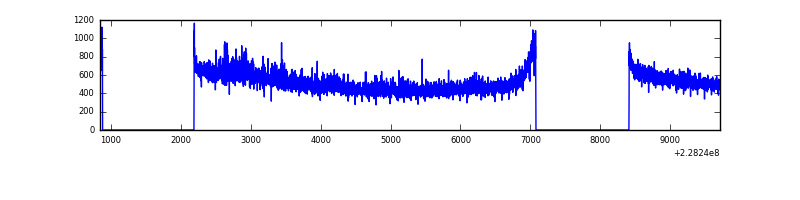 |
| B | 8873 | 6230 | 8 | 8 | 0.09% | 0.13% | 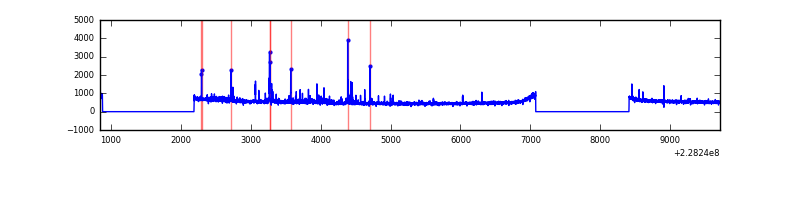 |
| C | 8873 | 6230 | 0 | 0 | 0.00% | 0.00% | 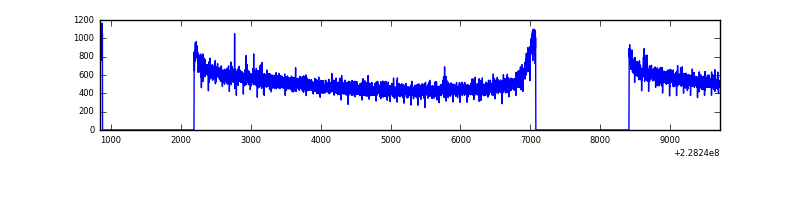 |
| D | 8873 | 6230 | 407 | 407 | 4.59% | 6.53% | 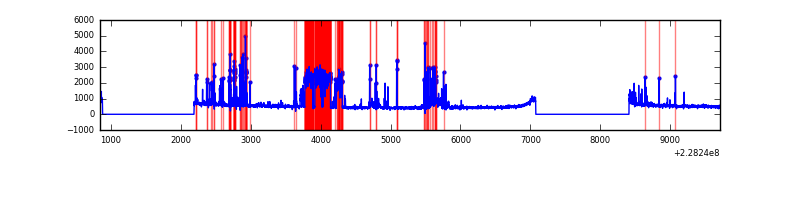 |
Top three noisy pixels from each quadrant. If the there are fewer than three noisy pixels in the level2.evt file, extra rows are filled as -1
| Pixel properties | Quadrant properties | ||||||
|---|---|---|---|---|---|---|---|
| Quadrant | DetID | PixID | Counts | Sigma | Mean | Median | Sigma |
| A | 0 | 128 | 116582 | 706.92 | 818 | 802 | 163.8 |
| A | 0 | 226 | 7584 | 41.41 | 818 | 802 | 163.8 |
| A | 12 | 194 | 7433 | 40.49 | 818 | 802 | 163.8 |
| B | 11 | 51 | 89827 | 575.78 | 828 | 810 | 154.6 |
| B | 10 | 16 | 34980 | 221.02 | 828 | 810 | 154.6 |
| B | 4 | 81 | 19438 | 120.49 | 828 | 810 | 154.6 |
| C | 1 | 16 | 44652 | 235.06 | 819 | 825 | 186.5 |
| C | 9 | 15 | 6611 | 31.03 | 819 | 825 | 186.5 |
| C | 13 | 61 | 6302 | 29.37 | 819 | 825 | 186.5 |
| D | 1 | 52 | 1088956 | 5173.14 | 790 | 774 | 210.4 |
| D | 7 | 71 | 204375 | 967.9 | 790 | 774 | 210.4 |
| D | 12 | 233 | 29330 | 135.75 | 790 | 774 | 210.4 |
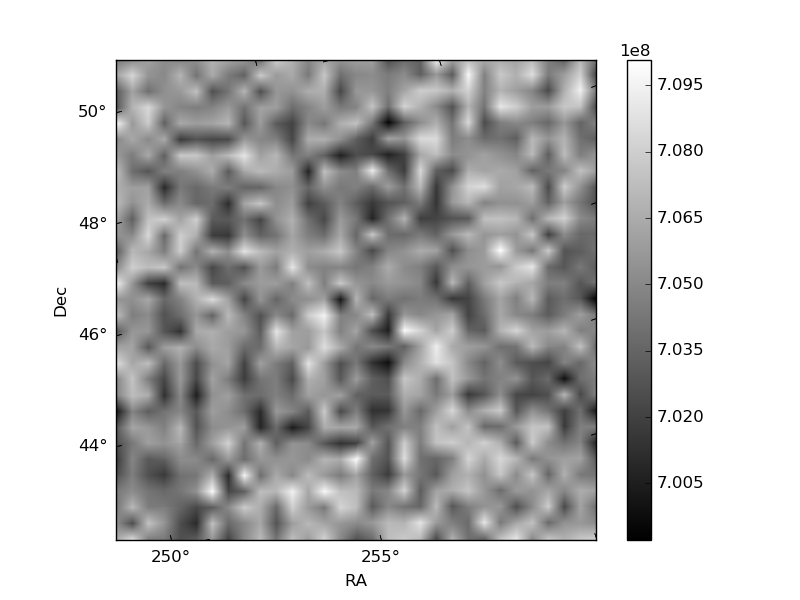
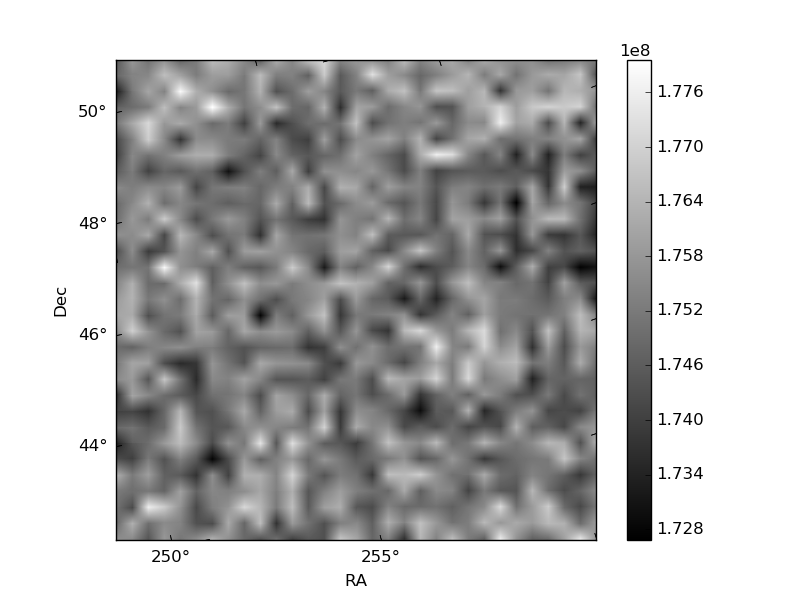
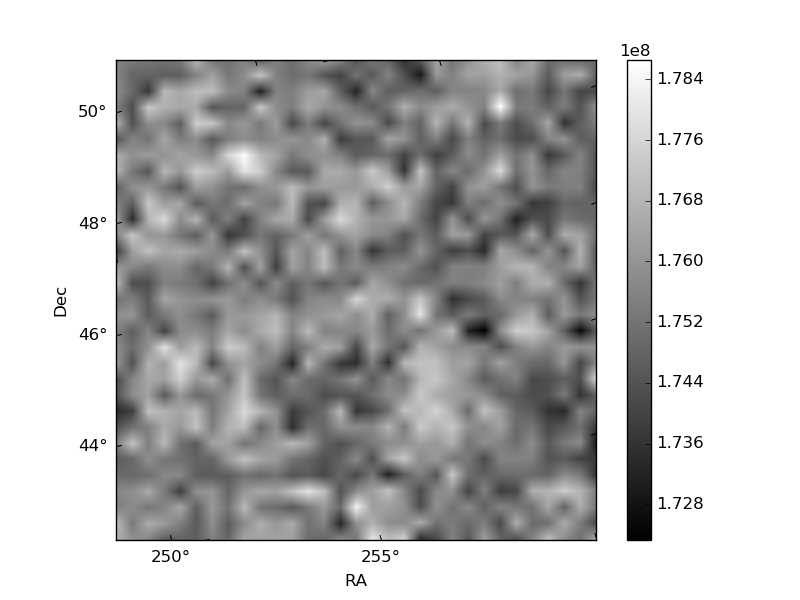
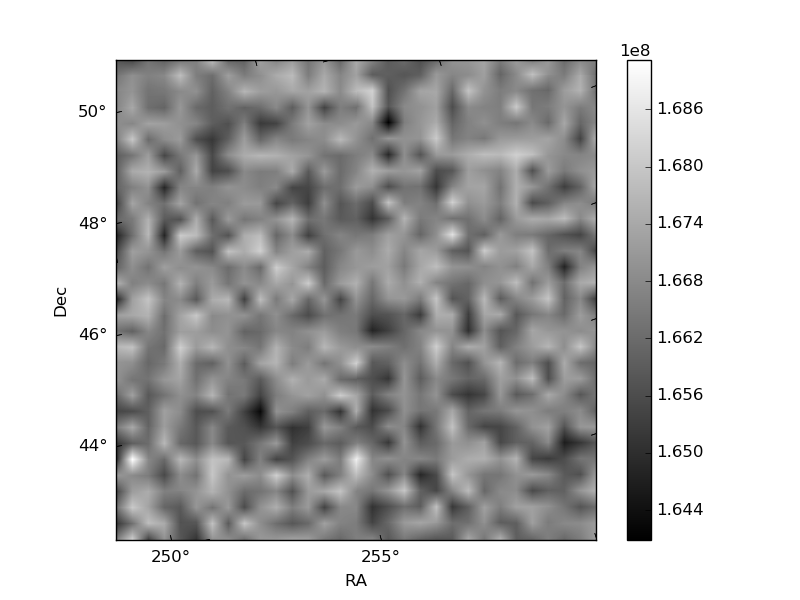
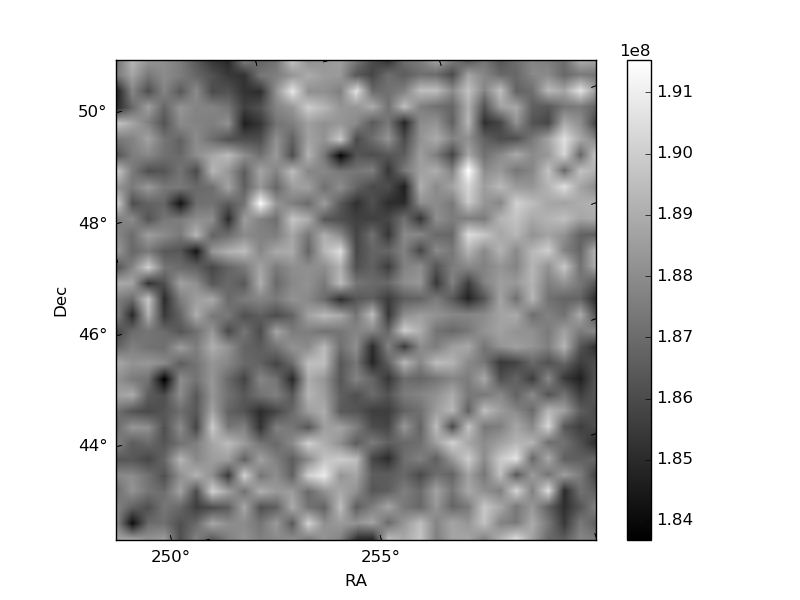
Histogram calculated using DETX and DETY for each event in the final _common_clean file
| Quadrant A | 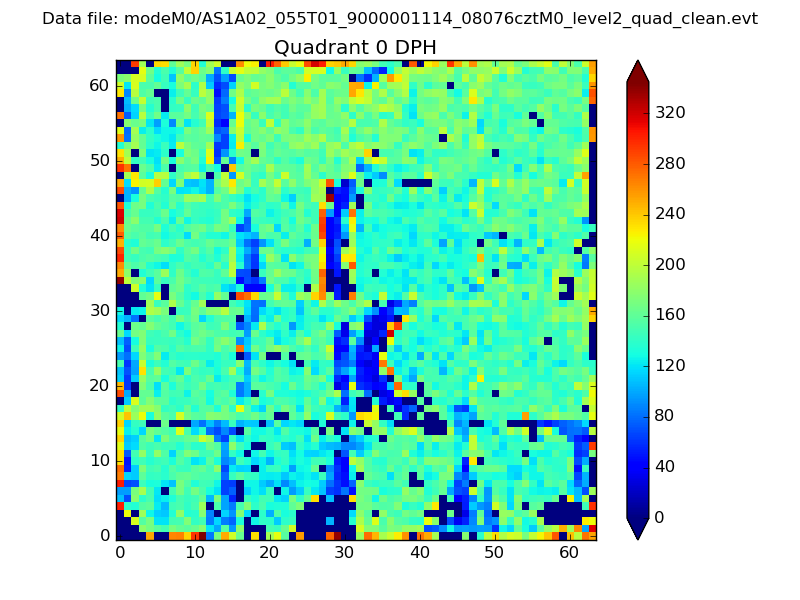 |
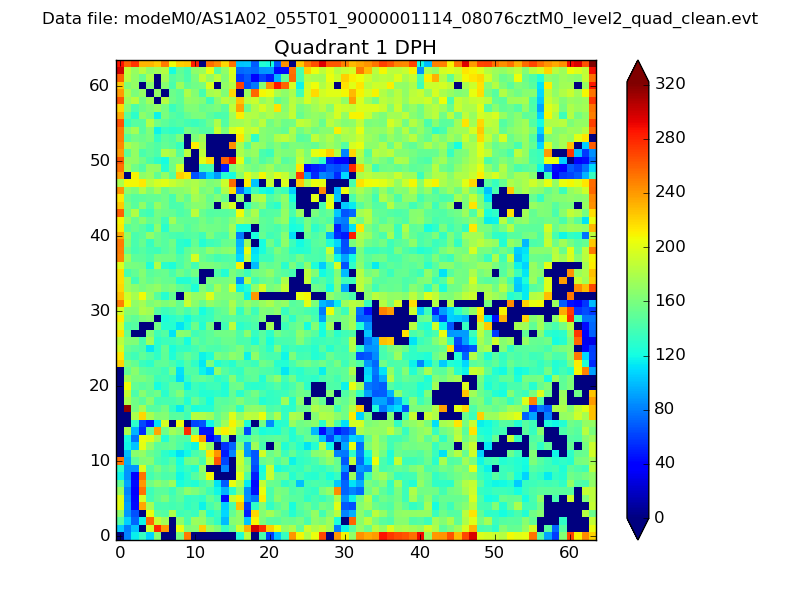 |
Quadrant B |
|---|---|---|---|
| Quadrant D | 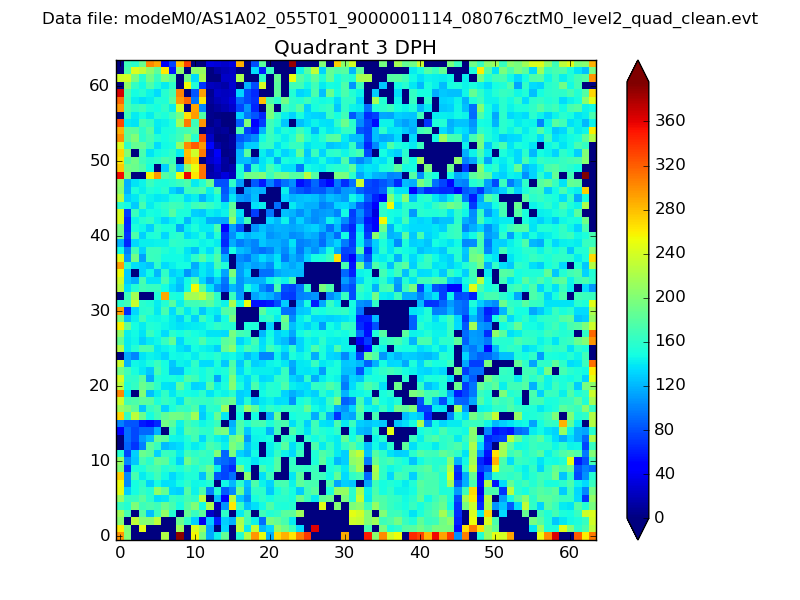 |
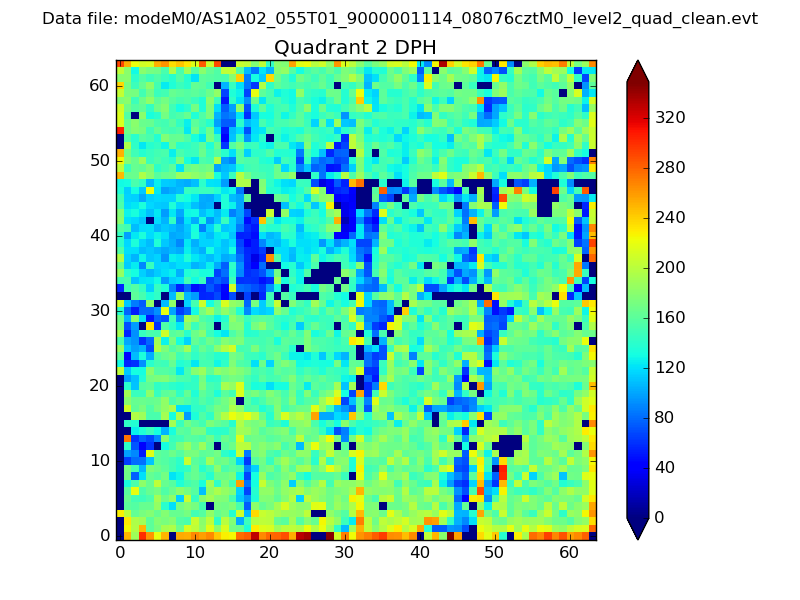 |
Quadrant C |
| Plot type | Count rate plots | Images |
|---|---|---|
| Comparison with Poisson distribution Blue bars denote a histogram of data divided into 1 sec bins. Red curve is a Poisson curve with rate = median count rate of data. |
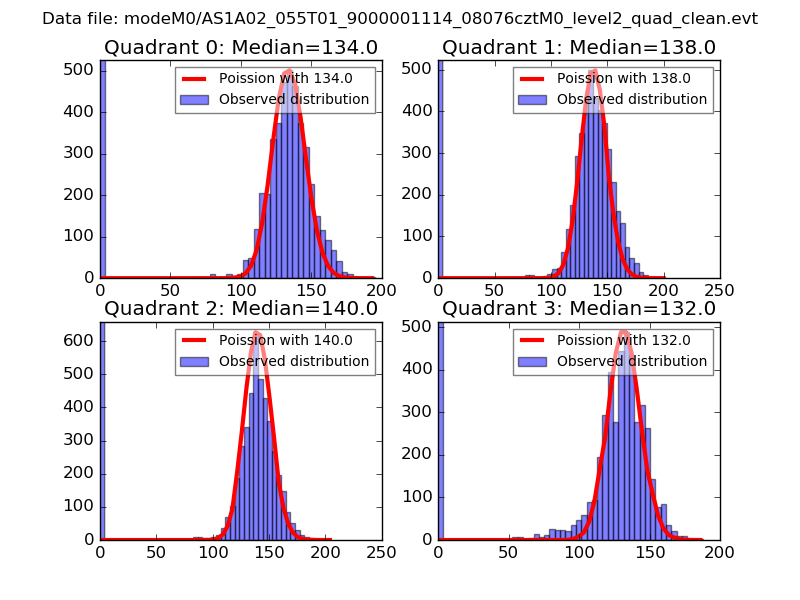 |
 |
| Quadrant-wise count rates Data is divided into 100 sec bins |
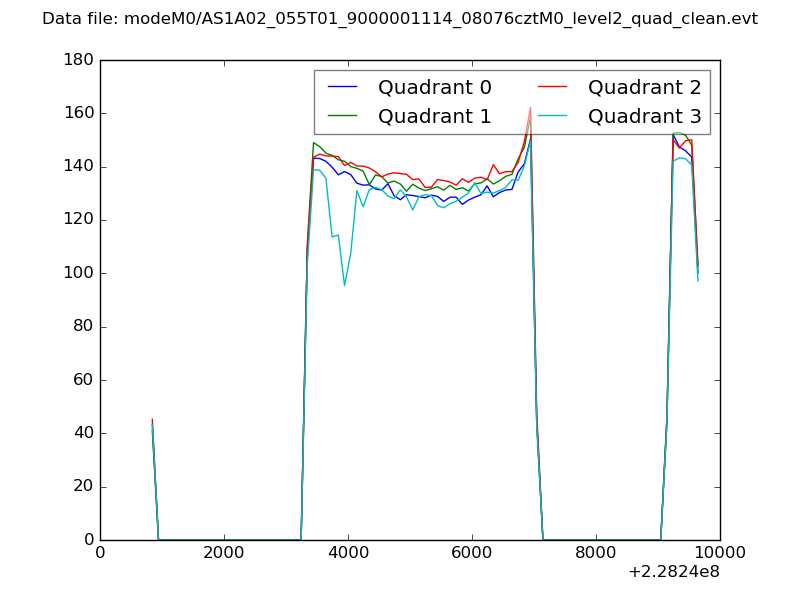 |
|
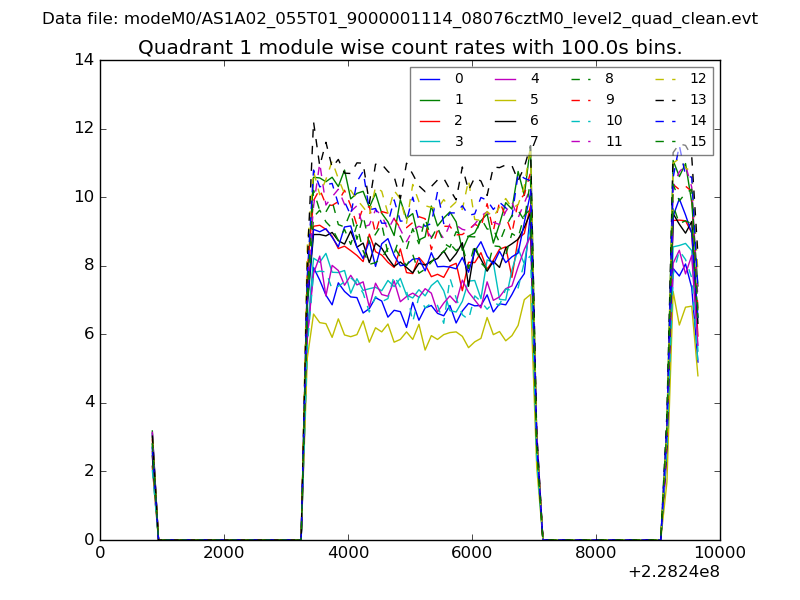
| Module-wise count rates for Quadrant A Data is divided into 100 sec bins |
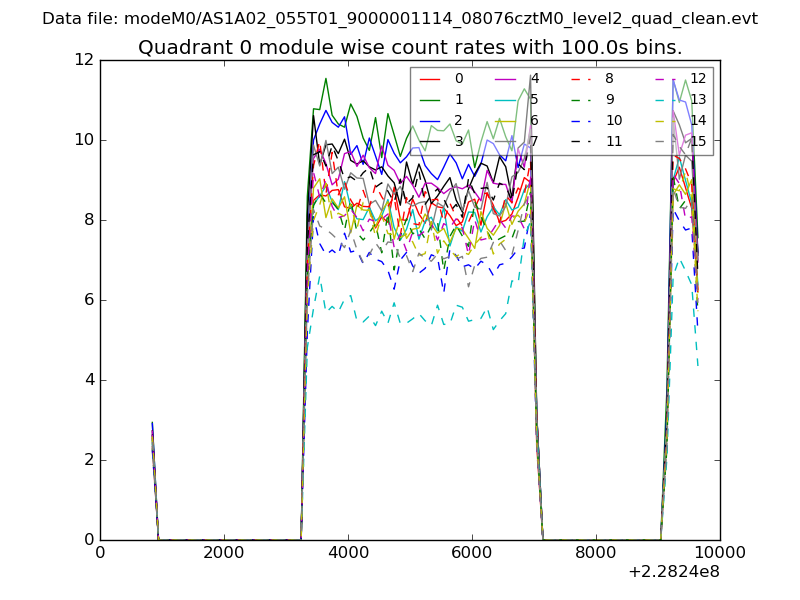 |
 |
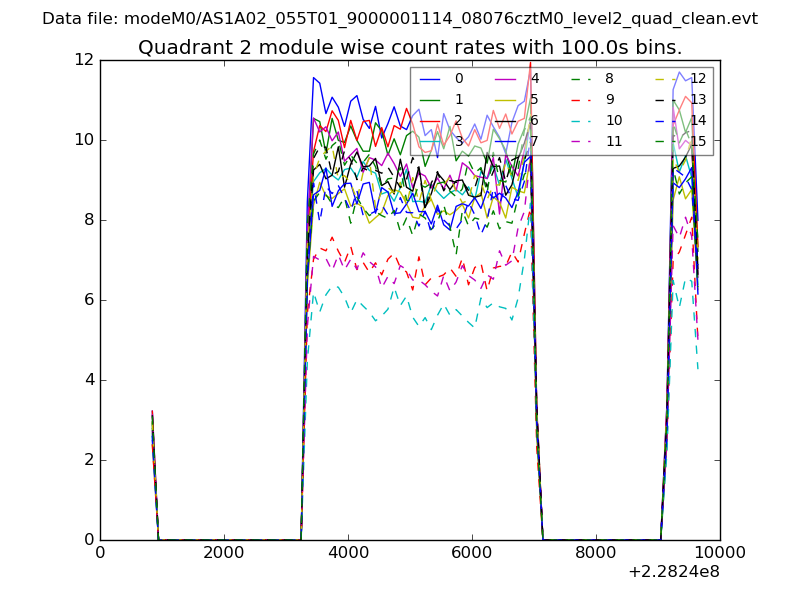
| Module-wise count rates for Quadrant B Data is divided into 100 sec bins |
 |
 |
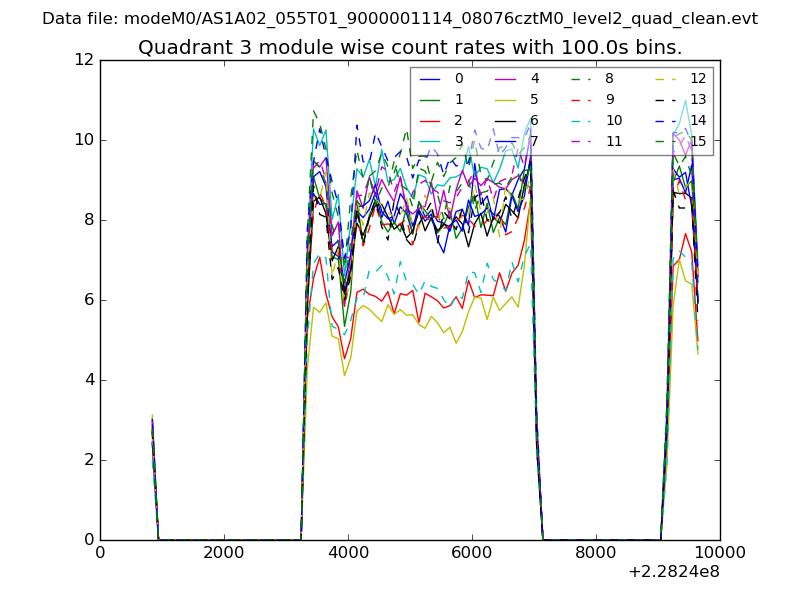
| Module-wise count rates for Quadrant C Data is divided into 100 sec bins |
 |
 |
| Module-wise count rates for Quadrant D Data is divided into 100 sec bins |
 |
 |
| Parameter | Plot |
|---|---|
| CZT HV Monitor | 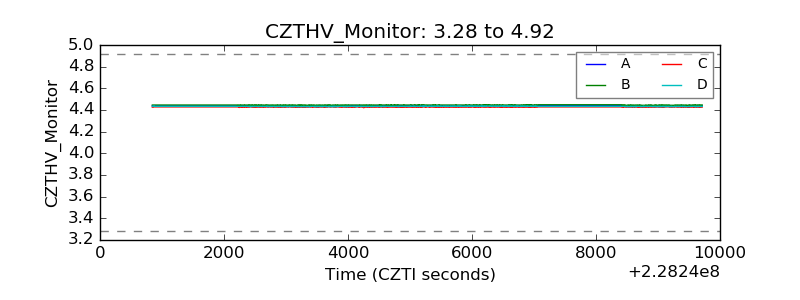 |
| D_VDD | 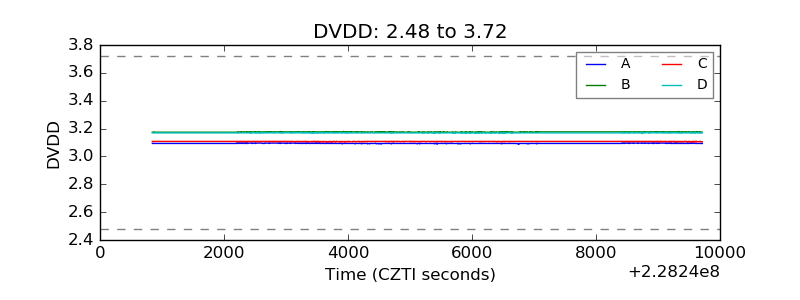 |
| Temperature 1 | 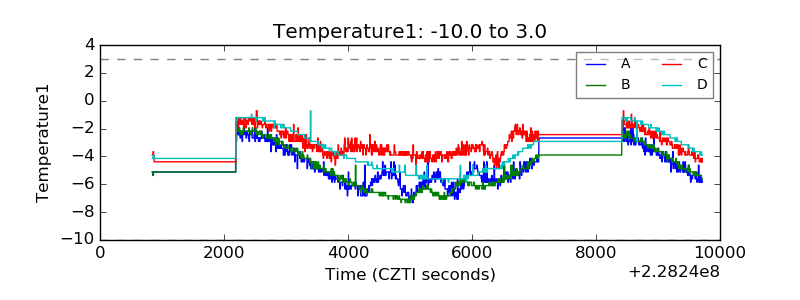 |
| Veto HV Monitor | 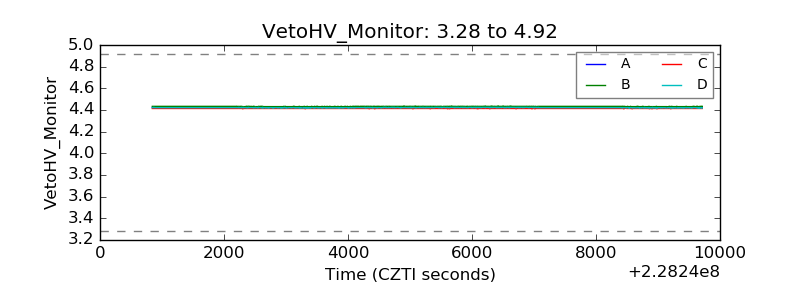 |
| Veto LLD | 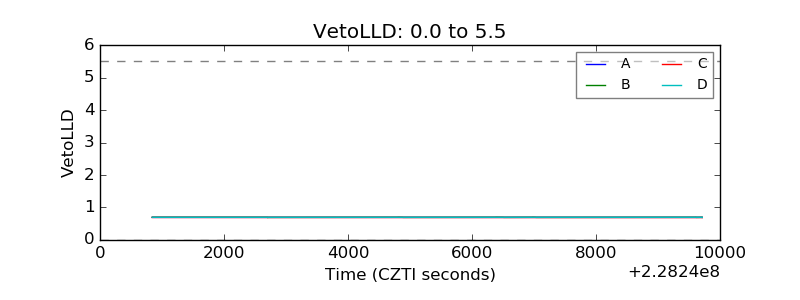 |
| Alpha Counter | 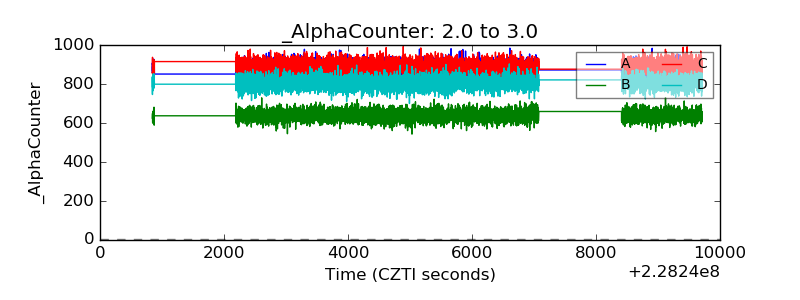 |
| _CPM_Rate | 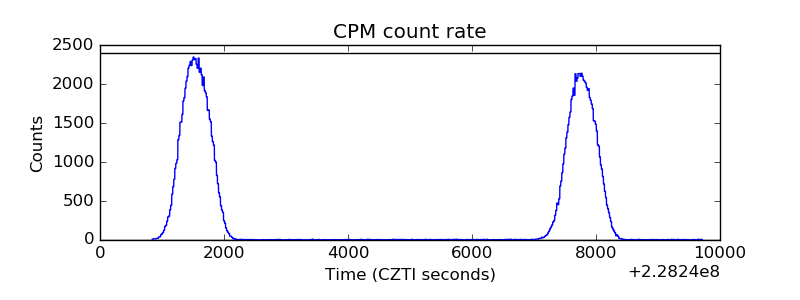 |
| CZT Counter | 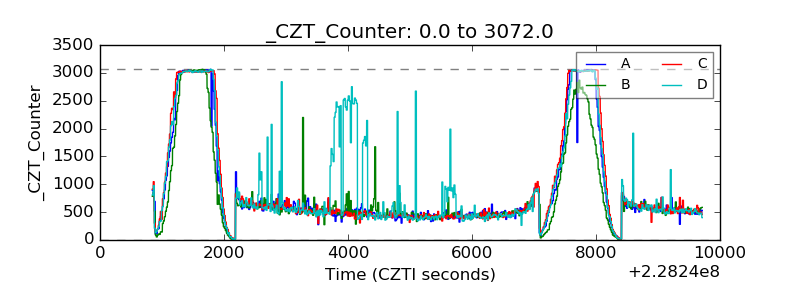 |
| +2.5 Volts monitor |  |
| +5 Volts monitor |  |
| _ROLL_ROT | 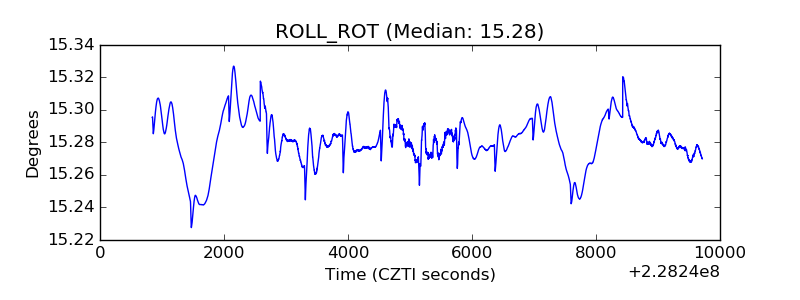 |
| _Roll_DEC | 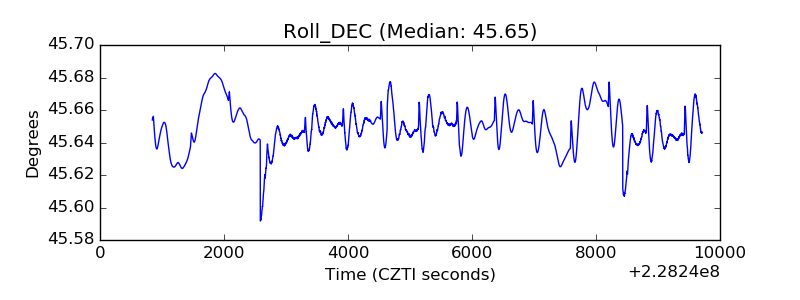 |
| _Roll_RA | 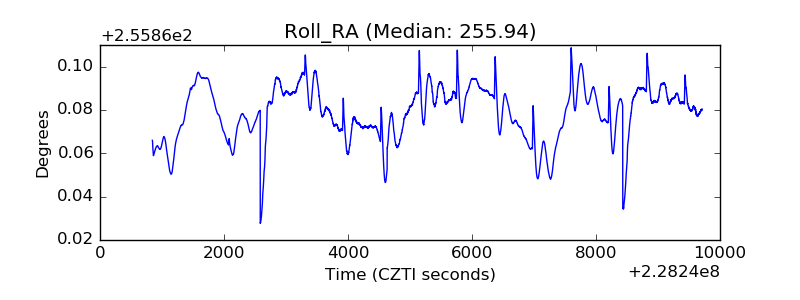 |
| Veto Counter | 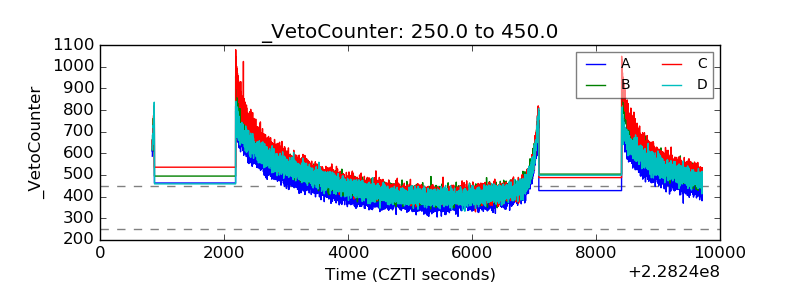 |