| Param | Original file | Final file |
|---|---|---|
| Filename | modeM0/AS1A02_055T01_9000001114_08078cztM0_level2.evt | modeM0/AS1A02_055T01_9000001114_08078cztM0_level2_quad_clean.evt |
| Size (bytes) | 469,607,040 | 100,039,680 |
| Size | 447.9 MB | 95.4 MB |
| Events in quadrant A | 3,210,498 | 637,497 |
| Events in quadrant B | 3,164,921 | 662,235 |
| Events in quadrant C | 4,321,615 | 655,775 |
| Events in quadrant D | 3,096,252 | 633,457 |
| Mode M0 | |||
|---|---|---|---|
| Quadrant | BADHDUFLAG | Total packets | Discarded packets |
| A | 0 | 13801 | 3 |
| B | 0 | 13600 | 2 |
| C | 0 | 17093 | 2 |
| D | 0 | 13615 | 2 |
| Mode M9 | |||
|---|---|---|---|
| Quadrant | BADHDUFLAG | Total packets | Discarded packets |
| A | 0 | 13 | 0 |
| B | 0 | 13 | 0 |
| C | 0 | 13 | 0 |
| D | 0 | 14 | 0 |
| Mode SS | |||
|---|---|---|---|
| Quadrant | BADHDUFLAG | Total packets | Discarded packets |
| A | 0 | 130 | 0 |
| B | 0 | 130 | 0 |
| C | 0 | 130 | 0 |
| D | 0 | 130 | 0 |
| Quadrant | Total seconds | Saturated seconds | Saturation percentage |
|---|---|---|---|
| A | 6308 | 78 | 1.236525% |
| B | 6308 | 94 | 1.490171% |
| C | 6308 | 314 | 4.977806% |
| D | 6308 | 100 | 1.585289% |
Noise dominated data is calculated using 1-second bins in cleaned event files. If a bin has >2000 counts, and if more than 50% of those come from <1% of pixels, then it is considered to be noise-dominated and hence unusable.
| Quadrant | # 1 sec bins | Bins with >0 counts | Bins with >2000 counts | High rate bins dominated by noise | Noise dominated (total time) | Noise dominated (detector-on time) | Marked lightcurve |
|---|---|---|---|---|---|---|---|
| A | 7428 | 6309 | 0 | 0 | 0.00% | 0.00% | 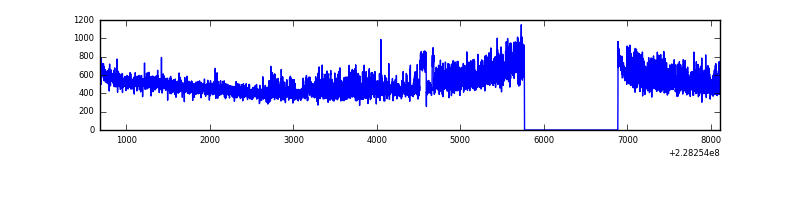 |
| B | 7428 | 6309 | 5 | 5 | 0.07% | 0.08% | 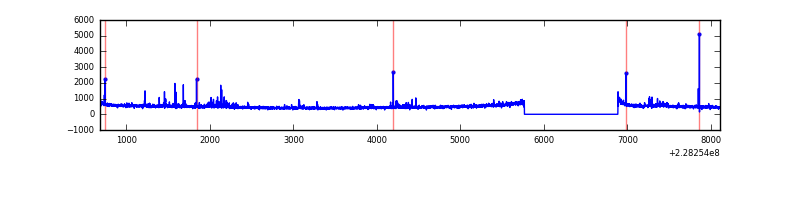 |
| C | 7428 | 6309 | 180 | 180 | 2.42% | 2.85% | 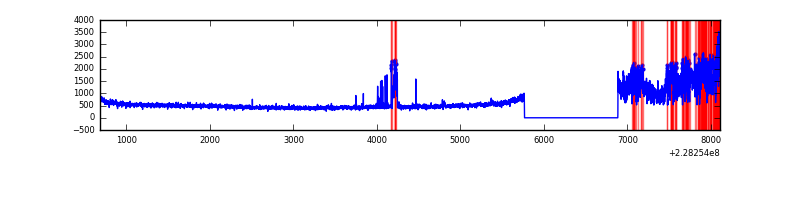 |
| D | 7428 | 6309 | 20 | 20 | 0.27% | 0.32% | 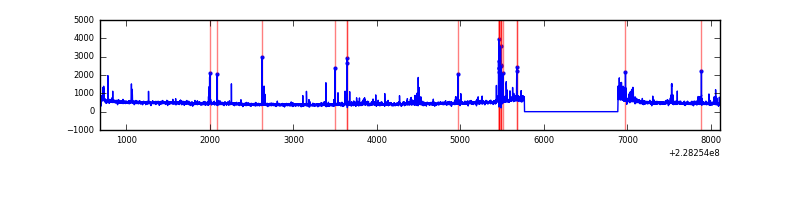 |
Top three noisy pixels from each quadrant. If the there are fewer than three noisy pixels in the level2.evt file, extra rows are filled as -1
| Pixel properties | Quadrant properties | ||||||
|---|---|---|---|---|---|---|---|
| Quadrant | DetID | PixID | Counts | Sigma | Mean | Median | Sigma |
| A | 0 | 128 | 268034 | 1724.44 | 764 | 749 | 155.0 |
| A | 0 | 226 | 7215 | 41.72 | 764 | 749 | 155.0 |
| A | 12 | 194 | 6892 | 39.63 | 764 | 749 | 155.0 |
| B | 4 | 81 | 58056 | 388.39 | 779 | 761 | 147.5 |
| B | 10 | 16 | 23967 | 157.31 | 779 | 761 | 147.5 |
| B | 11 | 51 | 22514 | 147.46 | 779 | 761 | 147.5 |
| C | 9 | 68 | 1298226 | 7453.81 | 759 | 764 | 174.1 |
| C | 1 | 16 | 58713 | 332.91 | 759 | 764 | 174.1 |
| C | 13 | 61 | 5815 | 29.02 | 759 | 764 | 174.1 |
| D | 7 | 71 | 95680 | 477.57 | 747 | 732 | 198.8 |
| D | 2 | 136 | 58251 | 289.31 | 747 | 732 | 198.8 |
| D | 2 | 14 | 46631 | 230.86 | 747 | 732 | 198.8 |
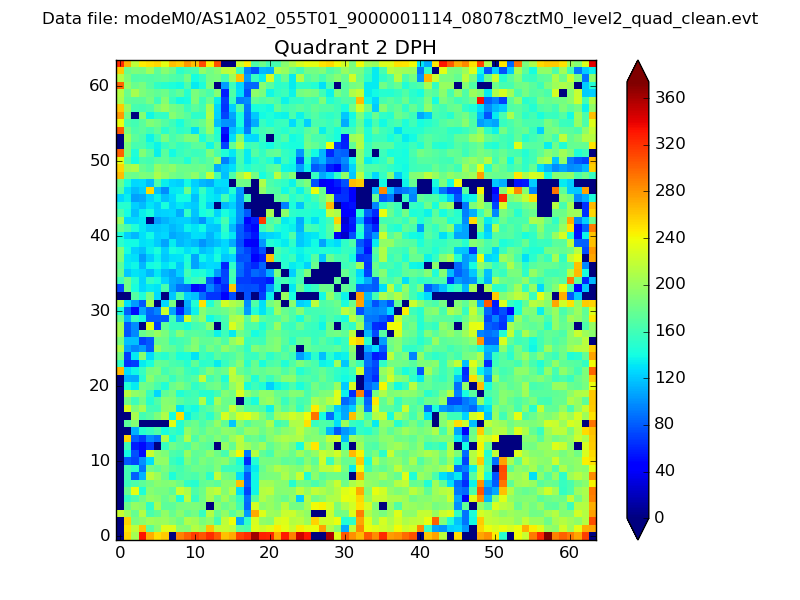
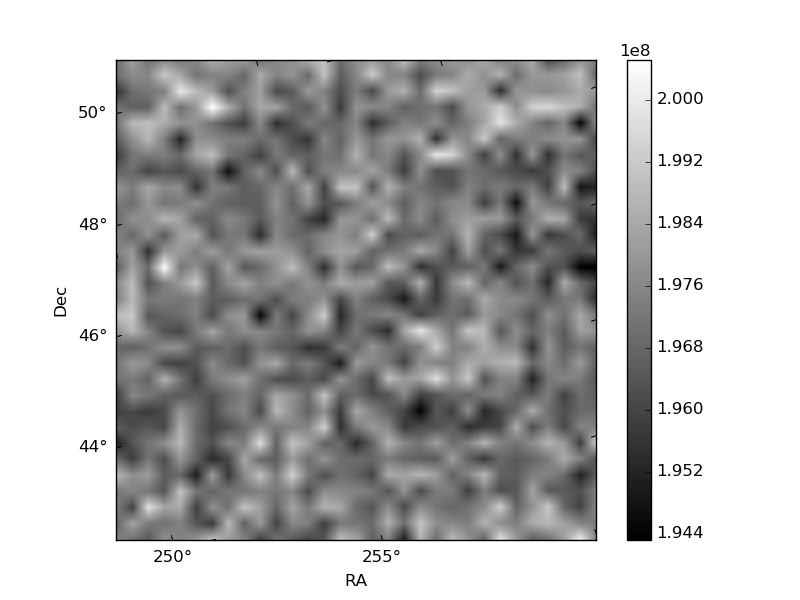
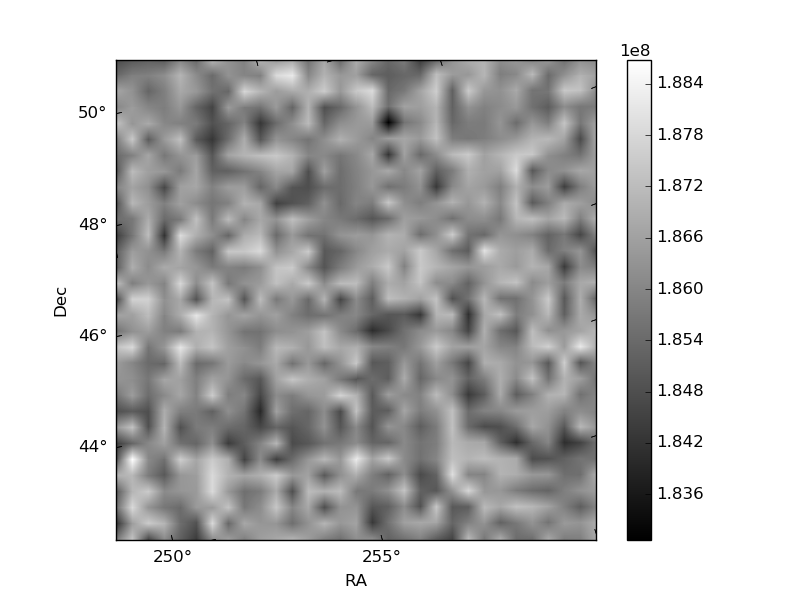
Histogram calculated using DETX and DETY for each event in the final _common_clean file
| Quadrant A | 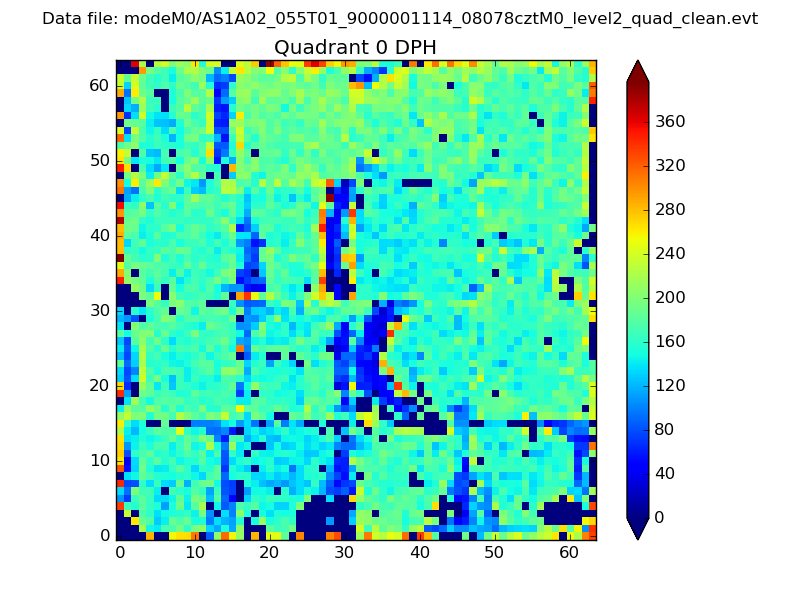 |
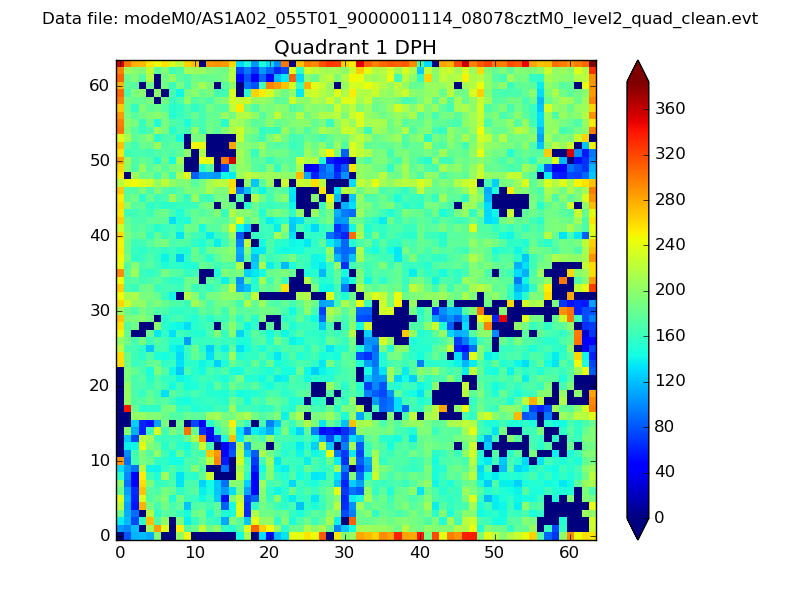 |
Quadrant B |
|---|---|---|---|
| Quadrant D | 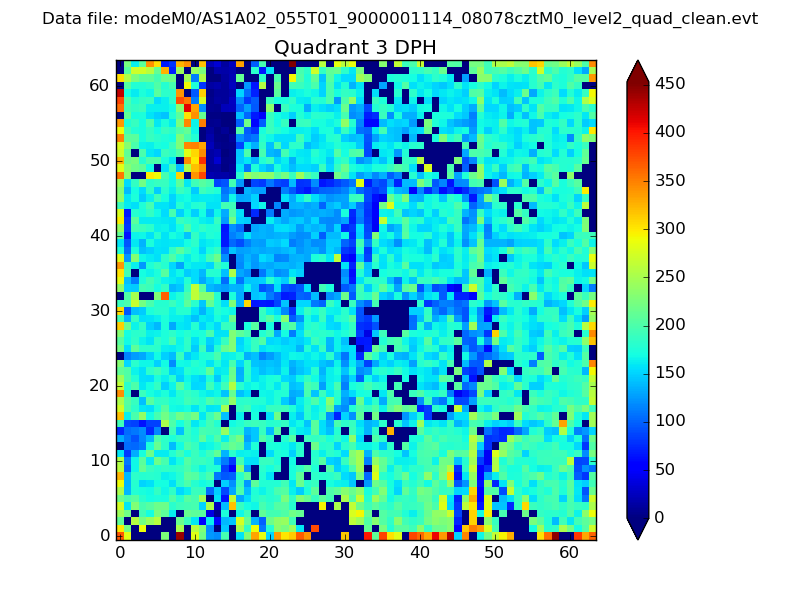 |
 |
Quadrant C |
| Plot type | Count rate plots | Images |
|---|---|---|
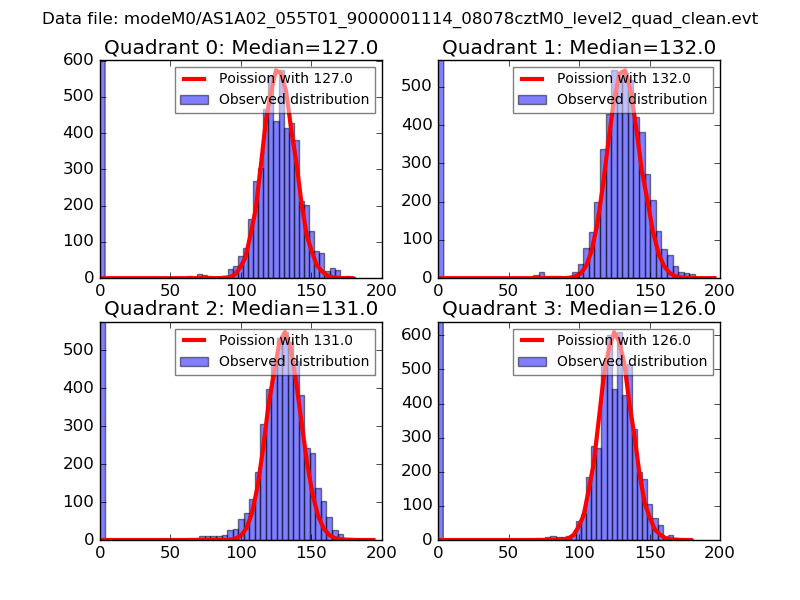
| Comparison with Poisson distribution Blue bars denote a histogram of data divided into 1 sec bins. Red curve is a Poisson curve with rate = median count rate of data. |
 |
 |
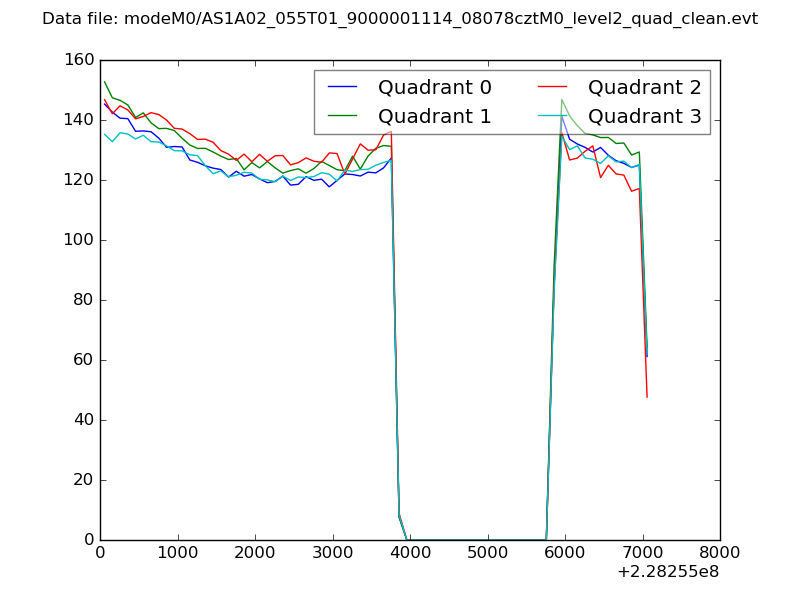
| Quadrant-wise count rates Data is divided into 100 sec bins |
 |
|
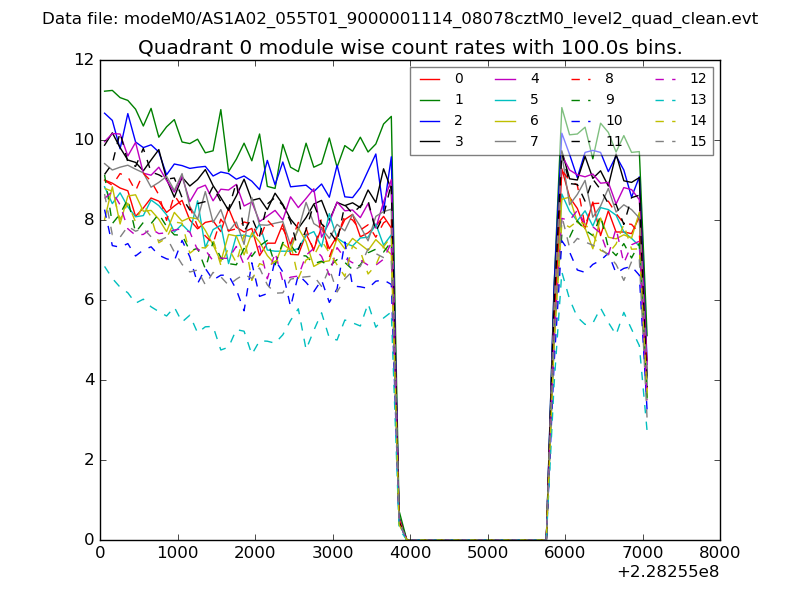
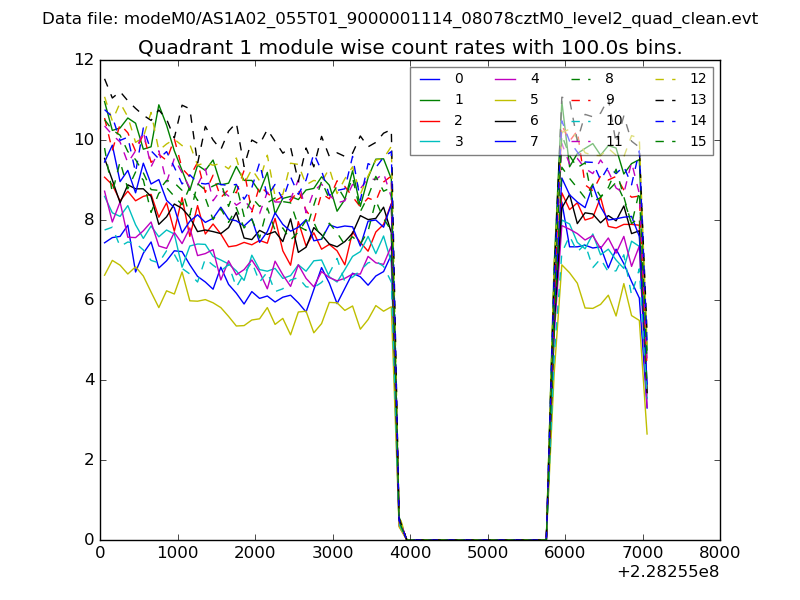
| Module-wise count rates for Quadrant A Data is divided into 100 sec bins |
 |
 |
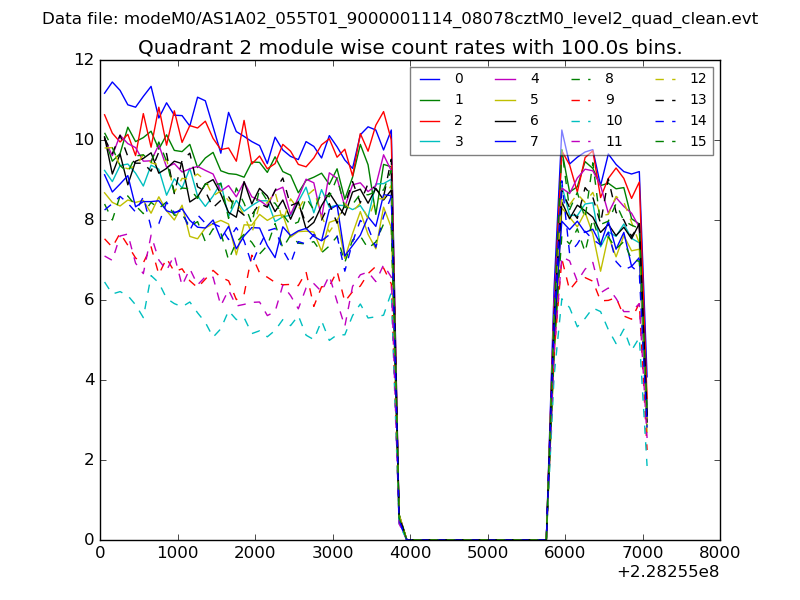
| Module-wise count rates for Quadrant B Data is divided into 100 sec bins |
 |
 |
| Module-wise count rates for Quadrant C Data is divided into 100 sec bins |
 |
 |
| Module-wise count rates for Quadrant D Data is divided into 100 sec bins |
 |
 |
| Parameter | Plot |
|---|---|
| CZT HV Monitor | 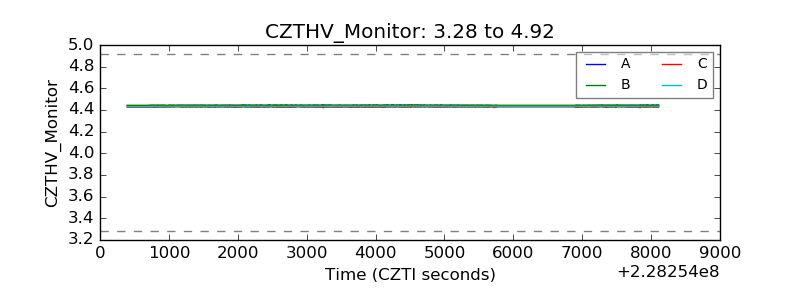 |
| D_VDD | 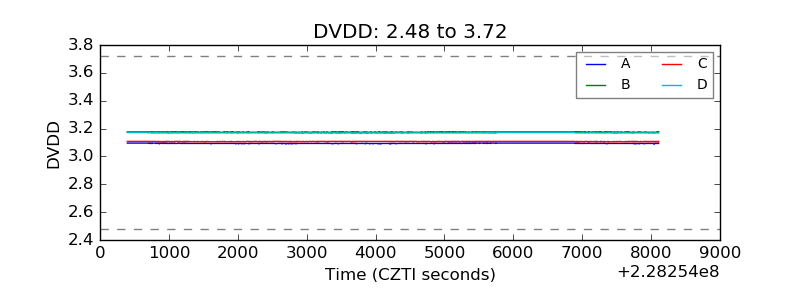 |
| Temperature 1 | 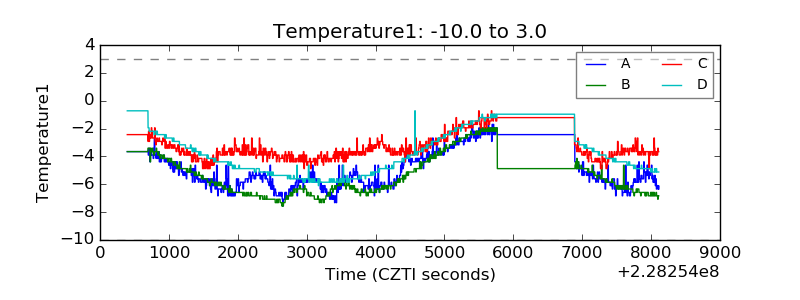 |
| Veto HV Monitor | 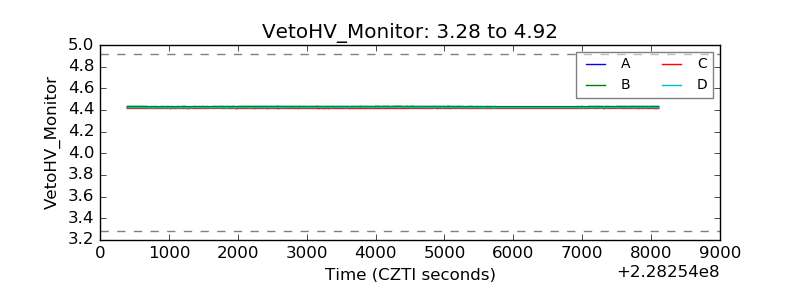 |
| Veto LLD | 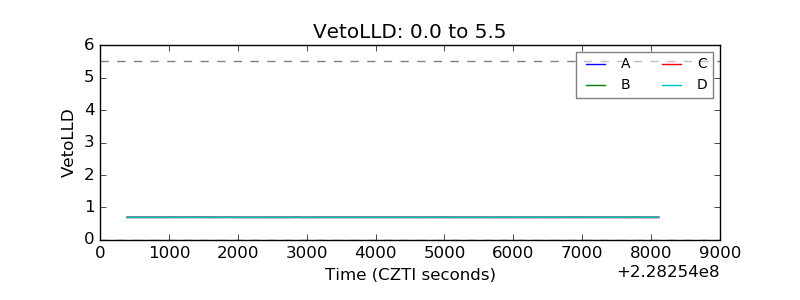 |
| Alpha Counter | 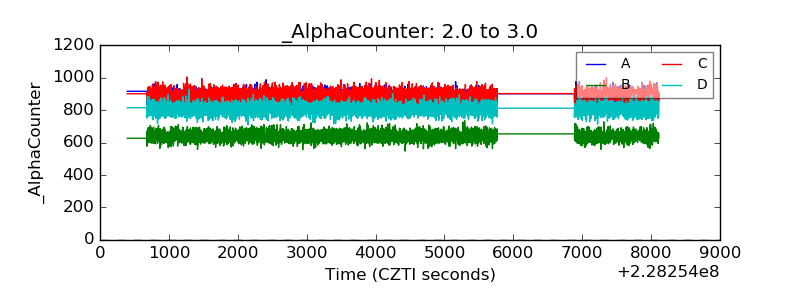 |
| _CPM_Rate | 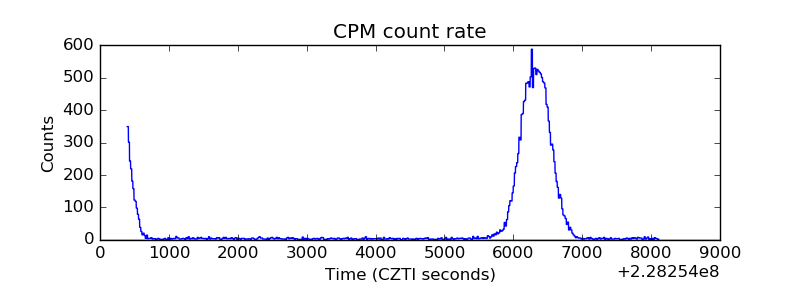 |
| CZT Counter | 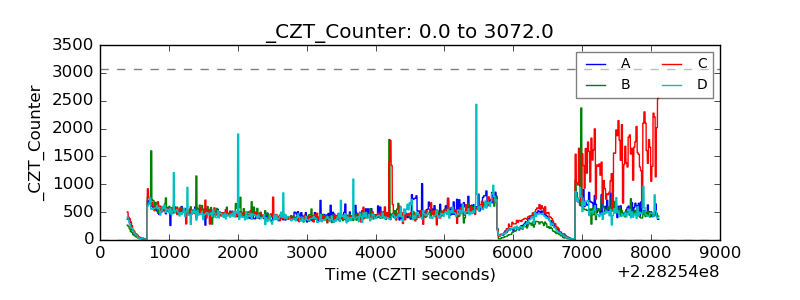 |
| +2.5 Volts monitor |  |
| +5 Volts monitor |  |
| _ROLL_ROT | 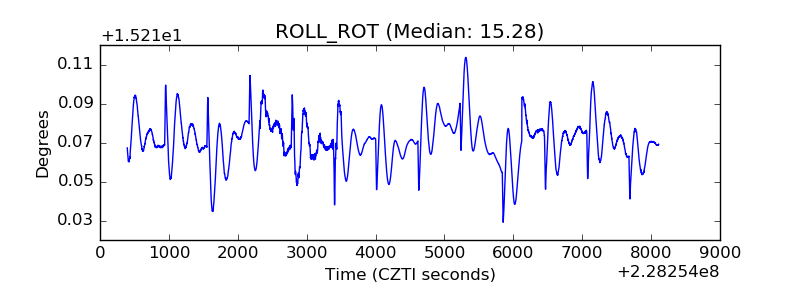 |
| _Roll_DEC | 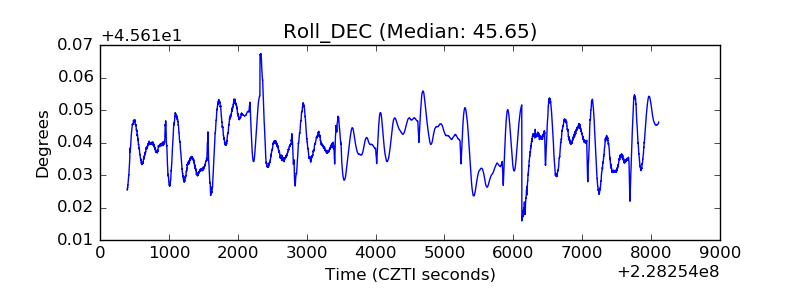 |
| _Roll_RA | 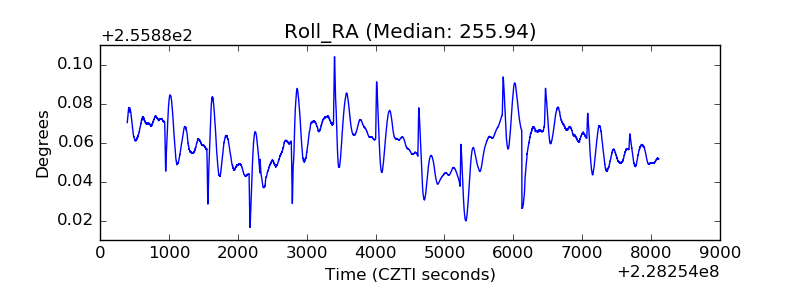 |
| Veto Counter |  |