| Param | Original file | Final file |
|---|---|---|
| Filename | modeM0/AS1A02_055T01_9000001114_08079cztM0_level2.evt | modeM0/AS1A02_055T01_9000001114_08079cztM0_level2_quad_clean.evt |
| Size (bytes) | 679,613,760 | 98,496,000 |
| Size | 648.1 MB | 93.9 MB |
| Events in quadrant A | 3,770,012 | 618,330 |
| Events in quadrant B | 3,712,832 | 643,307 |
| Events in quadrant C | 8,579,009 | 585,643 |
| Events in quadrant D | 4,013,312 | 613,749 |
| Mode M0 | |||
|---|---|---|---|
| Quadrant | BADHDUFLAG | Total packets | Discarded packets |
| A | 0 | 16197 | 3 |
| B | 0 | 16100 | 2 |
| C | 0 | 30391 | 2 |
| D | 0 | 17297 | 2 |
| Mode M9 | |||
|---|---|---|---|
| Quadrant | BADHDUFLAG | Total packets | Discarded packets |
| A | 0 | 19 | 0 |
| B | 0 | 19 | 0 |
| C | 0 | 19 | 0 |
| D | 0 | 19 | 0 |
| Mode SS | |||
|---|---|---|---|
| Quadrant | BADHDUFLAG | Total packets | Discarded packets |
| A | 0 | 154 | 0 |
| B | 0 | 154 | 0 |
| C | 0 | 154 | 0 |
| D | 0 | 154 | 0 |
| Quadrant | Total seconds | Saturated seconds | Saturation percentage |
|---|---|---|---|
| A | 7489 | 97 | 1.295233% |
| B | 7489 | 132 | 1.762585% |
| C | 7489 | 1380 | 18.427026% |
| D | 7489 | 165 | 2.203231% |
Noise dominated data is calculated using 1-second bins in cleaned event files. If a bin has >2000 counts, and if more than 50% of those come from <1% of pixels, then it is considered to be noise-dominated and hence unusable.
| Quadrant | # 1 sec bins | Bins with >0 counts | Bins with >2000 counts | High rate bins dominated by noise | Noise dominated (total time) | Noise dominated (detector-on time) | Marked lightcurve |
|---|---|---|---|---|---|---|---|
| A | 9404 | 7491 | 1 | 1 | 0.01% | 0.01% | 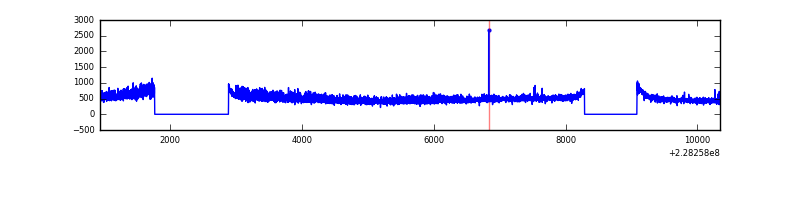 |
| B | 9404 | 7491 | 4 | 4 | 0.04% | 0.05% | 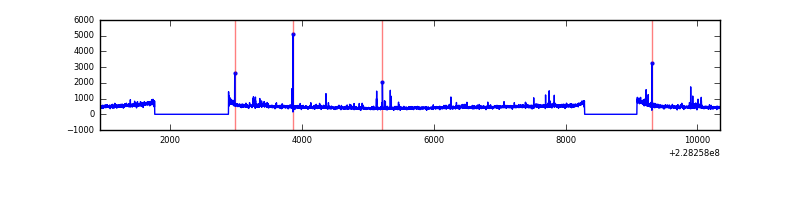 |
| C | 9404 | 7491 | 1391 | 1391 | 14.79% | 18.57% | 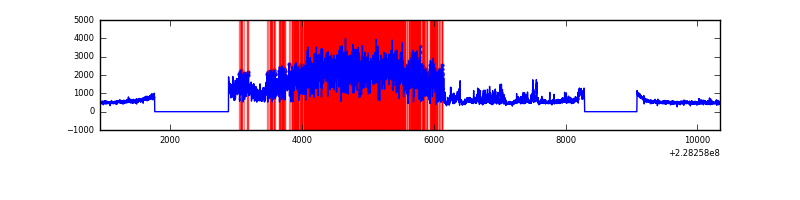 |
| D | 9404 | 7491 | 35 | 35 | 0.37% | 0.47% | 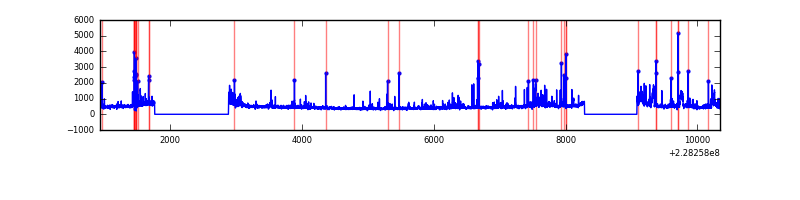 |
Top three noisy pixels from each quadrant. If the there are fewer than three noisy pixels in the level2.evt file, extra rows are filled as -1
| Pixel properties | Quadrant properties | ||||||
|---|---|---|---|---|---|---|---|
| Quadrant | DetID | PixID | Counts | Sigma | Mean | Median | Sigma |
| A | 0 | 128 | 271480 | 1456.04 | 905 | 885 | 185.8 |
| A | 0 | 226 | 8503 | 40.99 | 905 | 885 | 185.8 |
| A | 12 | 194 | 8116 | 38.91 | 905 | 885 | 185.8 |
| B | 4 | 81 | 36935 | 203.07 | 921 | 898 | 177.5 |
| B | 11 | 51 | 28330 | 154.58 | 921 | 898 | 177.5 |
| B | 0 | 214 | 27086 | 147.57 | 921 | 898 | 177.5 |
| C | 9 | 68 | 5101428 | 25656.44 | 868 | 870 | 198.8 |
| C | 1 | 16 | 88284 | 439.7 | 868 | 870 | 198.8 |
| C | 13 | 61 | 6444 | 28.04 | 868 | 870 | 198.8 |
| D | 1 | 52 | 383931 | 1641.59 | 879 | 858 | 233.4 |
| D | 7 | 71 | 120111 | 511.04 | 879 | 858 | 233.4 |
| D | 12 | 233 | 67552 | 285.8 | 879 | 858 | 233.4 |
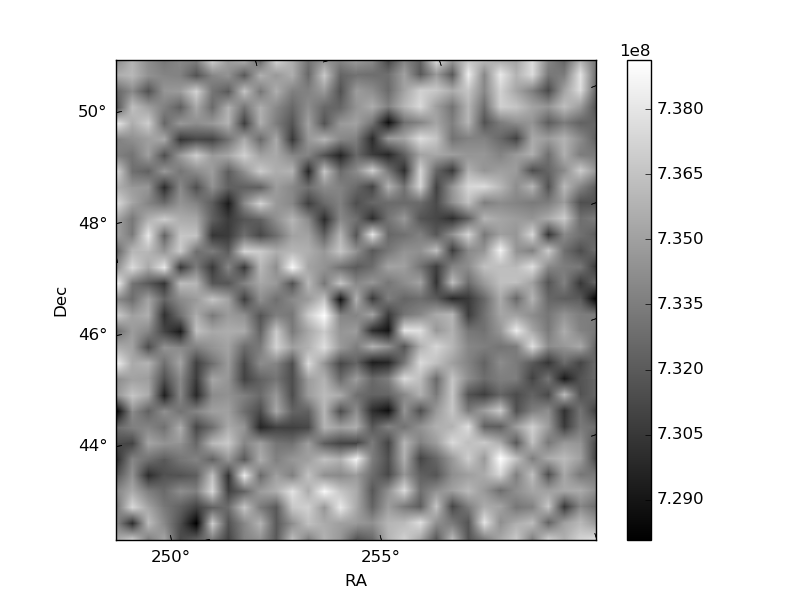
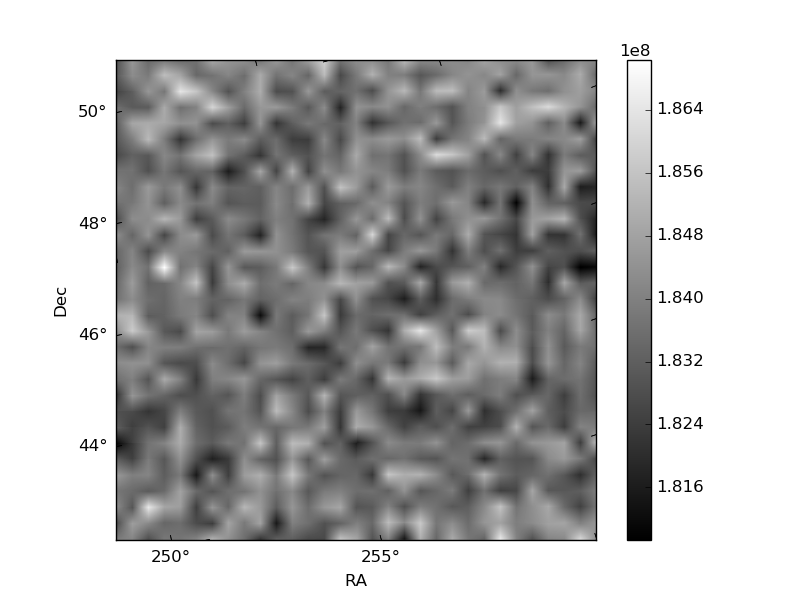
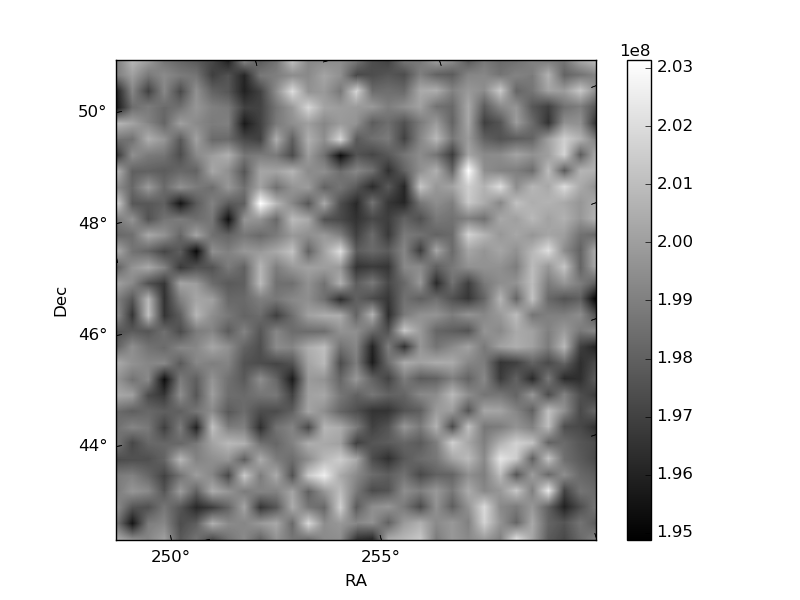
Histogram calculated using DETX and DETY for each event in the final _common_clean file
| Quadrant A | 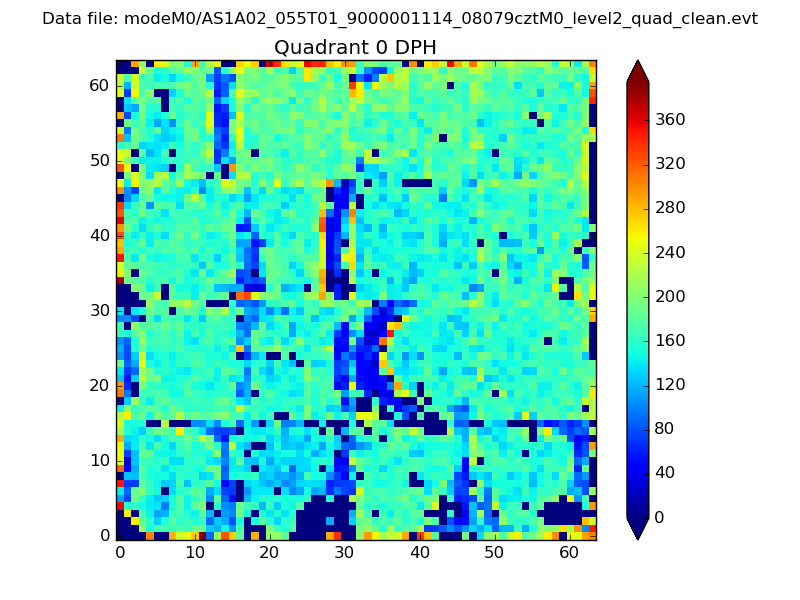 |
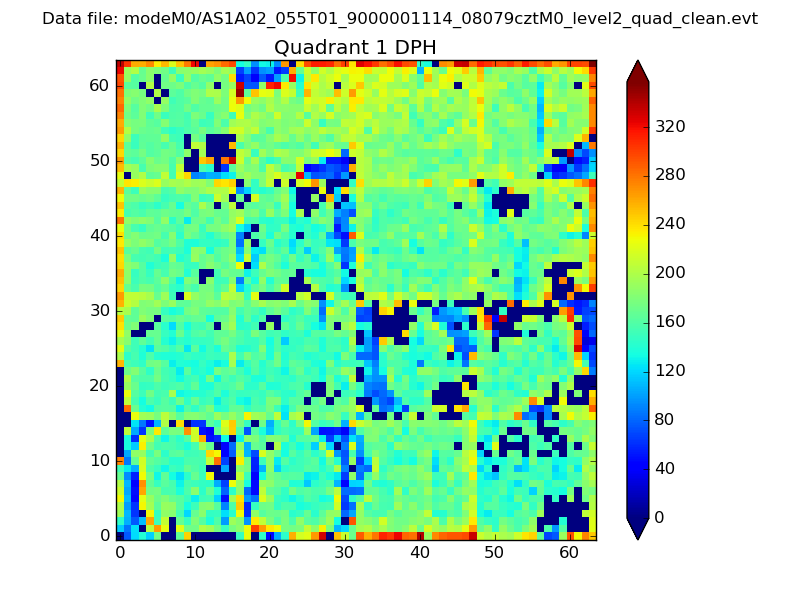 |
Quadrant B |
|---|---|---|---|
| Quadrant D | 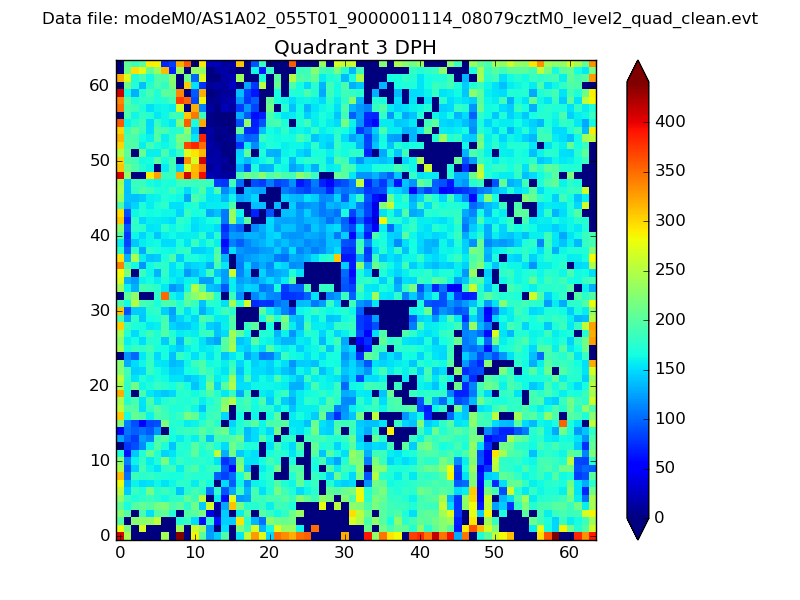 |
 |
Quadrant C |
| Plot type | Count rate plots | Images |
|---|---|---|
| Comparison with Poisson distribution Blue bars denote a histogram of data divided into 1 sec bins. Red curve is a Poisson curve with rate = median count rate of data. |
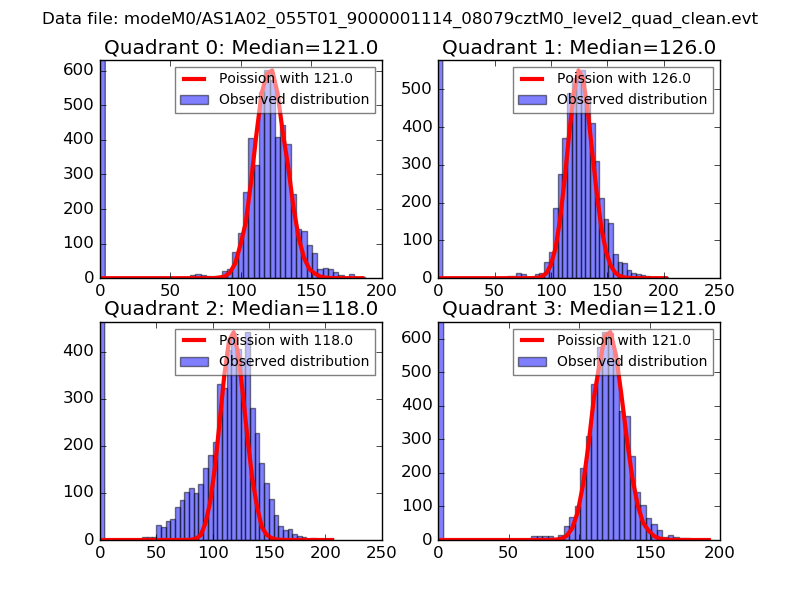 |
 |
| Quadrant-wise count rates Data is divided into 100 sec bins |
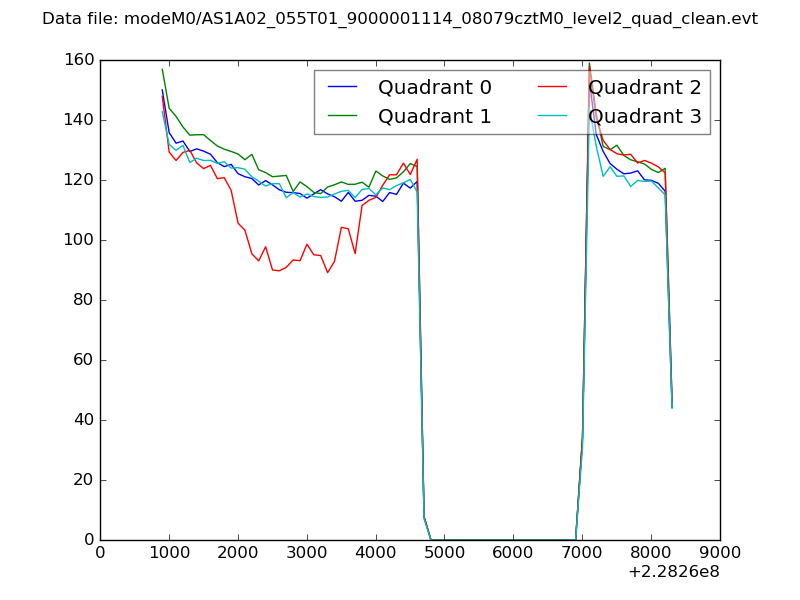 |
|
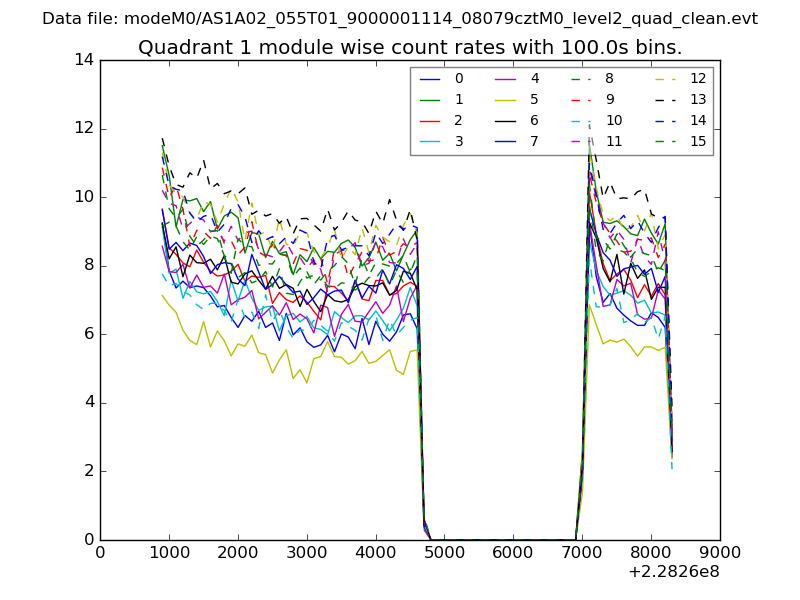
| Module-wise count rates for Quadrant A Data is divided into 100 sec bins |
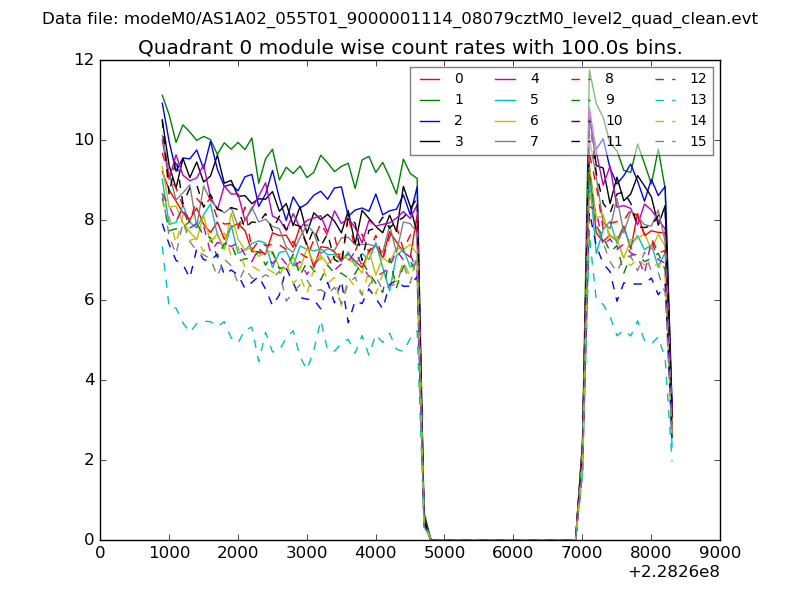 |
 |
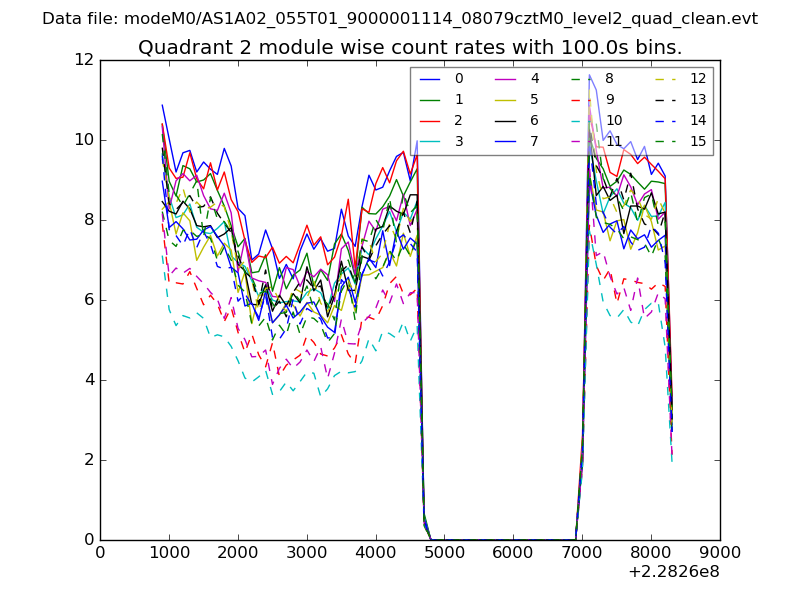
| Module-wise count rates for Quadrant B Data is divided into 100 sec bins |
 |
 |
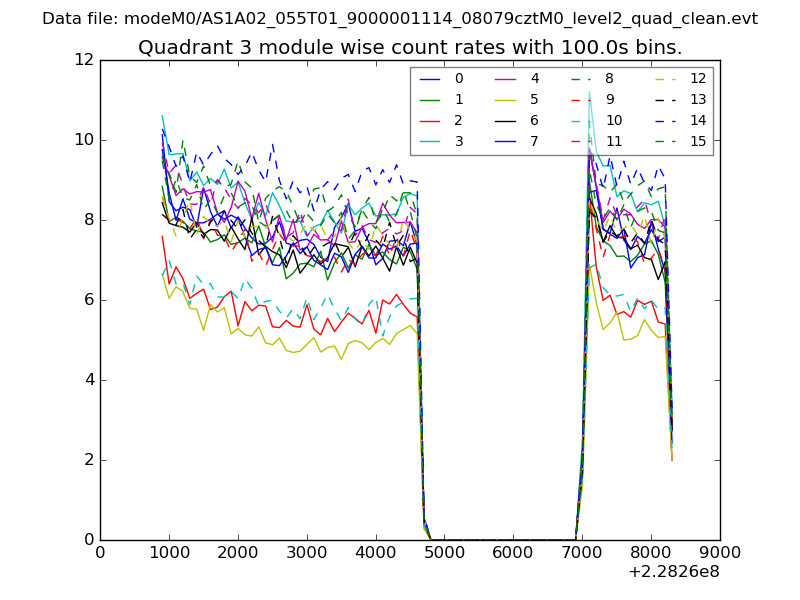
| Module-wise count rates for Quadrant C Data is divided into 100 sec bins |
 |
 |
| Module-wise count rates for Quadrant D Data is divided into 100 sec bins |
 |
 |
| Parameter | Plot |
|---|---|
| CZT HV Monitor | 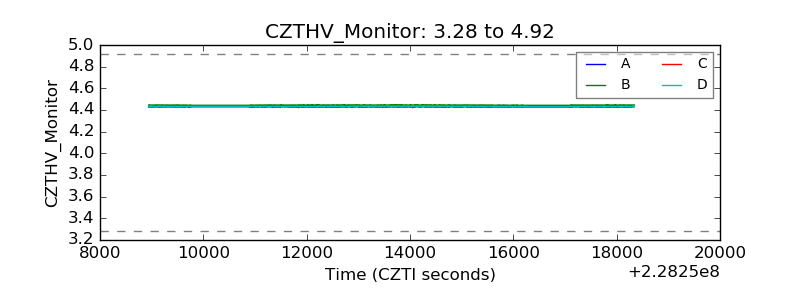 |
| D_VDD |  |
| Temperature 1 | 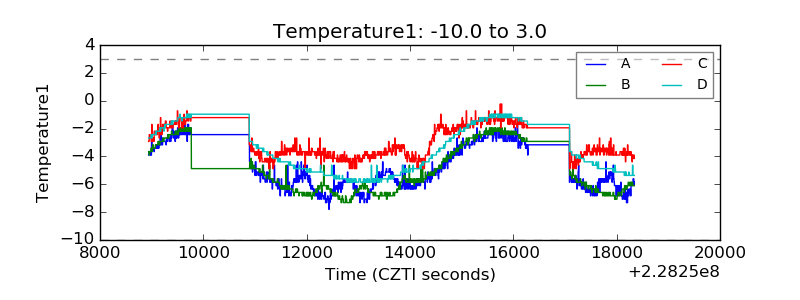 |
| Veto HV Monitor | 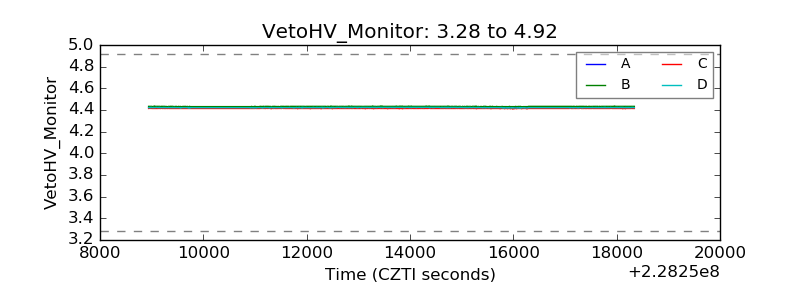 |
| Veto LLD | 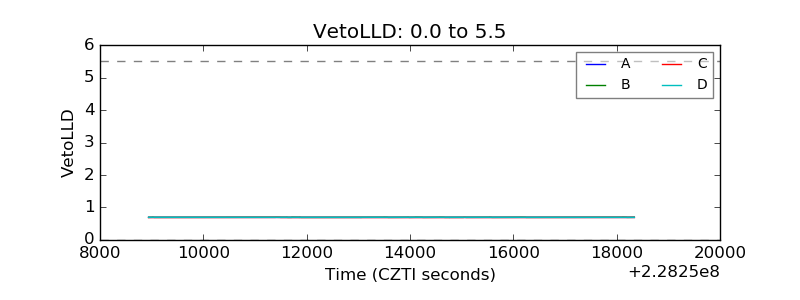 |
| Alpha Counter | 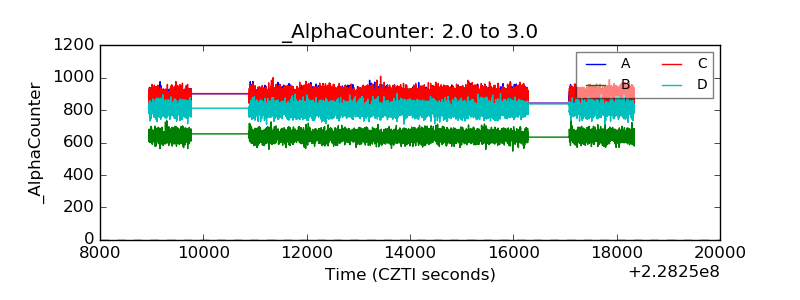 |
| _CPM_Rate | 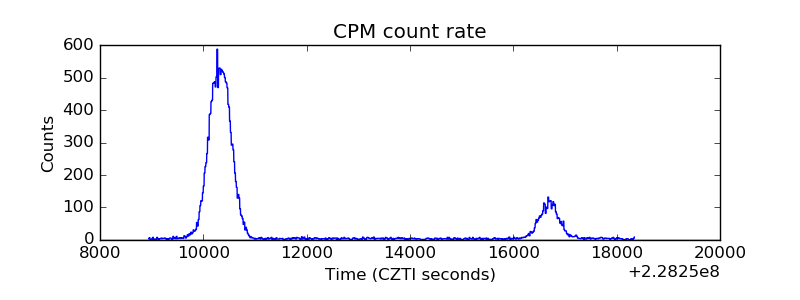 |
| CZT Counter | 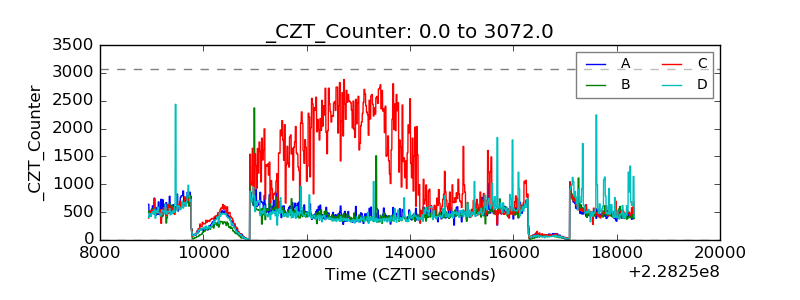 |
| +2.5 Volts monitor |  |
| +5 Volts monitor |  |
| _ROLL_ROT | 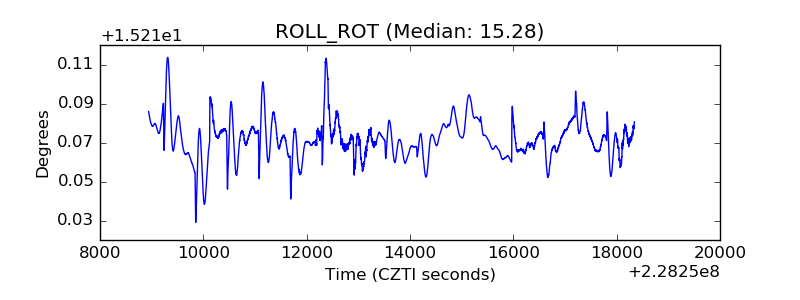 |
| _Roll_DEC | 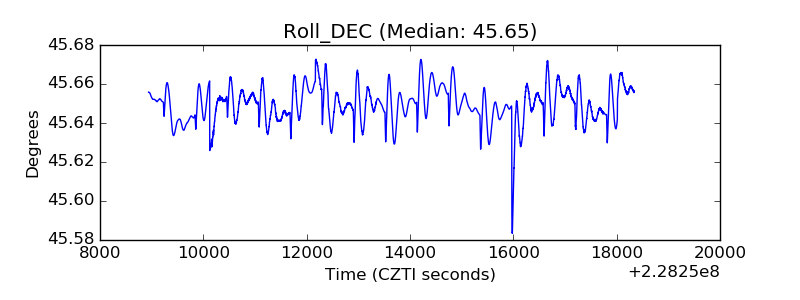 |
| _Roll_RA | 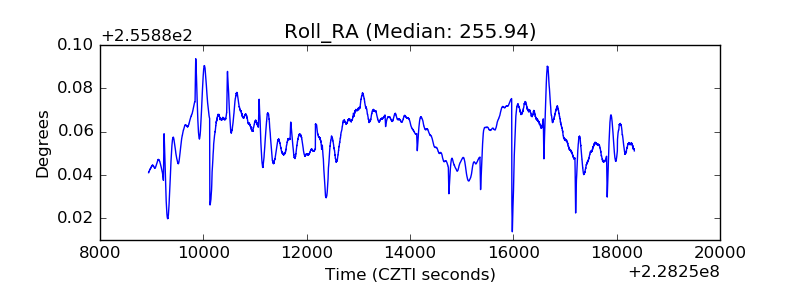 |
| Veto Counter | 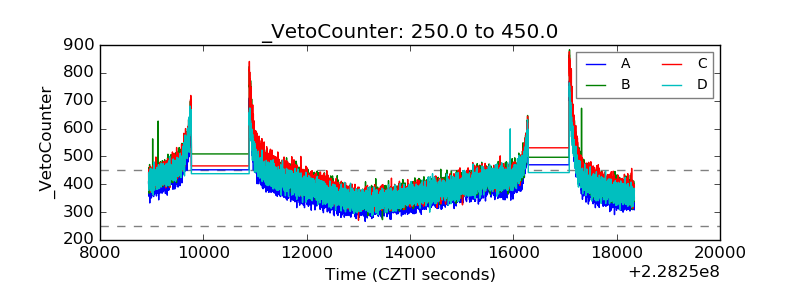 |