| Param | Original file | Final file |
|---|---|---|
| Filename | modeM0/AS1A02_055T01_9000001114_08080cztM0_level2.evt | modeM0/AS1A02_055T01_9000001114_08080cztM0_level2_quad_clean.evt |
| Size (bytes) | 544,412,160 | 102,300,480 |
| Size | 519.2 MB | 97.6 MB |
| Events in quadrant A | 3,368,066 | 638,285 |
| Events in quadrant B | 3,534,866 | 661,419 |
| Events in quadrant C | 4,937,607 | 659,839 |
| Events in quadrant D | 4,148,054 | 626,572 |
| Mode M0 | |||
|---|---|---|---|
| Quadrant | BADHDUFLAG | Total packets | Discarded packets |
| A | 0 | 15277 | 4 |
| B | 0 | 15616 | 2 |
| C | 0 | 19789 | 2 |
| D | 0 | 17649 | 2 |
| Mode M9 | |||
|---|---|---|---|
| Quadrant | BADHDUFLAG | Total packets | Discarded packets |
| A | 0 | 9 | 0 |
| B | 0 | 9 | 0 |
| C | 0 | 9 | 0 |
| D | 0 | 9 | 0 |
| Mode SS | |||
|---|---|---|---|
| Quadrant | BADHDUFLAG | Total packets | Discarded packets |
| A | 0 | 150 | 0 |
| B | 0 | 150 | 0 |
| C | 0 | 150 | 0 |
| D | 0 | 150 | 0 |
| Quadrant | Total seconds | Saturated seconds | Saturation percentage |
|---|---|---|---|
| A | 7354 | 59 | 0.802284% |
| B | 7354 | 94 | 1.278216% |
| C | 7354 | 90 | 1.223824% |
| D | 7354 | 168 | 2.284471% |
Noise dominated data is calculated using 1-second bins in cleaned event files. If a bin has >2000 counts, and if more than 50% of those come from <1% of pixels, then it is considered to be noise-dominated and hence unusable.
| Quadrant | # 1 sec bins | Bins with >0 counts | Bins with >2000 counts | High rate bins dominated by noise | Noise dominated (total time) | Noise dominated (detector-on time) | Marked lightcurve |
|---|---|---|---|---|---|---|---|
| A | 7690 | 7357 | 1 | 1 | 0.01% | 0.01% | 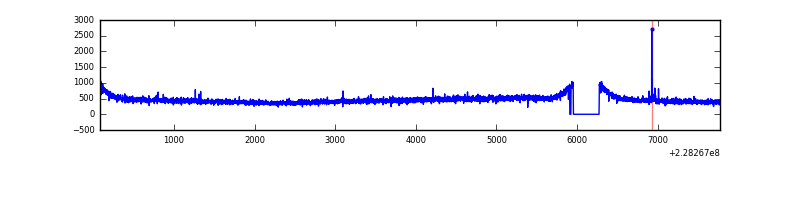 |
| B | 7690 | 7357 | 3 | 3 | 0.04% | 0.04% | 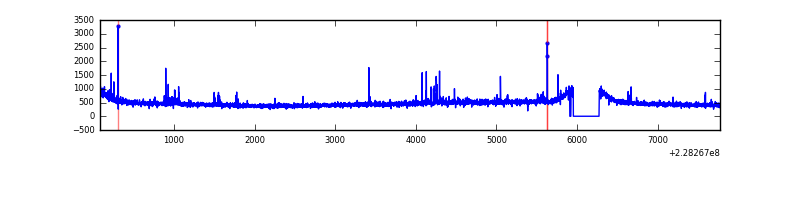 |
| C | 7690 | 7357 | 31 | 31 | 0.40% | 0.42% | 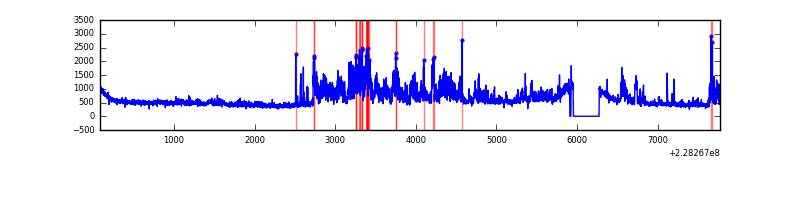 |
| D | 7690 | 7357 | 91 | 91 | 1.18% | 1.24% | 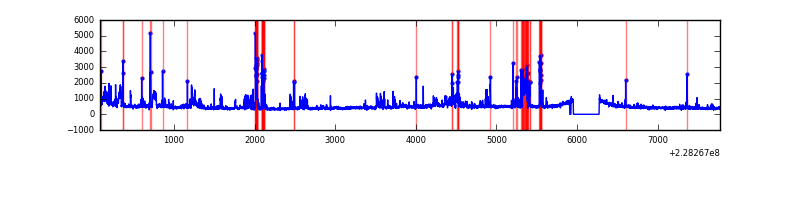 |
Top three noisy pixels from each quadrant. If the there are fewer than three noisy pixels in the level2.evt file, extra rows are filled as -1
| Pixel properties | Quadrant properties | ||||||
|---|---|---|---|---|---|---|---|
| Quadrant | DetID | PixID | Counts | Sigma | Mean | Median | Sigma |
| A | 13 | 248 | 16661 | 88.77 | 867 | 847 | 178.1 |
| A | 13 | 170 | 9530 | 48.74 | 867 | 847 | 178.1 |
| A | 0 | 226 | 8120 | 40.83 | 867 | 847 | 178.1 |
| B | 10 | 16 | 36220 | 207.11 | 883 | 860 | 170.7 |
| B | 11 | 51 | 28902 | 164.24 | 883 | 860 | 170.7 |
| B | 12 | 111 | 18420 | 102.85 | 883 | 860 | 170.7 |
| C | 9 | 68 | 1511519 | 7508.29 | 860 | 862 | 201.2 |
| C | 1 | 16 | 70893 | 348.07 | 860 | 862 | 201.2 |
| C | 13 | 61 | 6360 | 27.33 | 860 | 862 | 201.2 |
| D | 1 | 52 | 637219 | 3079.78 | 845 | 818 | 206.6 |
| D | 13 | 105 | 152927 | 736.11 | 845 | 818 | 206.6 |
| D | 7 | 71 | 105343 | 505.83 | 845 | 818 | 206.6 |
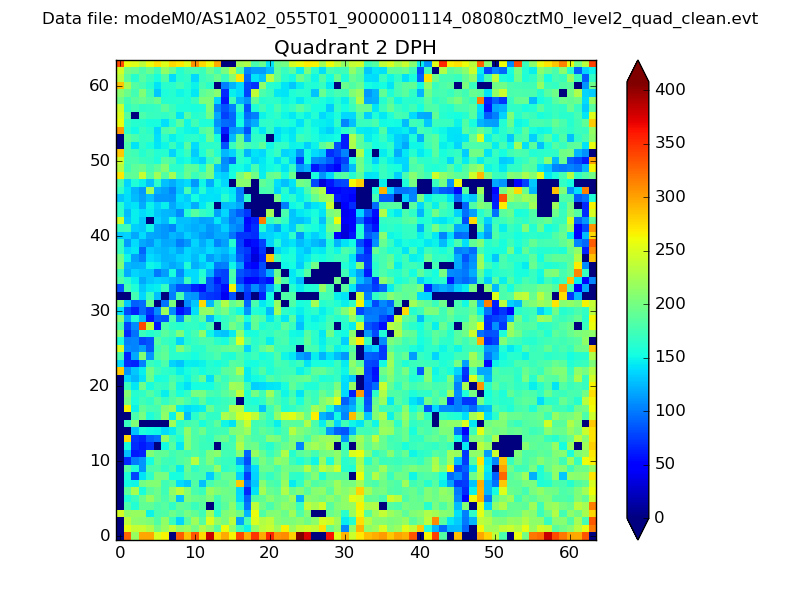
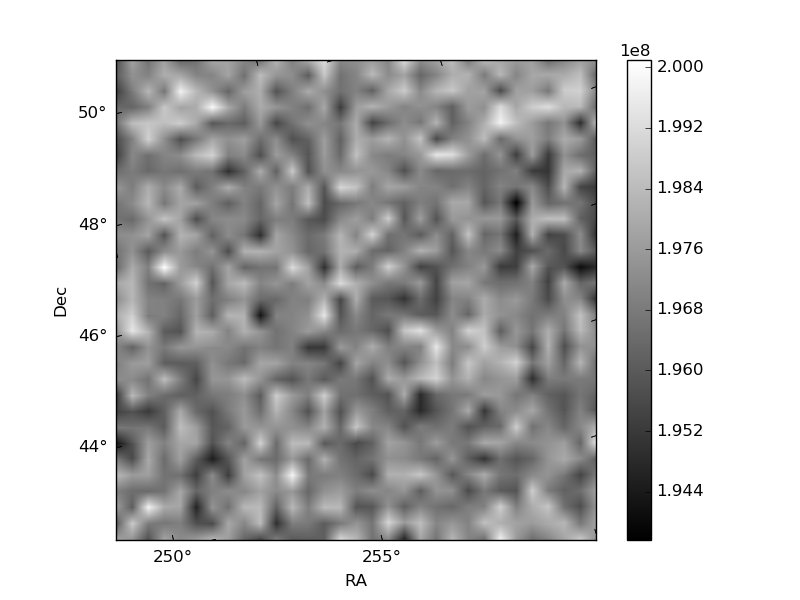
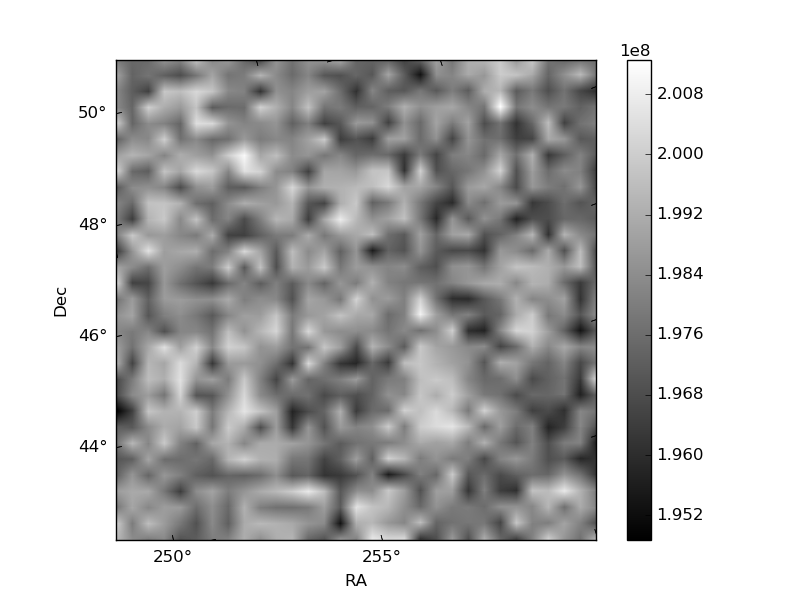
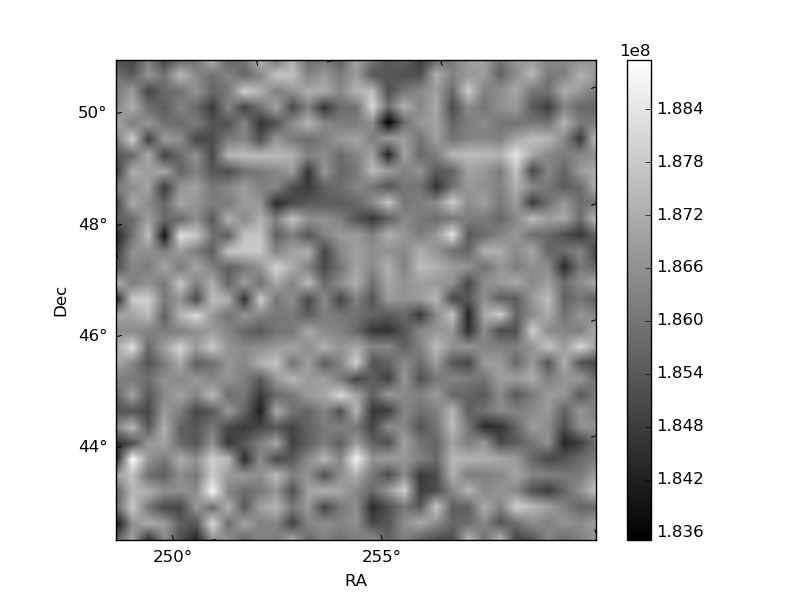
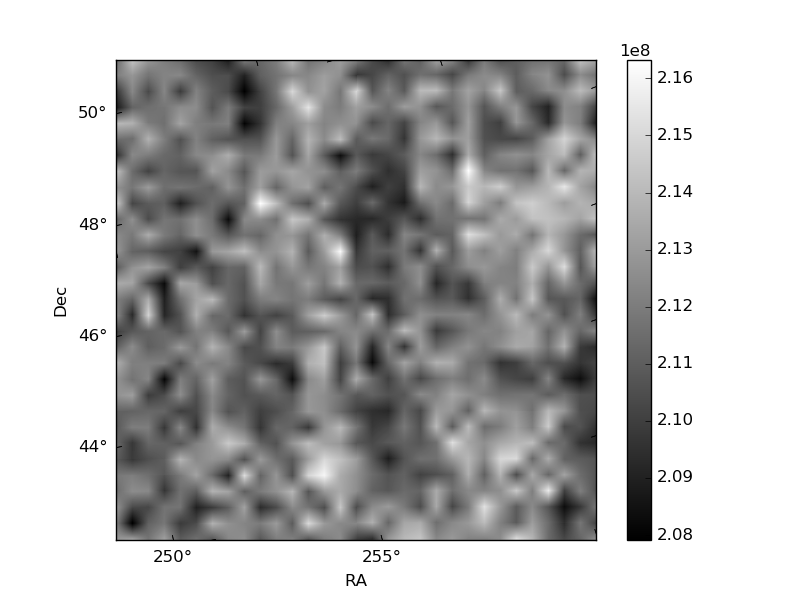
Histogram calculated using DETX and DETY for each event in the final _common_clean file
| Quadrant A |  |
 |
Quadrant B |
|---|---|---|---|
| Quadrant D | 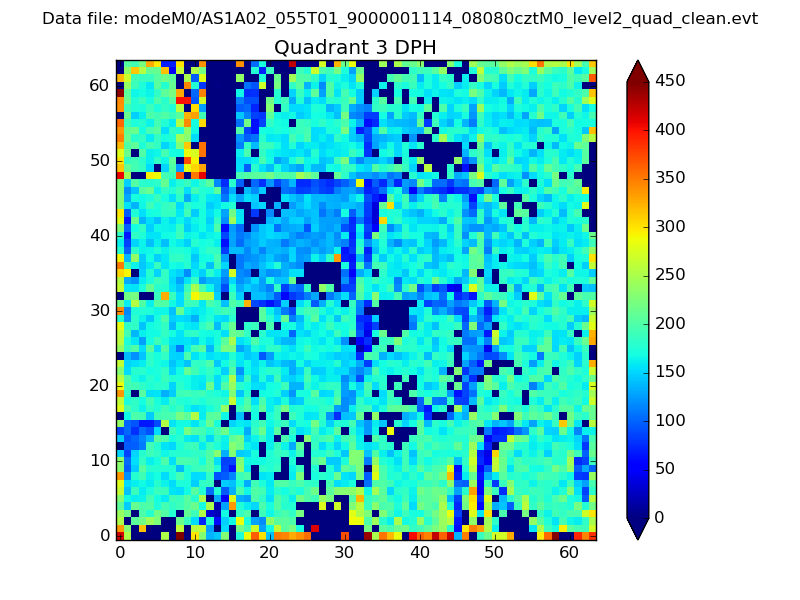 |
 |
Quadrant C |
| Plot type | Count rate plots | Images |
|---|---|---|
| Comparison with Poisson distribution Blue bars denote a histogram of data divided into 1 sec bins. Red curve is a Poisson curve with rate = median count rate of data. |
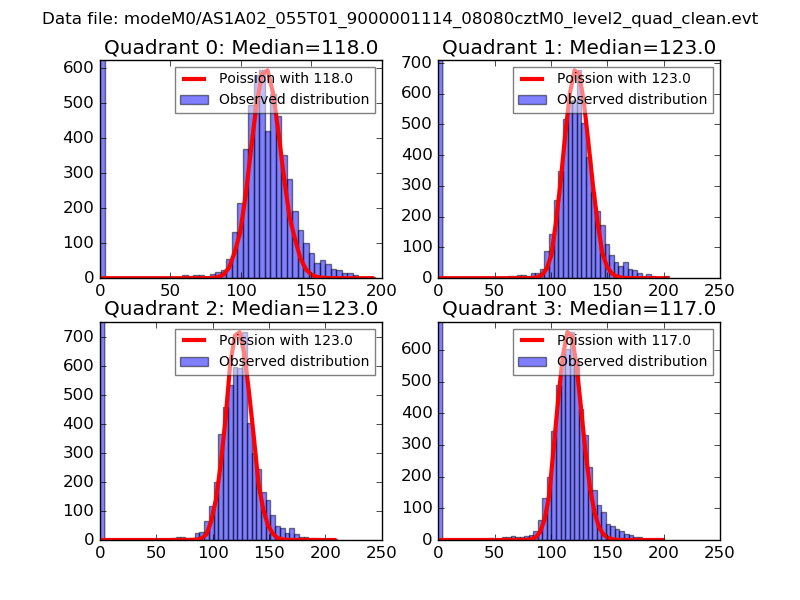 |
 |
| Quadrant-wise count rates Data is divided into 100 sec bins |
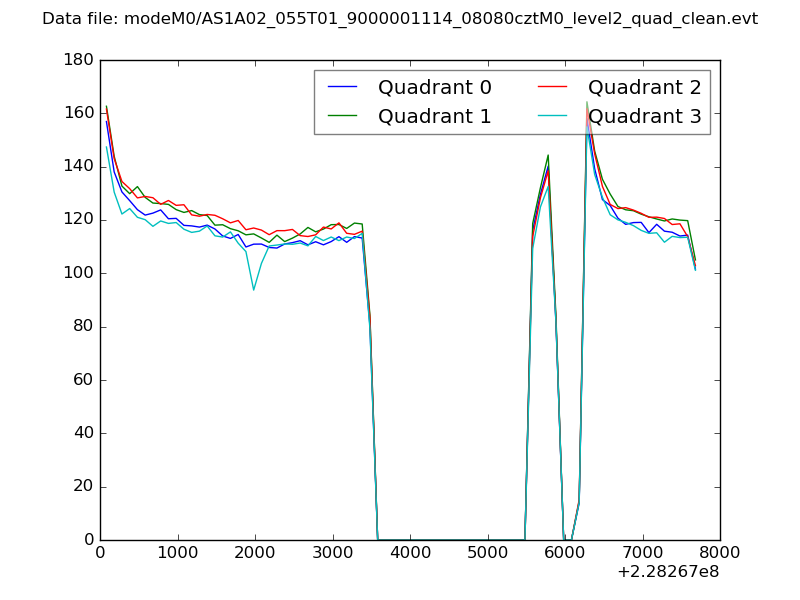 |
|
| Module-wise count rates for Quadrant A Data is divided into 100 sec bins |
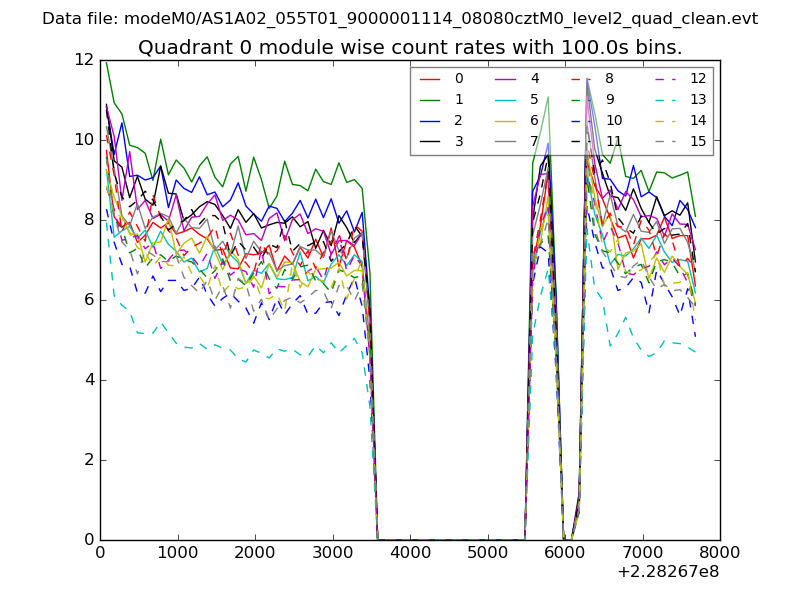 |
 |
| Module-wise count rates for Quadrant B Data is divided into 100 sec bins |
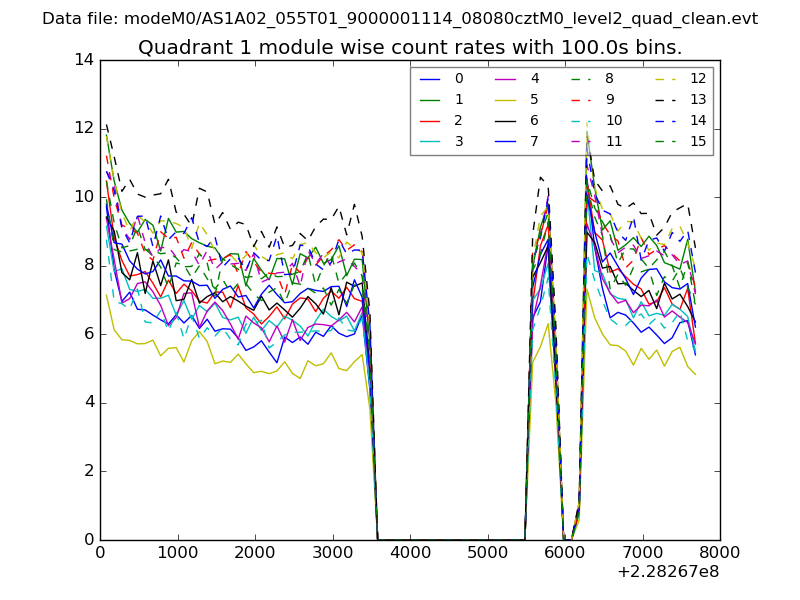 |
 |
| Module-wise count rates for Quadrant C Data is divided into 100 sec bins |
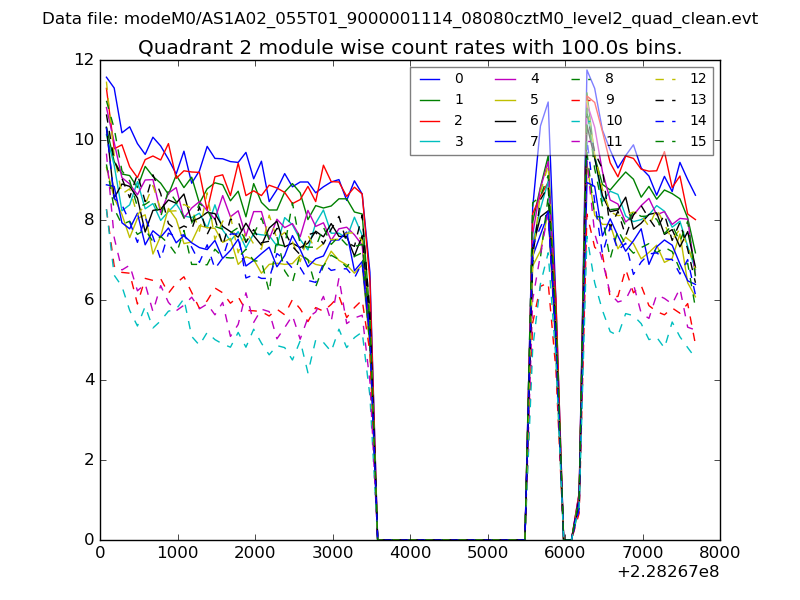 |
 |
| Module-wise count rates for Quadrant D Data is divided into 100 sec bins |
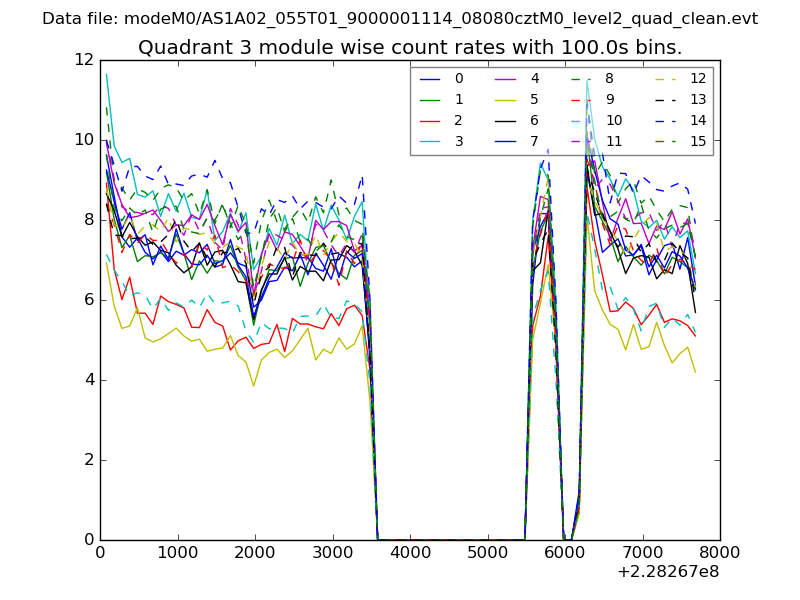 |
 |
| Parameter | Plot |
|---|---|
| CZT HV Monitor | 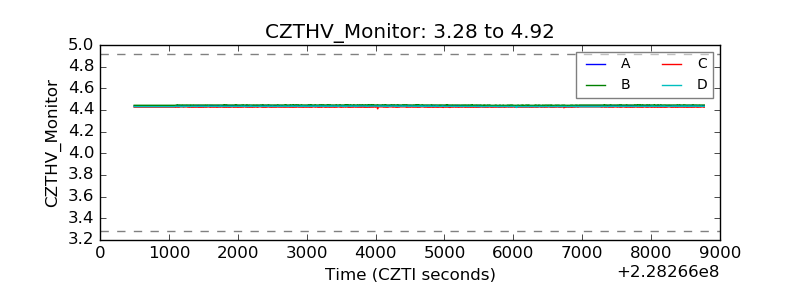 |
| D_VDD | 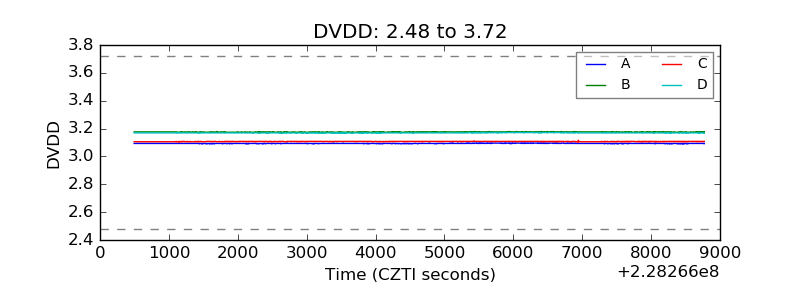 |
| Temperature 1 | 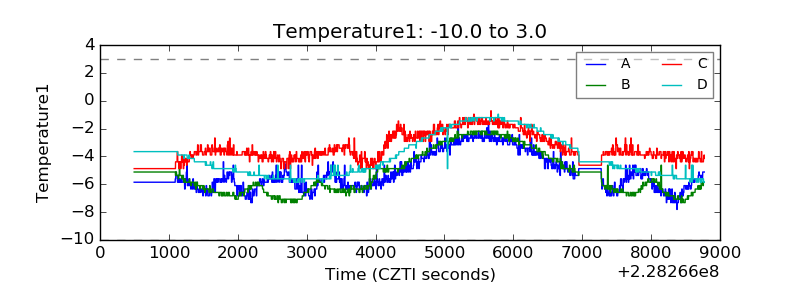 |
| Veto HV Monitor | 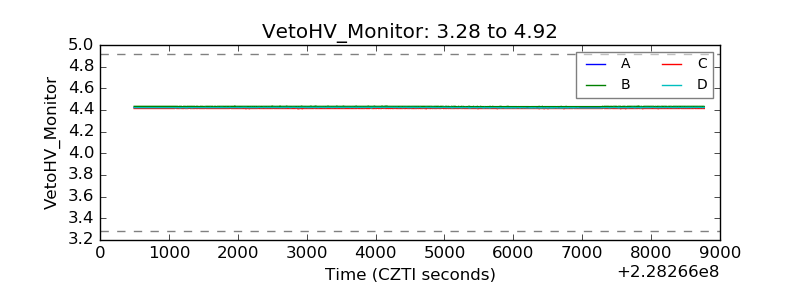 |
| Veto LLD | 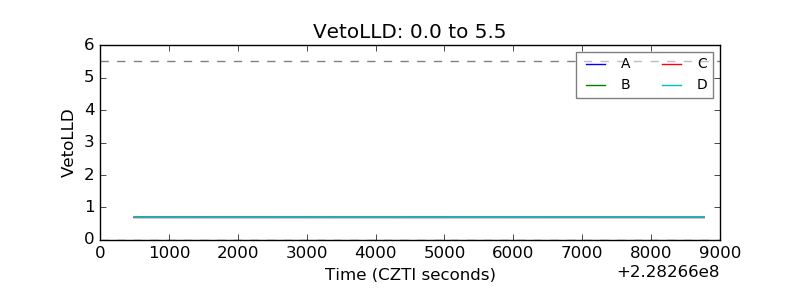 |
| Alpha Counter | 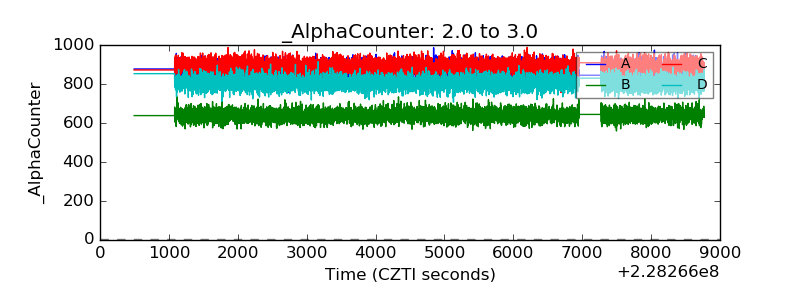 |
| _CPM_Rate | 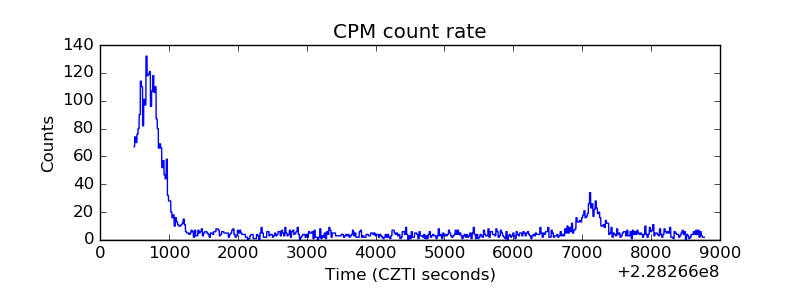 |
| CZT Counter | 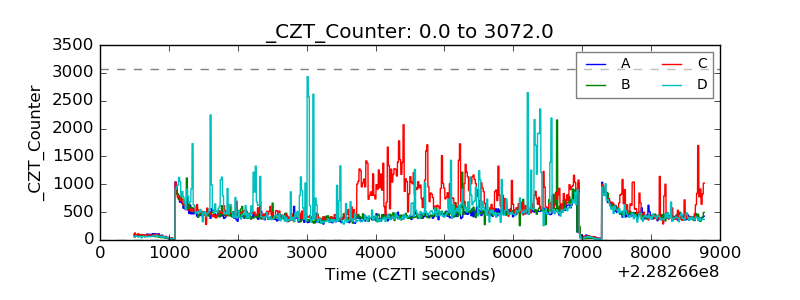 |
| +2.5 Volts monitor |  |
| +5 Volts monitor |  |
| _ROLL_ROT | 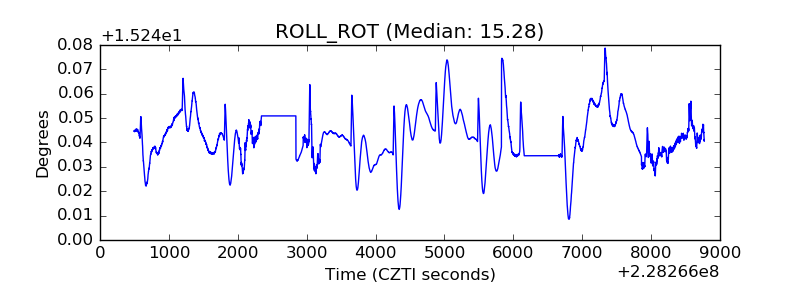 |
| _Roll_DEC | 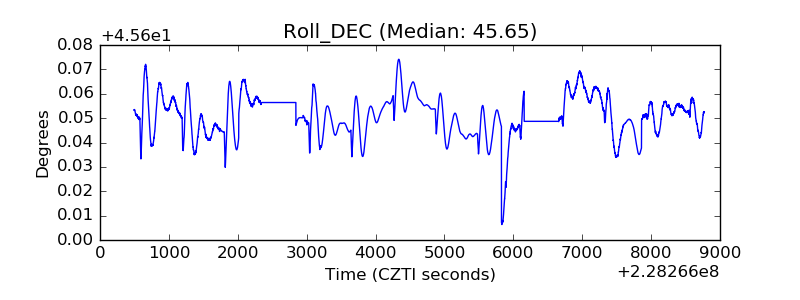 |
| _Roll_RA |  |
| Veto Counter | 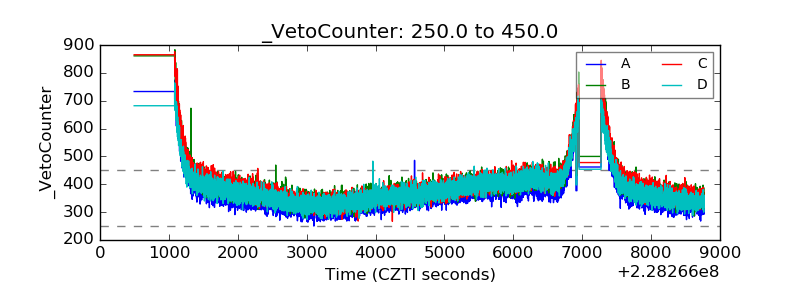 |