| Param | Original file | Final file |
|---|---|---|
| Filename | modeM0/AS1A02_055T01_9000001114_08081cztM0_level2.evt | modeM0/AS1A02_055T01_9000001114_08081cztM0_level2_quad_clean.evt |
| Size (bytes) | 586,906,560 | 118,111,680 |
| Size | 559.7 MB | 112.6 MB |
| Events in quadrant A | 3,803,867 | 742,410 |
| Events in quadrant B | 3,973,562 | 769,626 |
| Events in quadrant C | 5,485,937 | 759,076 |
| Events in quadrant D | 3,952,431 | 733,898 |
| Mode M0 | |||
|---|---|---|---|
| Quadrant | BADHDUFLAG | Total packets | Discarded packets |
| A | 0 | 17292 | 3 |
| B | 0 | 17615 | 2 |
| C | 0 | 21889 | 2 |
| D | 0 | 17945 | 2 |
| Mode M9 | |||
|---|---|---|---|
| Quadrant | BADHDUFLAG | Total packets | Discarded packets |
| A | 0 | 3 | 0 |
| B | 0 | 3 | 0 |
| C | 0 | 3 | 0 |
| D | 0 | 3 | 0 |
| Mode SS | |||
|---|---|---|---|
| Quadrant | BADHDUFLAG | Total packets | Discarded packets |
| A | 0 | 168 | 0 |
| B | 0 | 168 | 0 |
| C | 0 | 168 | 0 |
| D | 0 | 168 | 0 |
| Quadrant | Total seconds | Saturated seconds | Saturation percentage |
|---|---|---|---|
| A | 8228 | 101 | 1.227516% |
| B | 8228 | 171 | 2.078269% |
| C | 8228 | 294 | 3.573165% |
| D | 8228 | 99 | 1.203209% |
Noise dominated data is calculated using 1-second bins in cleaned event files. If a bin has >2000 counts, and if more than 50% of those come from <1% of pixels, then it is considered to be noise-dominated and hence unusable.
| Quadrant | # 1 sec bins | Bins with >0 counts | Bins with >2000 counts | High rate bins dominated by noise | Noise dominated (total time) | Noise dominated (detector-on time) | Marked lightcurve |
|---|---|---|---|---|---|---|---|
| A | 8623 | 8231 | 1 | 1 | 0.01% | 0.01% | 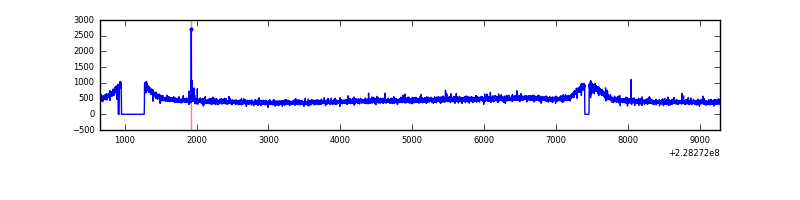 |
| B | 8623 | 8231 | 1 | 1 | 0.01% | 0.01% | 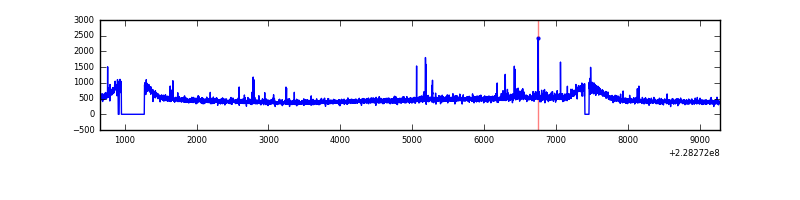 |
| C | 8623 | 8231 | 322 | 322 | 3.73% | 3.91% | 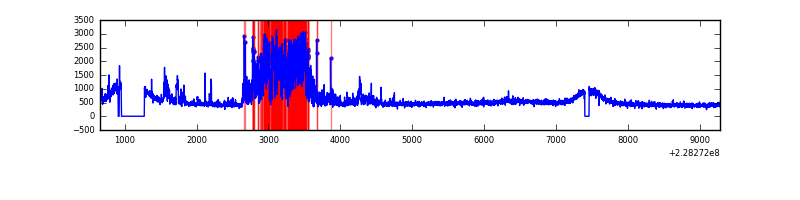 |
| D | 8623 | 8231 | 39 | 39 | 0.45% | 0.47% | 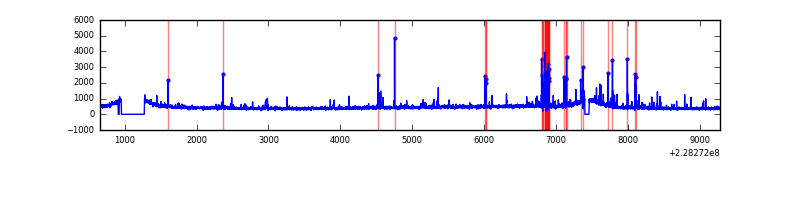 |
Top three noisy pixels from each quadrant. If the there are fewer than three noisy pixels in the level2.evt file, extra rows are filled as -1
| Pixel properties | Quadrant properties | ||||||
|---|---|---|---|---|---|---|---|
| Quadrant | DetID | PixID | Counts | Sigma | Mean | Median | Sigma |
| A | 13 | 248 | 12946 | 58.72 | 985 | 959 | 204.1 |
| A | 0 | 226 | 9105 | 39.91 | 985 | 959 | 204.1 |
| A | 12 | 194 | 8813 | 38.48 | 985 | 959 | 204.1 |
| B | 11 | 51 | 50340 | 254.49 | 1000 | 972 | 194.0 |
| B | 10 | 16 | 22666 | 111.83 | 1000 | 972 | 194.0 |
| B | 12 | 111 | 21515 | 105.9 | 1000 | 972 | 194.0 |
| C | 9 | 68 | 1654727 | 7245.38 | 969 | 973 | 228.2 |
| C | 1 | 16 | 38241 | 163.28 | 969 | 973 | 228.2 |
| C | 13 | 61 | 7255 | 27.52 | 969 | 973 | 228.2 |
| D | 1 | 52 | 233771 | 916.43 | 954 | 931 | 254.1 |
| D | 2 | 234 | 29419 | 112.13 | 954 | 931 | 254.1 |
| D | 1 | 83 | 28826 | 109.79 | 954 | 931 | 254.1 |
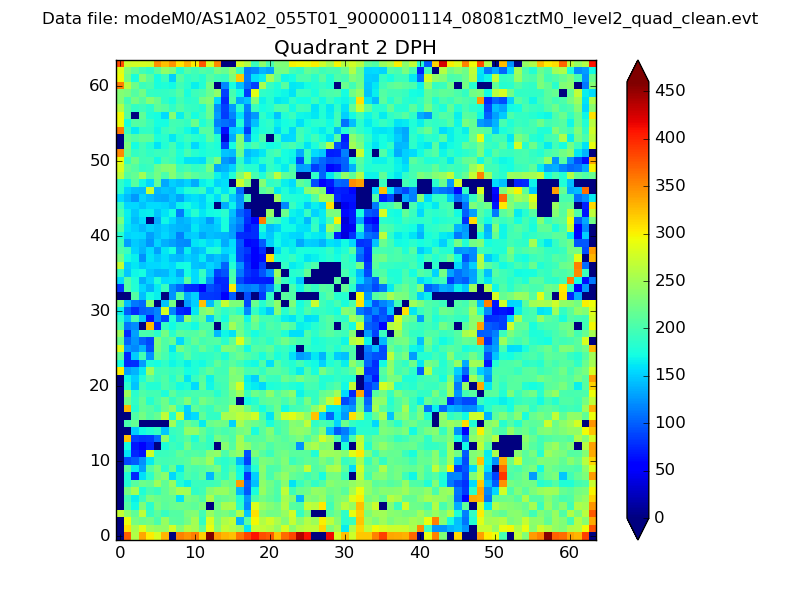
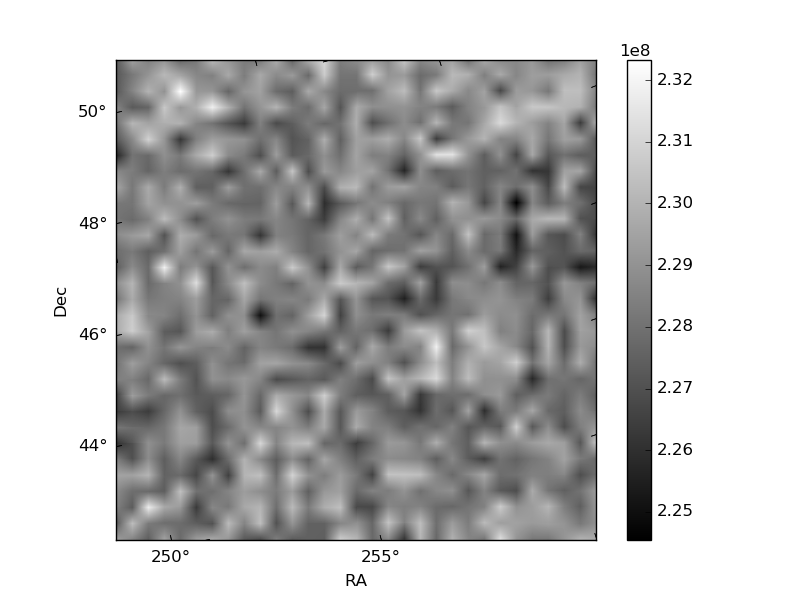
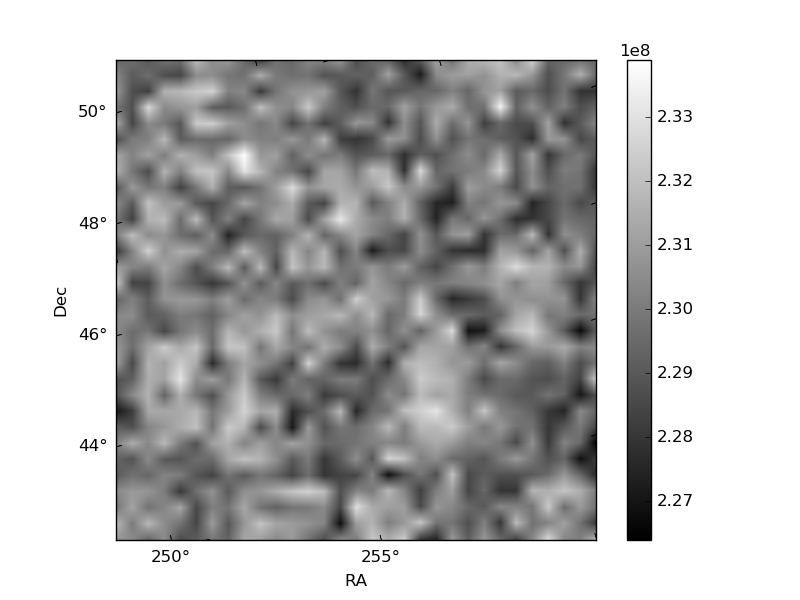
Histogram calculated using DETX and DETY for each event in the final _common_clean file
| Quadrant A | 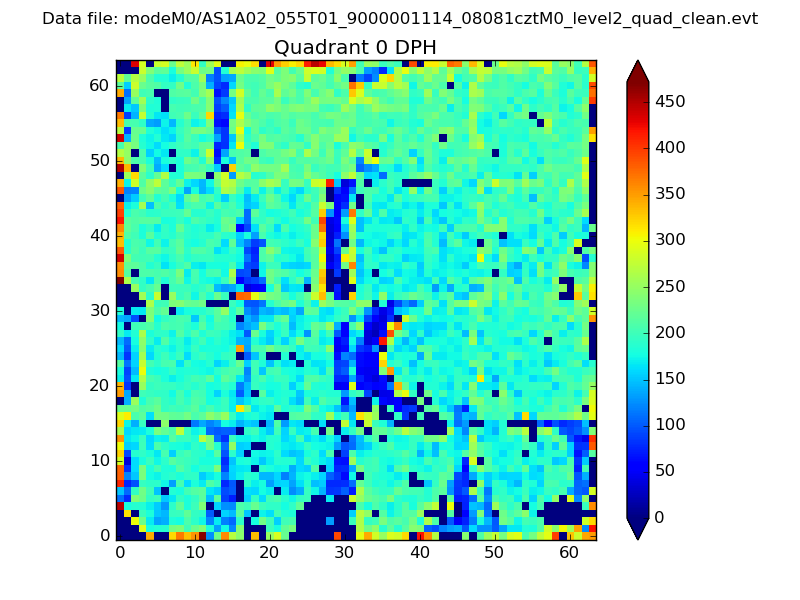 |
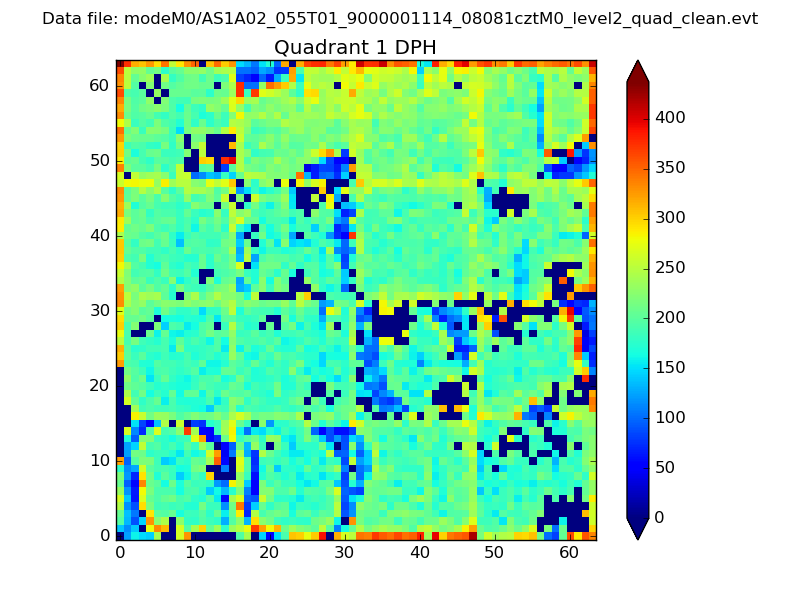 |
Quadrant B |
|---|---|---|---|
| Quadrant D | 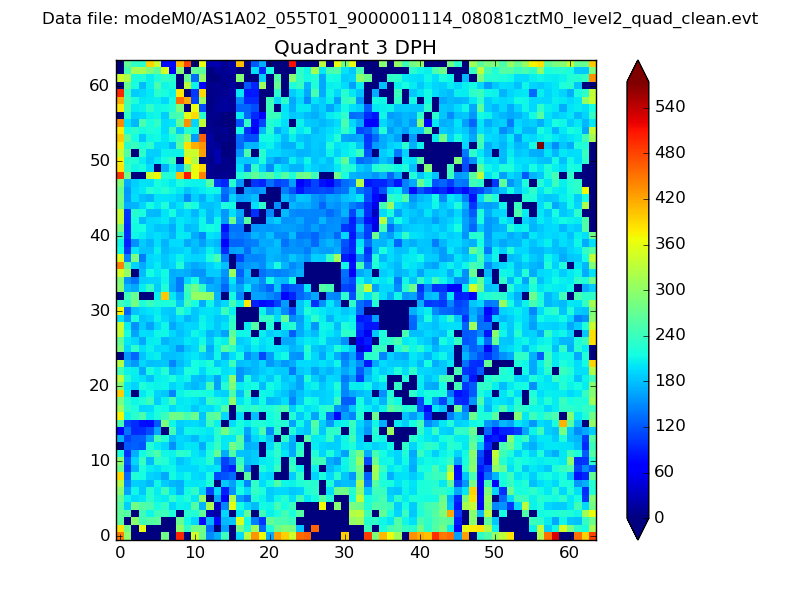 |
 |
Quadrant C |
| Plot type | Count rate plots | Images |
|---|---|---|
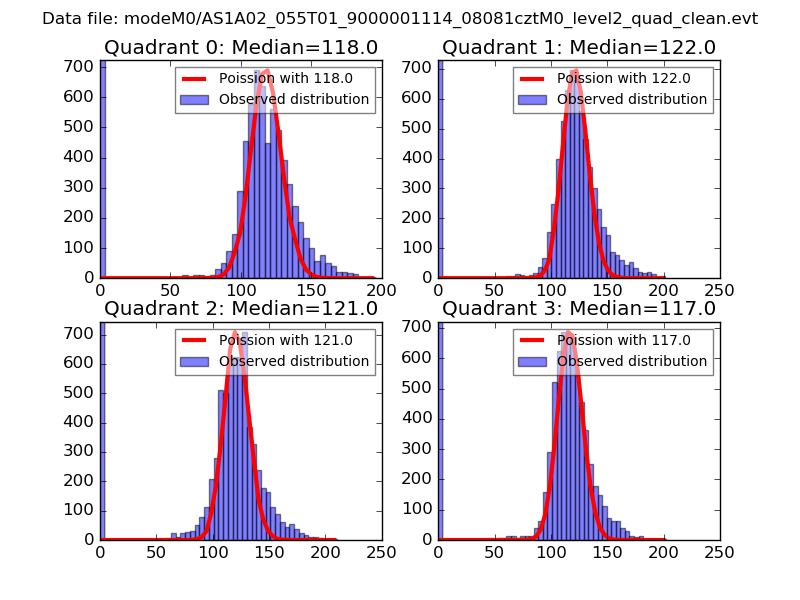
| Comparison with Poisson distribution Blue bars denote a histogram of data divided into 1 sec bins. Red curve is a Poisson curve with rate = median count rate of data. |
 |
 |
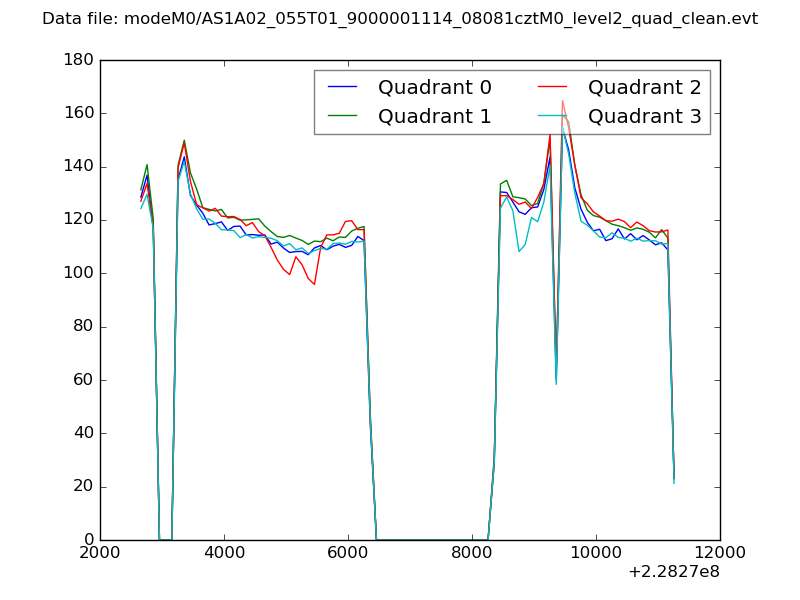
| Quadrant-wise count rates Data is divided into 100 sec bins |
 |
|
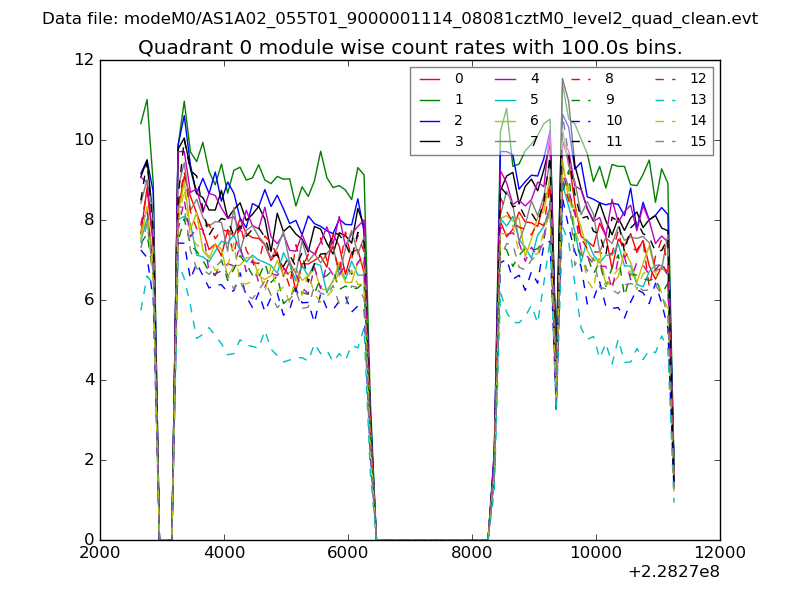
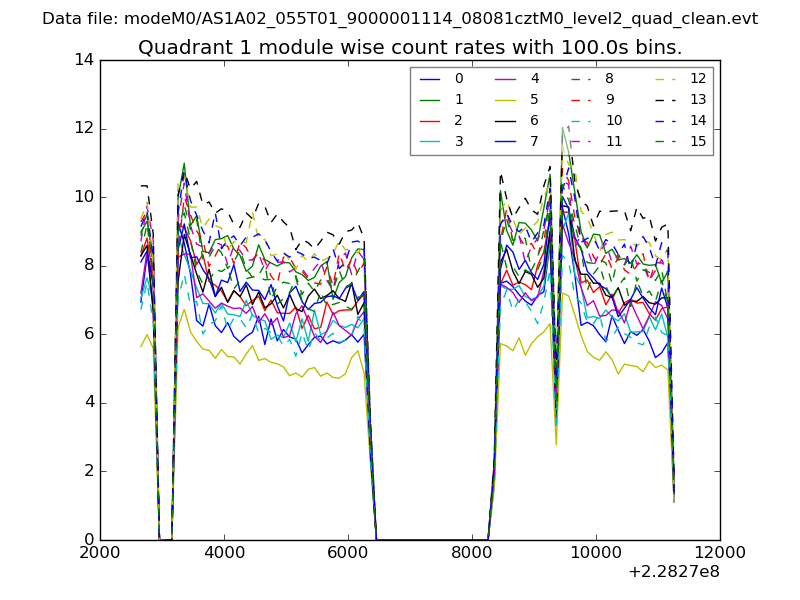
| Module-wise count rates for Quadrant A Data is divided into 100 sec bins |
 |
 |
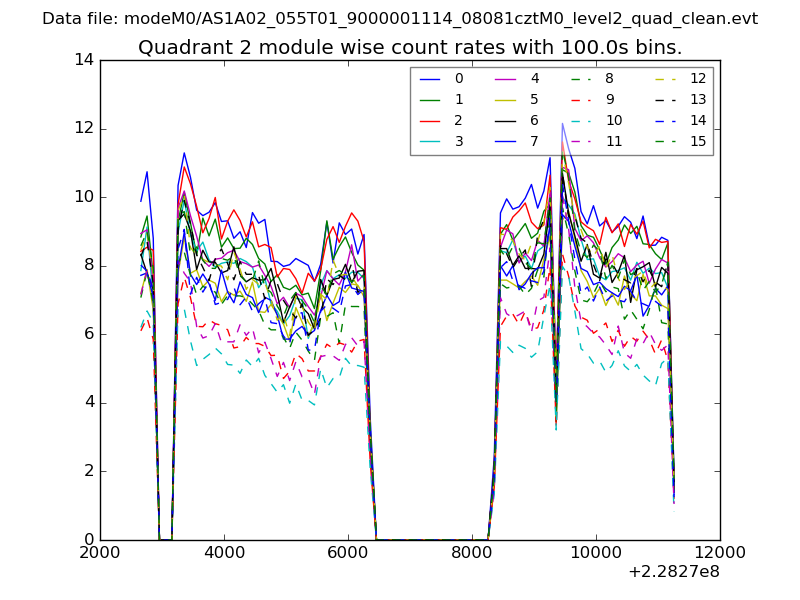
| Module-wise count rates for Quadrant B Data is divided into 100 sec bins |
 |
 |
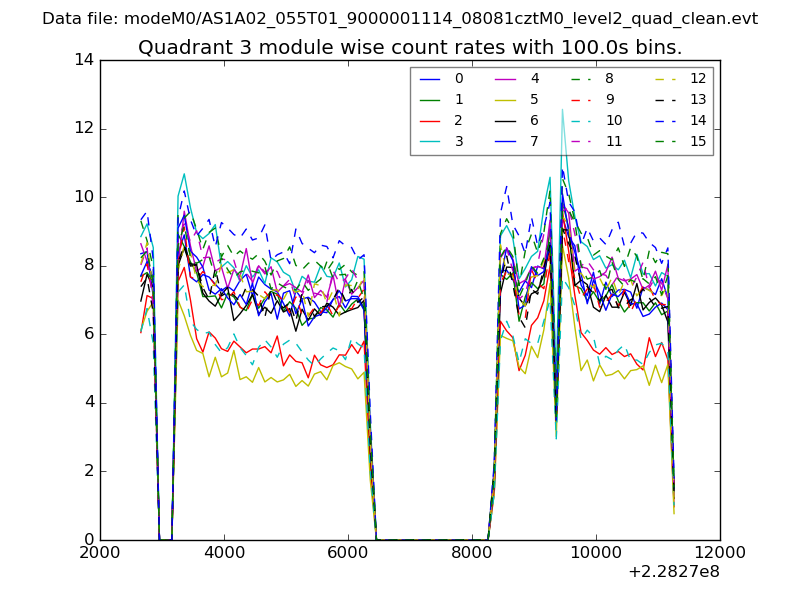
| Module-wise count rates for Quadrant C Data is divided into 100 sec bins |
 |
 |
| Module-wise count rates for Quadrant D Data is divided into 100 sec bins |
 |
 |
| Parameter | Plot |
|---|---|
| CZT HV Monitor | 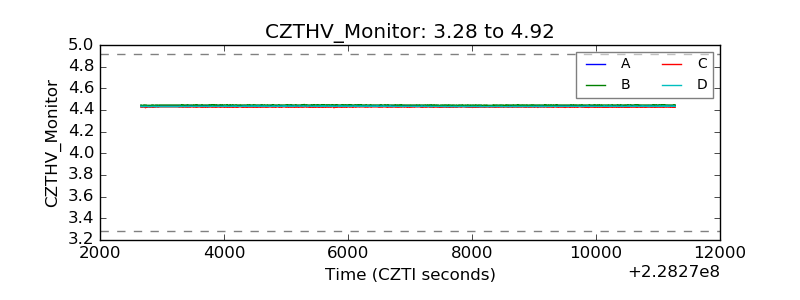 |
| D_VDD | 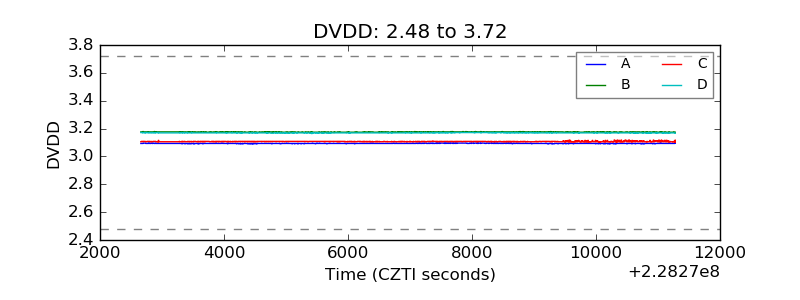 |
| Temperature 1 | 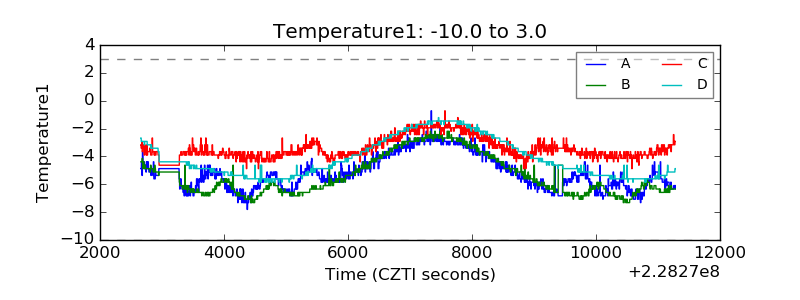 |
| Veto HV Monitor |  |
| Veto LLD | 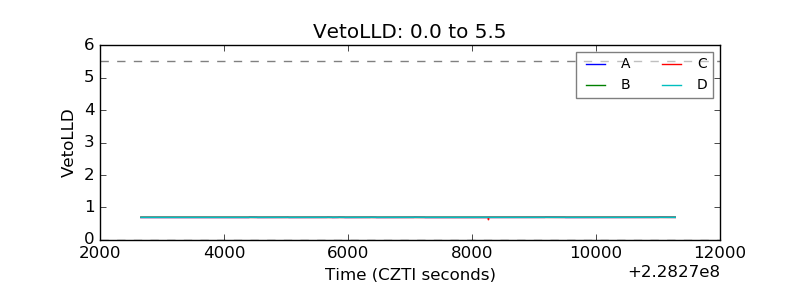 |
| Alpha Counter | 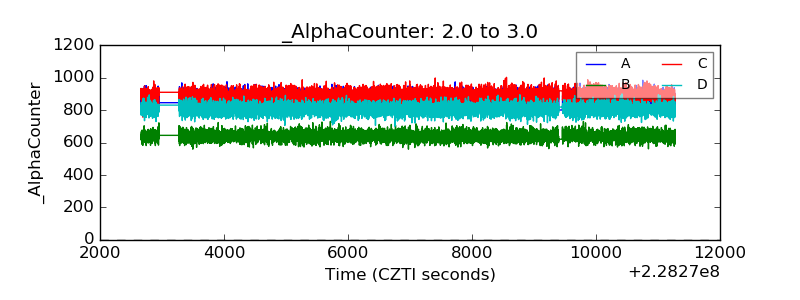 |
| _CPM_Rate | 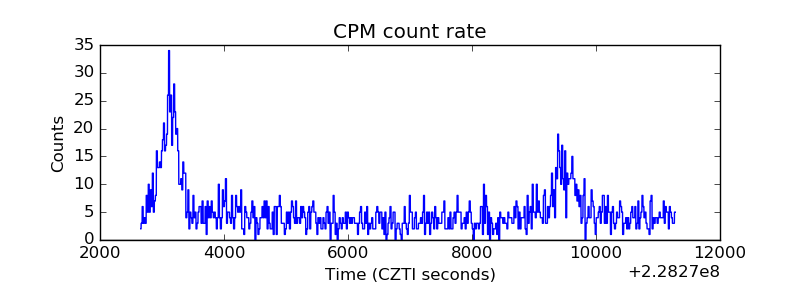 |
| CZT Counter | 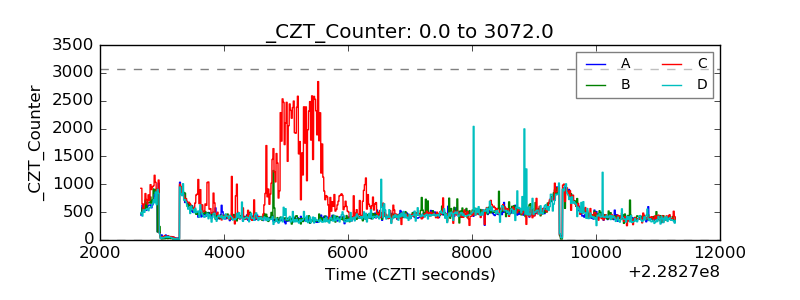 |
| +2.5 Volts monitor |  |
| +5 Volts monitor |  |
| _ROLL_ROT | 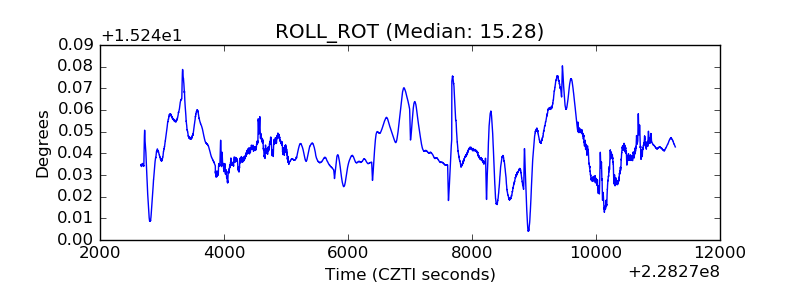 |
| _Roll_DEC | 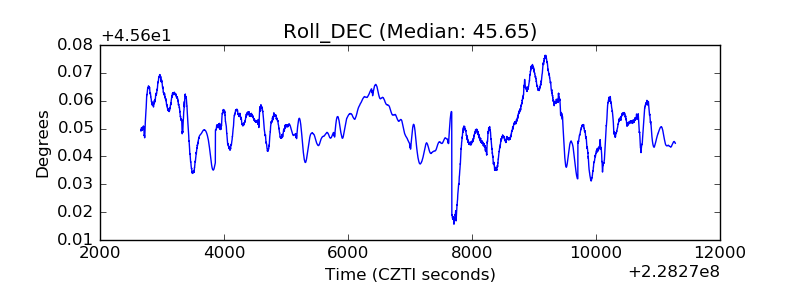 |
| _Roll_RA | 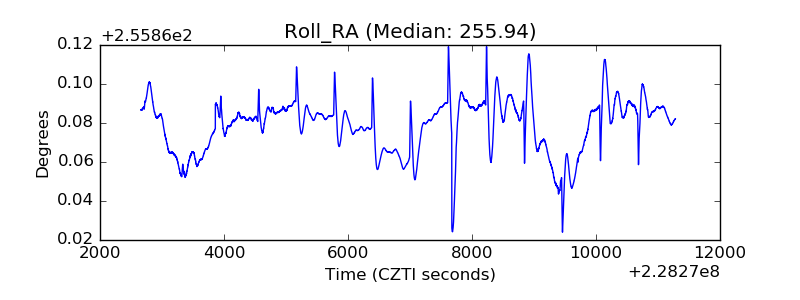 |
| Veto Counter | 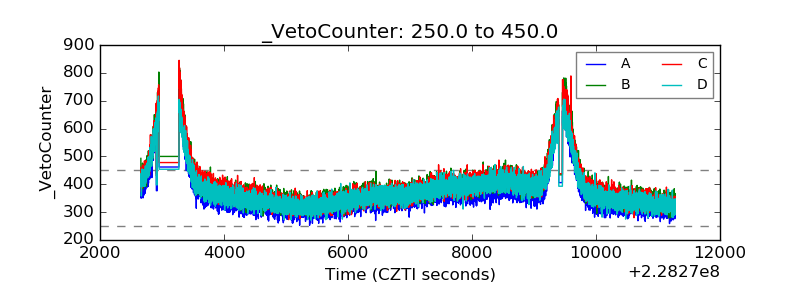 |