| Param | Original file | Final file |
|---|---|---|
| Filename | modeM0/AS1A02_055T01_9000001114_08082cztM0_level2.evt | modeM0/AS1A02_055T01_9000001114_08082cztM0_level2_quad_clean.evt |
| Size (bytes) | 542,122,560 | 118,160,640 |
| Size | 517.0 MB | 112.7 MB |
| Events in quadrant A | 3,767,607 | 739,118 |
| Events in quadrant B | 3,988,699 | 762,126 |
| Events in quadrant C | 3,856,296 | 770,852 |
| Events in quadrant D | 4,246,547 | 734,549 |
| Mode M0 | |||
|---|---|---|---|
| Quadrant | BADHDUFLAG | Total packets | Discarded packets |
| A | 0 | 17150 | 3 |
| B | 0 | 17597 | 2 |
| C | 0 | 17270 | 2 |
| D | 0 | 18793 | 2 |
| Mode M9 | |||
|---|---|---|---|
| Quadrant | BADHDUFLAG | Total packets | Discarded packets |
| A | 0 | 3 | 0 |
| B | 0 | 3 | 0 |
| C | 0 | 3 | 0 |
| D | 0 | 3 | 0 |
| Mode SS | |||
|---|---|---|---|
| Quadrant | BADHDUFLAG | Total packets | Discarded packets |
| A | 0 | 168 | 0 |
| B | 0 | 168 | 0 |
| C | 0 | 168 | 0 |
| D | 0 | 168 | 0 |
| Quadrant | Total seconds | Saturated seconds | Saturation percentage |
|---|---|---|---|
| A | 8232 | 138 | 1.676385% |
| B | 8232 | 216 | 2.623907% |
| C | 8232 | 94 | 1.141885% |
| D | 8232 | 198 | 2.405248% |
Noise dominated data is calculated using 1-second bins in cleaned event files. If a bin has >2000 counts, and if more than 50% of those come from <1% of pixels, then it is considered to be noise-dominated and hence unusable.
| Quadrant | # 1 sec bins | Bins with >0 counts | Bins with >2000 counts | High rate bins dominated by noise | Noise dominated (total time) | Noise dominated (detector-on time) | Marked lightcurve |
|---|---|---|---|---|---|---|---|
| A | 8547 | 8236 | 0 | 0 | 0.00% | 0.00% | 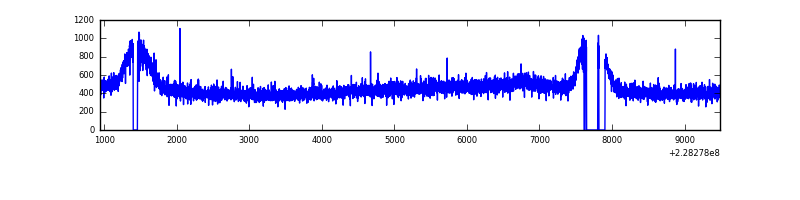 |
| B | 8547 | 8236 | 15 | 15 | 0.18% | 0.18% | 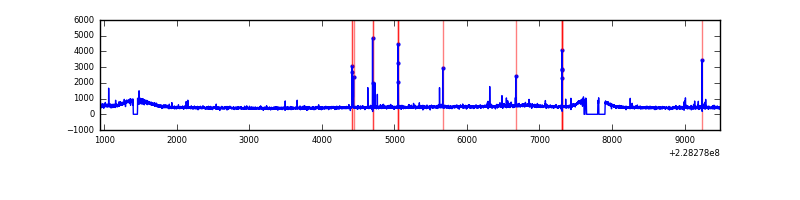 |
| C | 8547 | 8236 | 0 | 0 | 0.00% | 0.00% | 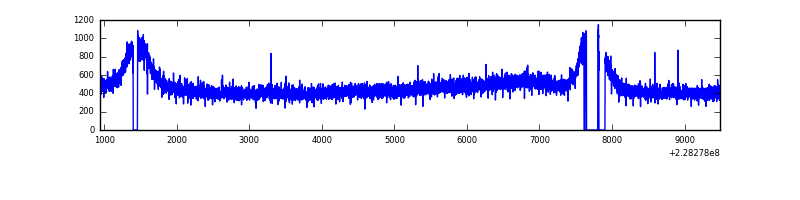 |
| D | 8547 | 8236 | 97 | 97 | 1.13% | 1.18% | 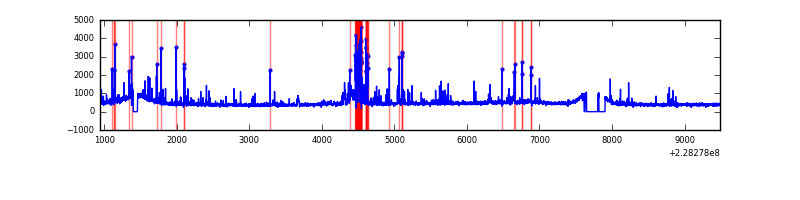 |
Top three noisy pixels from each quadrant. If the there are fewer than three noisy pixels in the level2.evt file, extra rows are filled as -1
| Pixel properties | Quadrant properties | ||||||
|---|---|---|---|---|---|---|---|
| Quadrant | DetID | PixID | Counts | Sigma | Mean | Median | Sigma |
| A | 0 | 226 | 9020 | 39.68 | 979 | 952 | 203.3 |
| A | 12 | 194 | 8887 | 39.03 | 979 | 952 | 203.3 |
| A | 3 | 137 | 3943 | 14.71 | 979 | 952 | 203.3 |
| B | 10 | 16 | 69455 | 358.13 | 992 | 967 | 191.2 |
| B | 11 | 51 | 38400 | 195.74 | 992 | 967 | 191.2 |
| B | 12 | 111 | 21475 | 107.24 | 992 | 967 | 191.2 |
| C | 9 | 68 | 33610 | 144.56 | 964 | 971 | 225.8 |
| C | 1 | 16 | 31072 | 133.32 | 964 | 971 | 225.8 |
| C | 8 | 128 | 16253 | 67.69 | 964 | 971 | 225.8 |
| D | 1 | 52 | 522958 | 2079.3 | 942 | 919 | 251.1 |
| D | 7 | 71 | 75630 | 297.58 | 942 | 919 | 251.1 |
| D | 12 | 233 | 31793 | 122.97 | 942 | 919 | 251.1 |
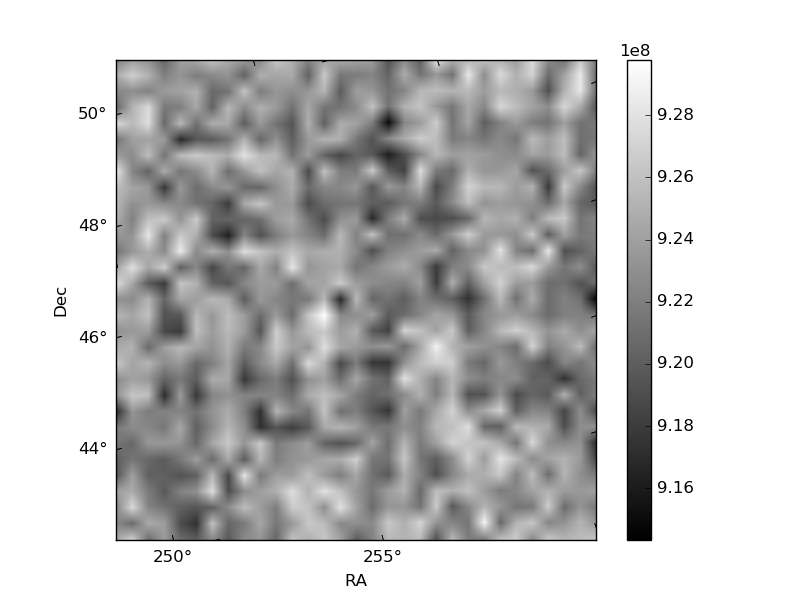
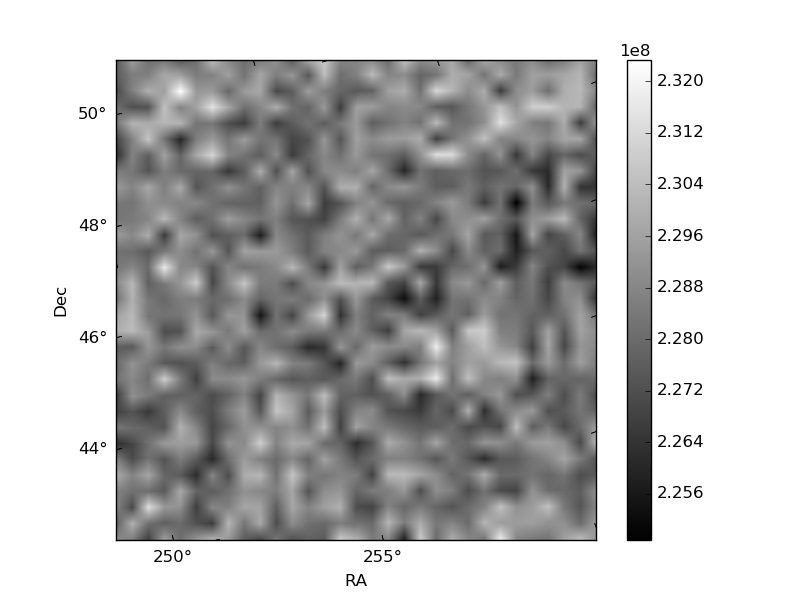
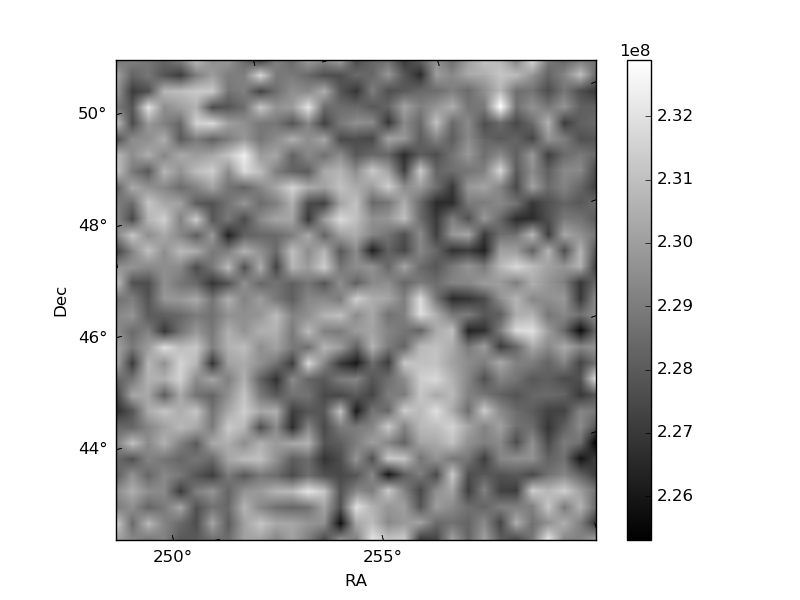
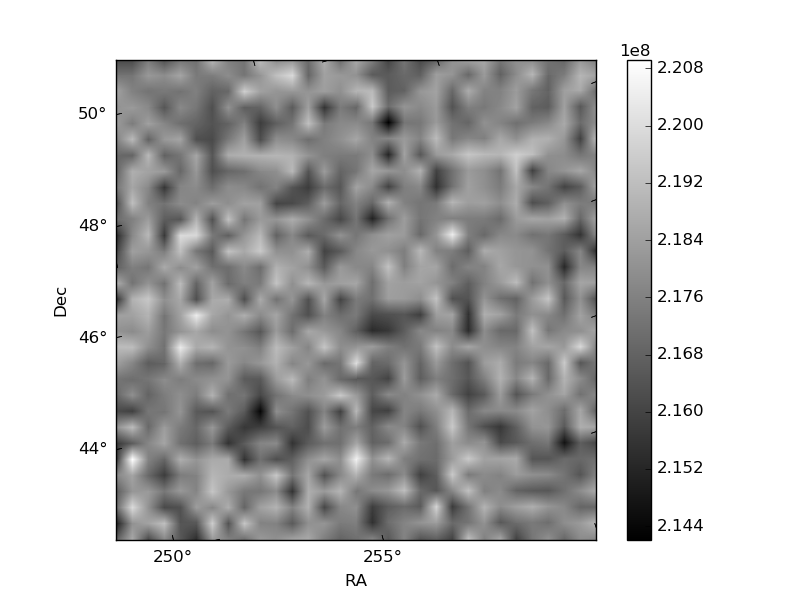
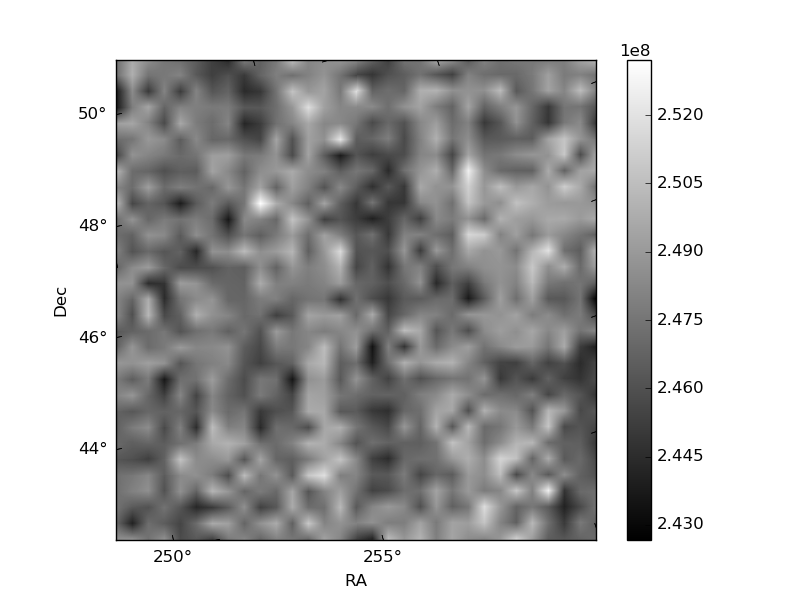
Histogram calculated using DETX and DETY for each event in the final _common_clean file
| Quadrant A | 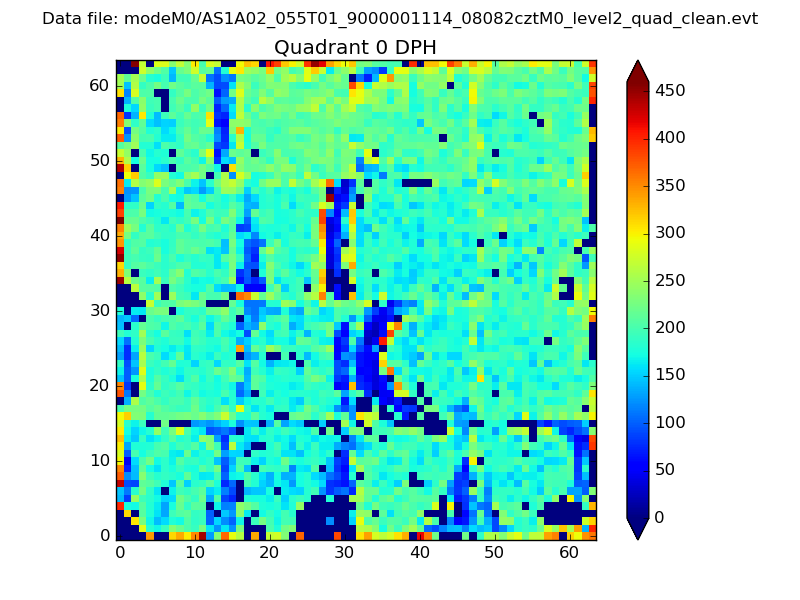 |
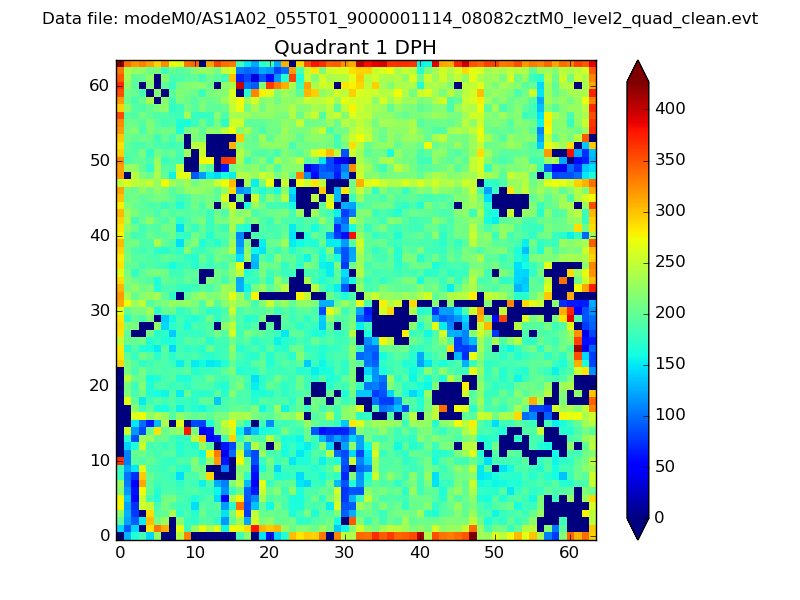 |
Quadrant B |
|---|---|---|---|
| Quadrant D | 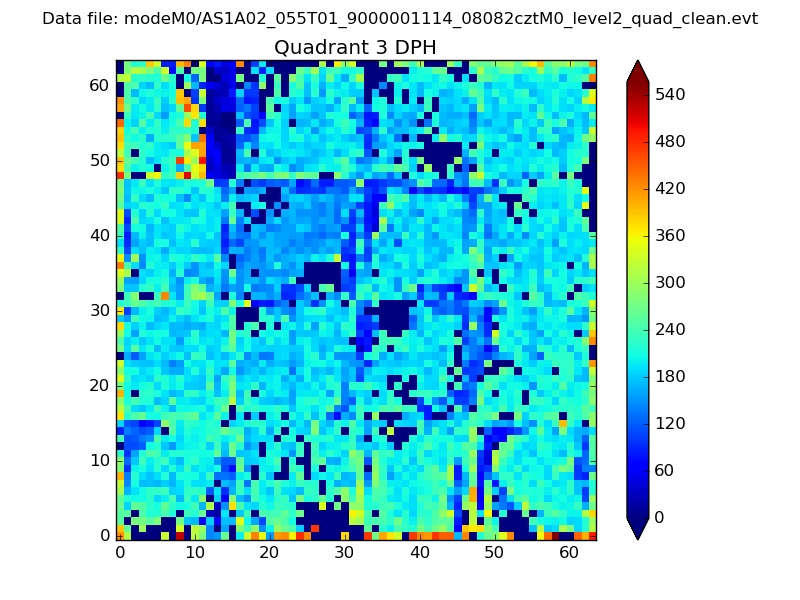 |
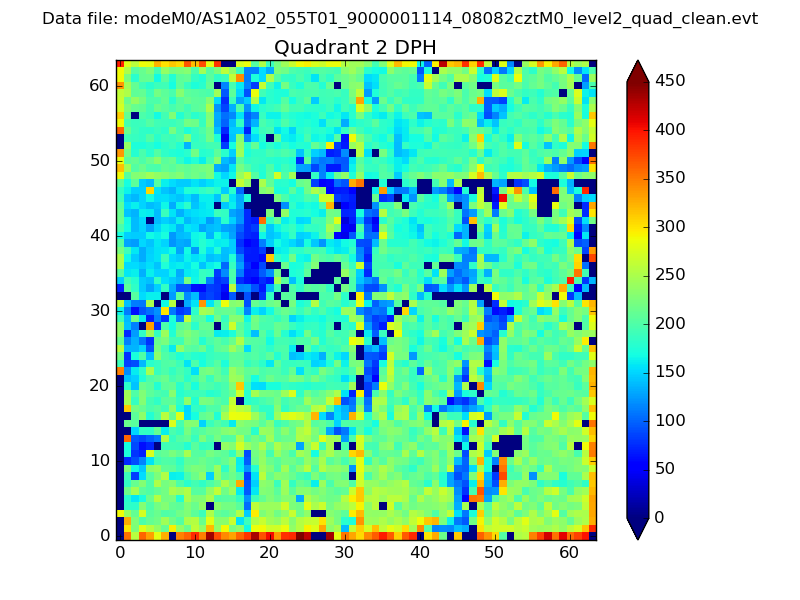 |
Quadrant C |
| Plot type | Count rate plots | Images |
|---|---|---|
| Comparison with Poisson distribution Blue bars denote a histogram of data divided into 1 sec bins. Red curve is a Poisson curve with rate = median count rate of data. |
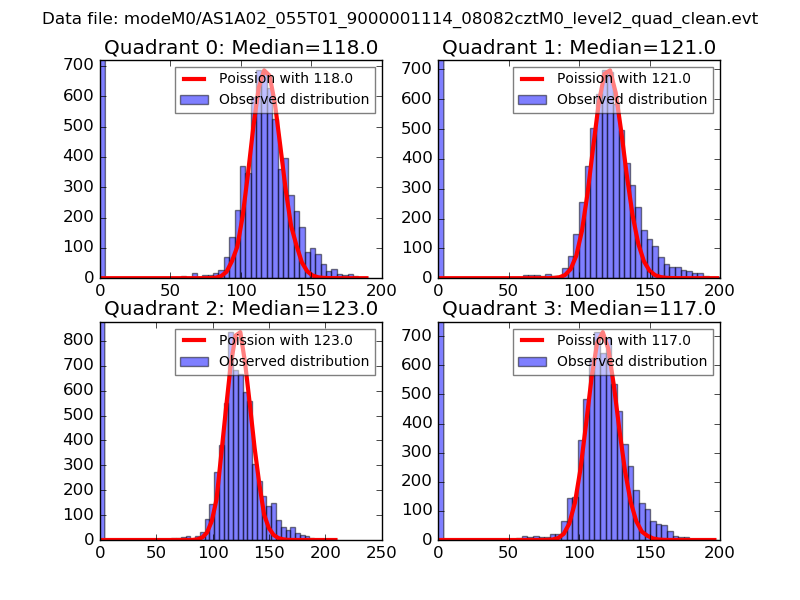 |
 |
| Quadrant-wise count rates Data is divided into 100 sec bins |
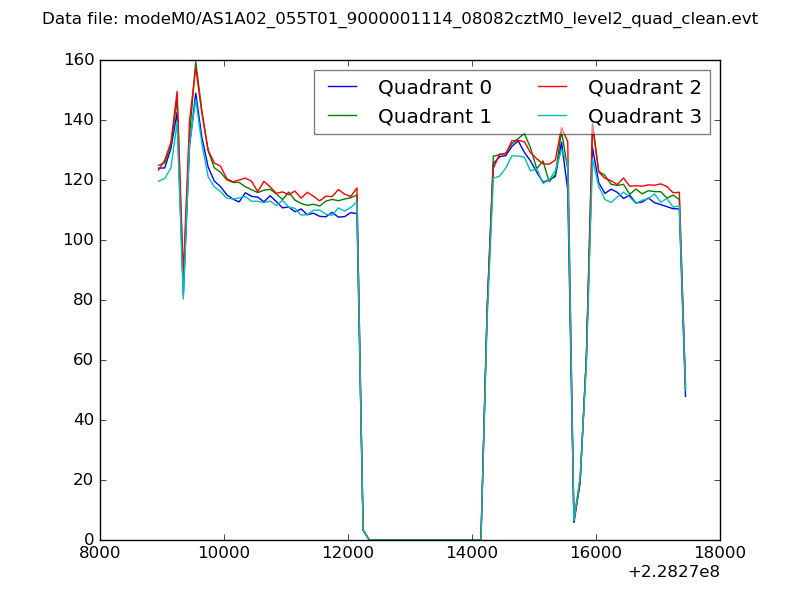 |
|
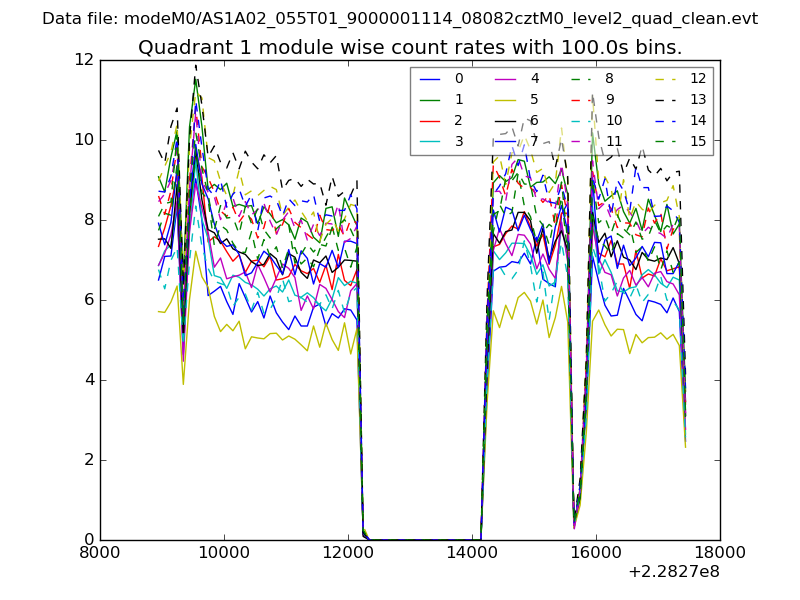
| Module-wise count rates for Quadrant A Data is divided into 100 sec bins |
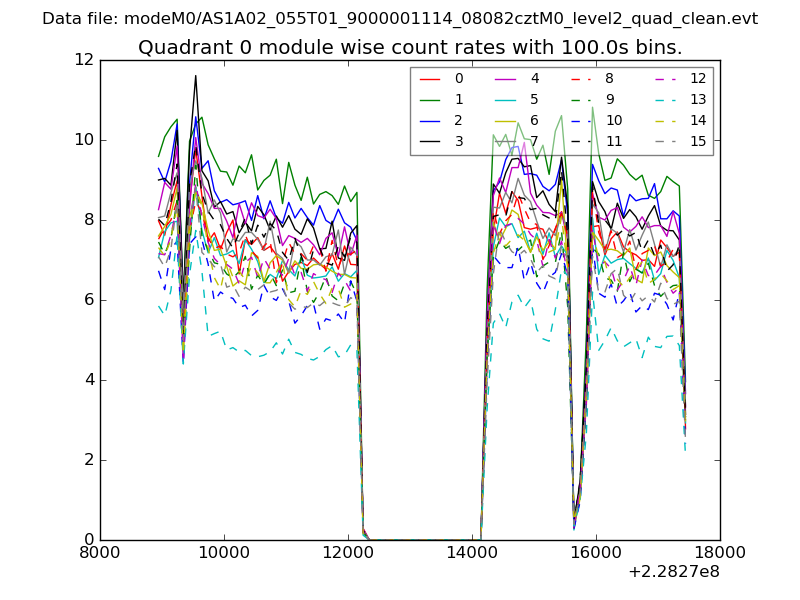 |
 |
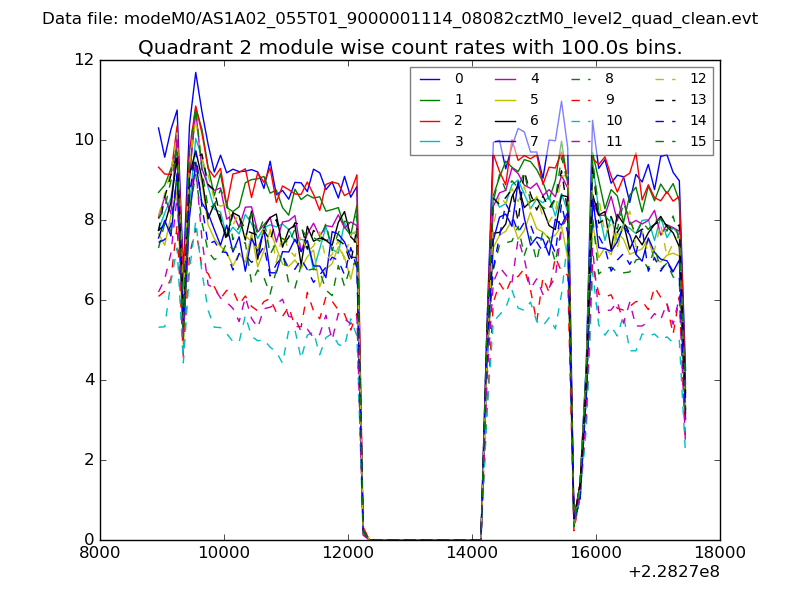
| Module-wise count rates for Quadrant B Data is divided into 100 sec bins |
 |
 |
| Module-wise count rates for Quadrant C Data is divided into 100 sec bins |
 |
 |
| Module-wise count rates for Quadrant D Data is divided into 100 sec bins |
 |
 |
| Parameter | Plot |
|---|---|
| CZT HV Monitor | 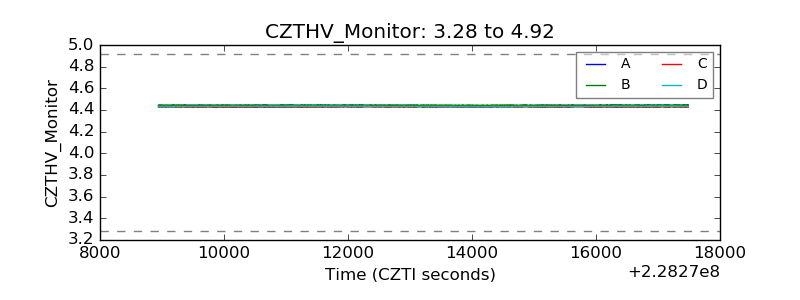 |
| D_VDD | 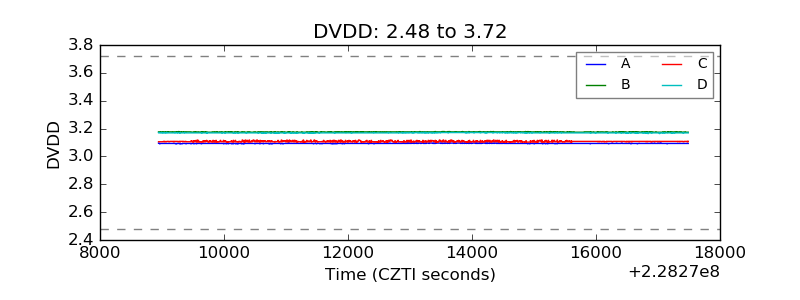 |
| Temperature 1 | 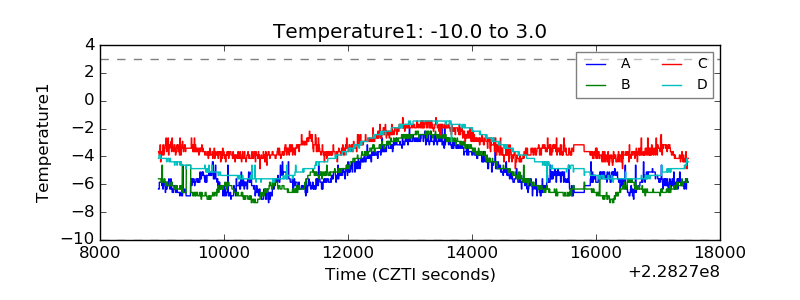 |
| Veto HV Monitor |  |
| Veto LLD | 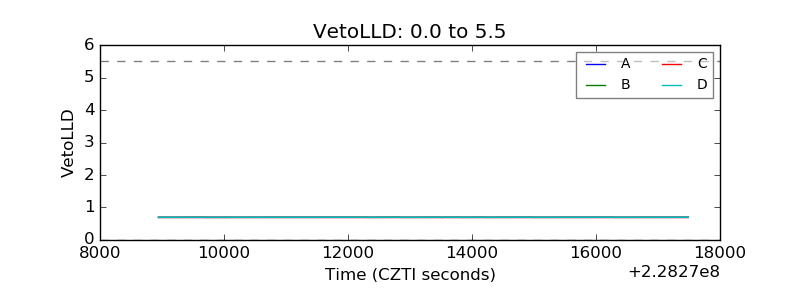 |
| Alpha Counter | 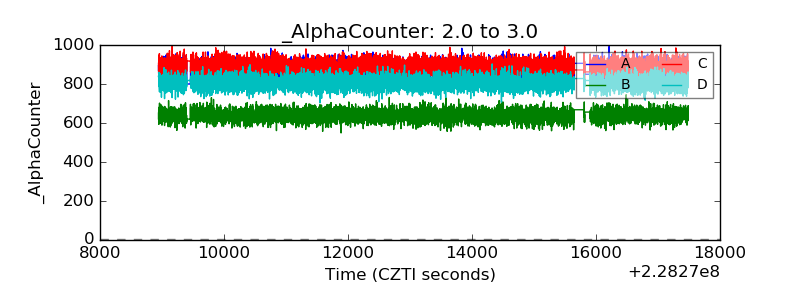 |
| _CPM_Rate | 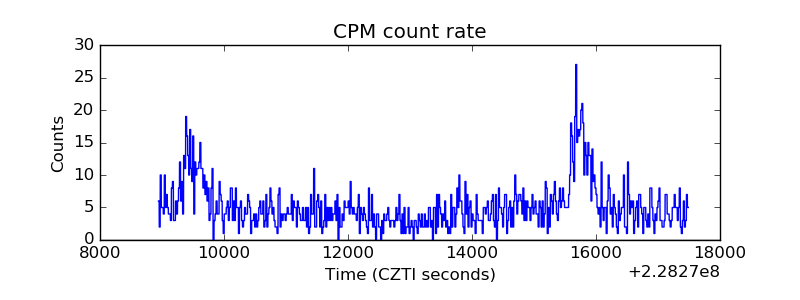 |
| CZT Counter | 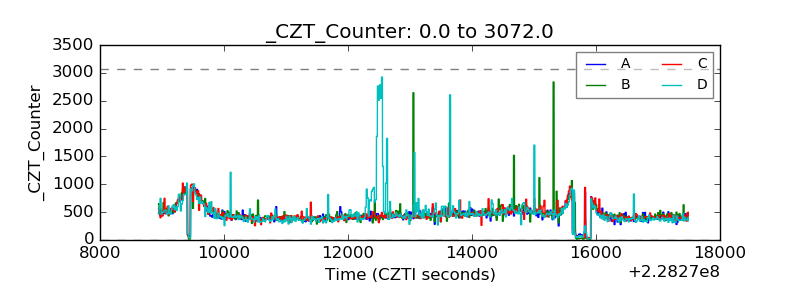 |
| +2.5 Volts monitor |  |
| +5 Volts monitor |  |
| _ROLL_ROT | 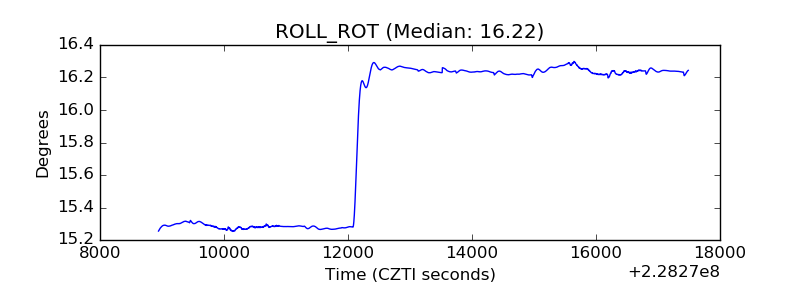 |
| _Roll_DEC | 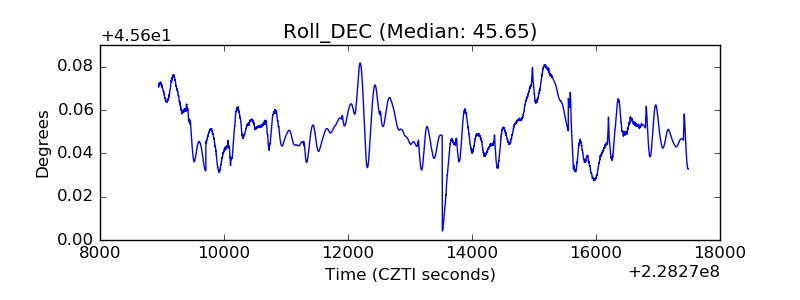 |
| _Roll_RA | 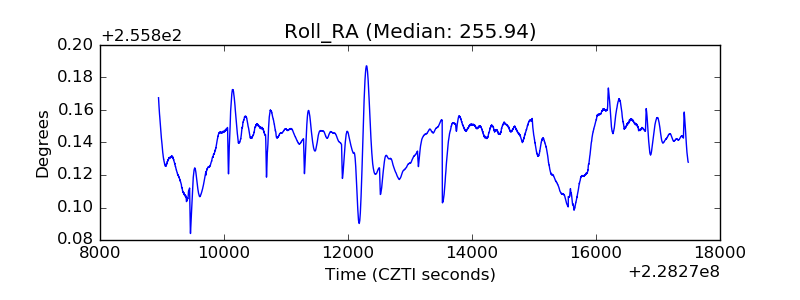 |
| Veto Counter | 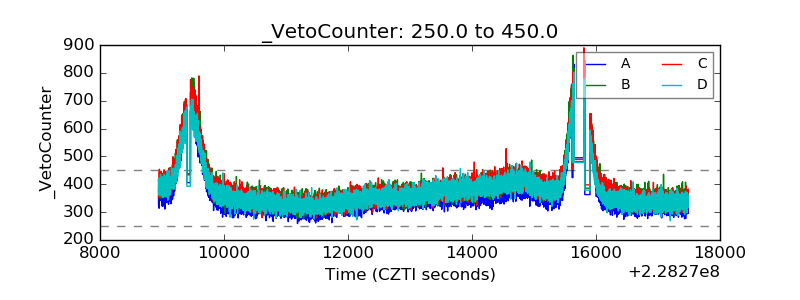 |