| Param | Original file | Final file |
|---|---|---|
| Filename | modeM0/AS1A02_055T01_9000001114_08084cztM0_level2.evt | modeM0/AS1A02_055T01_9000001114_08084cztM0_level2_quad_clean.evt |
| Size (bytes) | 876,000,960 | 177,027,840 |
| Size | 835.4 MB | 168.8 MB |
| Events in quadrant A | 6,269,346 | 1,087,531 |
| Events in quadrant B | 6,689,647 | 1,122,751 |
| Events in quadrant C | 6,270,853 | 1,132,955 |
| Events in quadrant D | 6,384,414 | 1,085,009 |
| Mode M0 | |||
|---|---|---|---|
| Quadrant | BADHDUFLAG | Total packets | Discarded packets |
| A | 0 | 28141 | 4 |
| B | 0 | 28886 | 3 |
| C | 0 | 27787 | 3 |
| D | 0 | 28774 | 3 |
| Mode M9 | |||
|---|---|---|---|
| Quadrant | BADHDUFLAG | Total packets | Discarded packets |
| A | 0 | 14 | 0 |
| B | 0 | 14 | 0 |
| C | 0 | 14 | 0 |
| D | 0 | 14 | 0 |
| Mode SS | |||
|---|---|---|---|
| Quadrant | BADHDUFLAG | Total packets | Discarded packets |
| A | 0 | 276 | 0 |
| B | 0 | 276 | 0 |
| C | 0 | 276 | 0 |
| D | 0 | 276 | 0 |
| Quadrant | Total seconds | Saturated seconds | Saturation percentage |
|---|---|---|---|
| A | 13517 | 217 | 1.605386% |
| B | 13517 | 290 | 2.145446% |
| C | 13517 | 125 | 0.924761% |
| D | 13517 | 168 | 1.242879% |
Noise dominated data is calculated using 1-second bins in cleaned event files. If a bin has >2000 counts, and if more than 50% of those come from <1% of pixels, then it is considered to be noise-dominated and hence unusable.
| Quadrant | # 1 sec bins | Bins with >0 counts | Bins with >2000 counts | High rate bins dominated by noise | Noise dominated (total time) | Noise dominated (detector-on time) | Marked lightcurve |
|---|---|---|---|---|---|---|---|
| A | 14837 | 13521 | 0 | 0 | 0.00% | 0.00% | 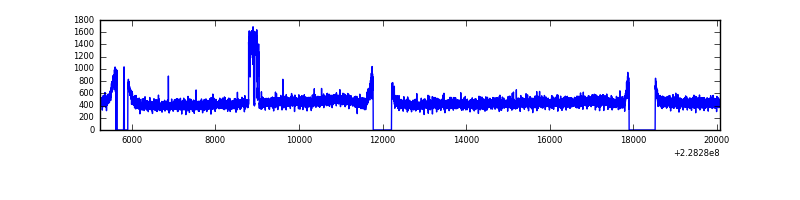 |
| B | 14837 | 13522 | 45 | 45 | 0.30% | 0.33% | 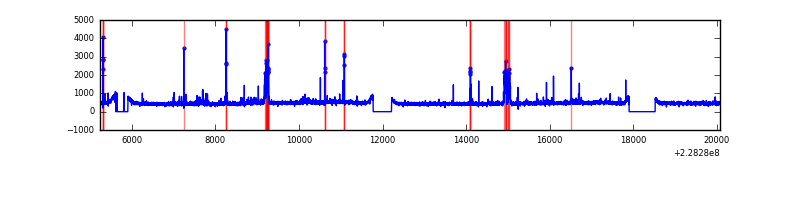 |
| C | 14837 | 13522 | 0 | 0 | 0.00% | 0.00% | 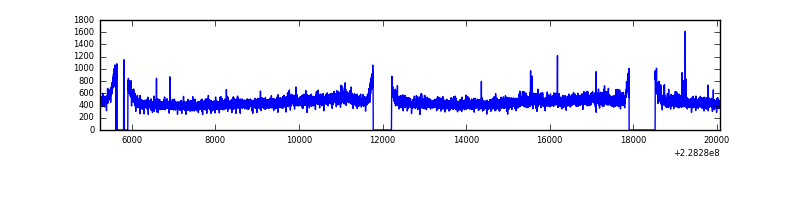 |
| D | 14837 | 13522 | 36 | 36 | 0.24% | 0.27% | 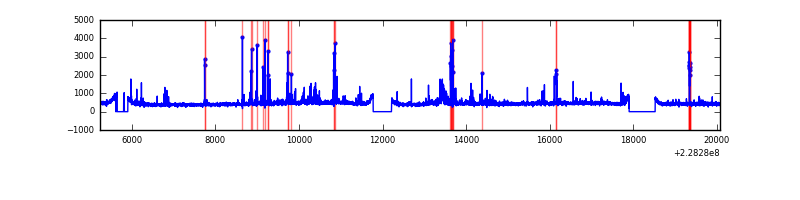 |
Top three noisy pixels from each quadrant. If the there are fewer than three noisy pixels in the level2.evt file, extra rows are filled as -1
| Pixel properties | Quadrant properties | ||||||
|---|---|---|---|---|---|---|---|
| Quadrant | DetID | PixID | Counts | Sigma | Mean | Median | Sigma |
| A | 15 | 79 | 213401 | 661.69 | 1571 | 1533 | 320.2 |
| A | 0 | 226 | 14633 | 40.91 | 1571 | 1533 | 320.2 |
| A | 12 | 194 | 14005 | 38.95 | 1571 | 1533 | 320.2 |
| B | 0 | 231 | 270620 | 887.44 | 1584 | 1542 | 303.2 |
| B | 10 | 16 | 76518 | 247.28 | 1584 | 1542 | 303.2 |
| B | 11 | 51 | 62362 | 200.59 | 1584 | 1542 | 303.2 |
| C | 1 | 16 | 142581 | 396.83 | 1538 | 1543 | 355.4 |
| C | 9 | 68 | 83879 | 231.66 | 1538 | 1543 | 355.4 |
| C | 8 | 128 | 17774 | 45.67 | 1538 | 1543 | 355.4 |
| D | 1 | 52 | 322291 | 796.01 | 1525 | 1486 | 403.0 |
| D | 2 | 33 | 98499 | 240.72 | 1525 | 1486 | 403.0 |
| D | 7 | 71 | 91341 | 222.96 | 1525 | 1486 | 403.0 |
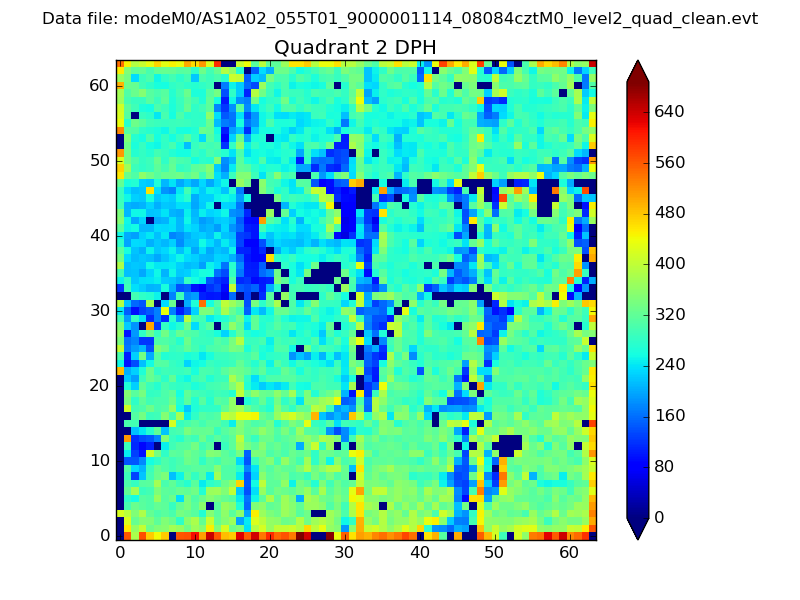
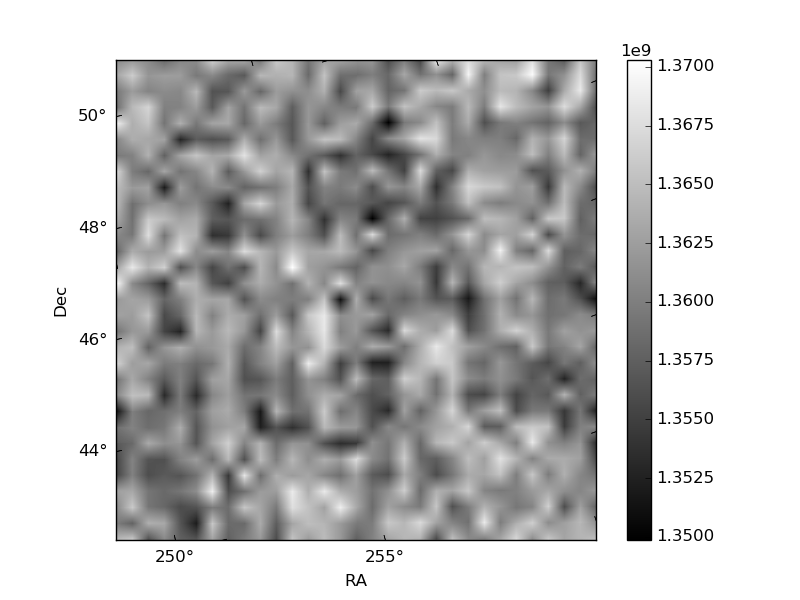
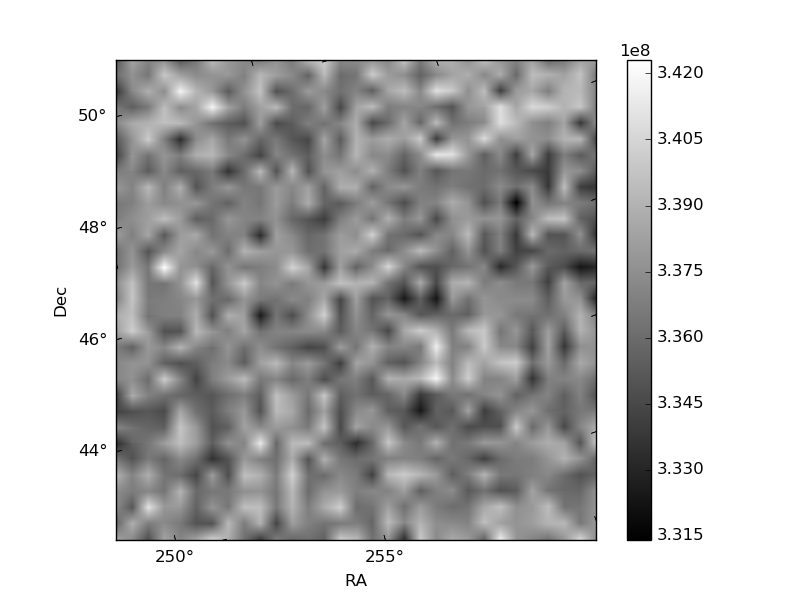
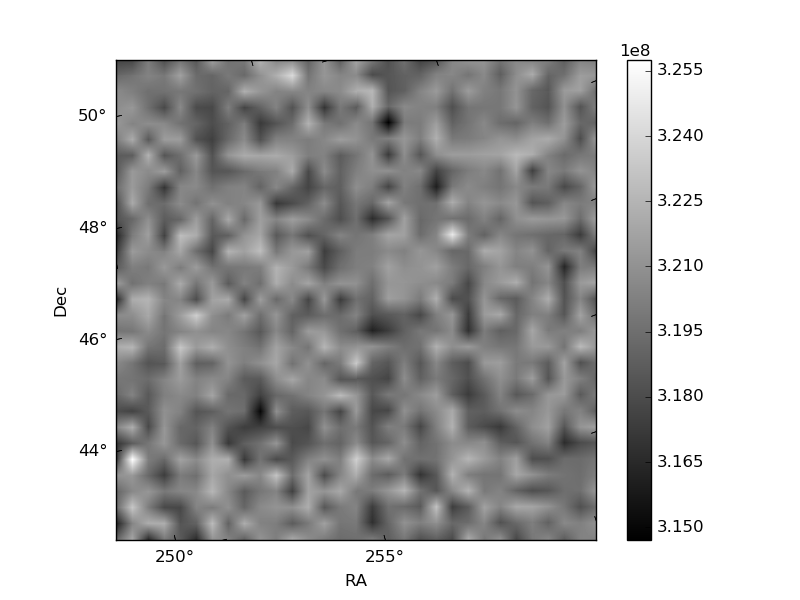
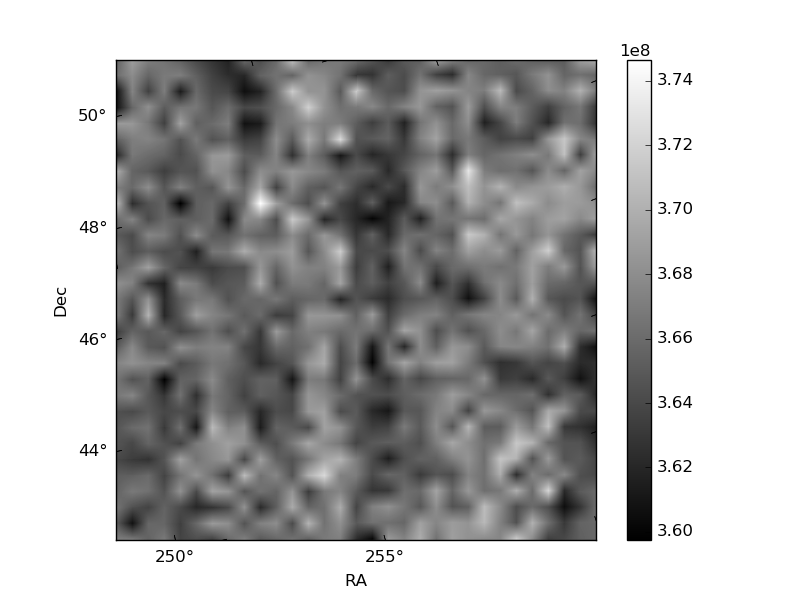
Histogram calculated using DETX and DETY for each event in the final _common_clean file
| Quadrant A | 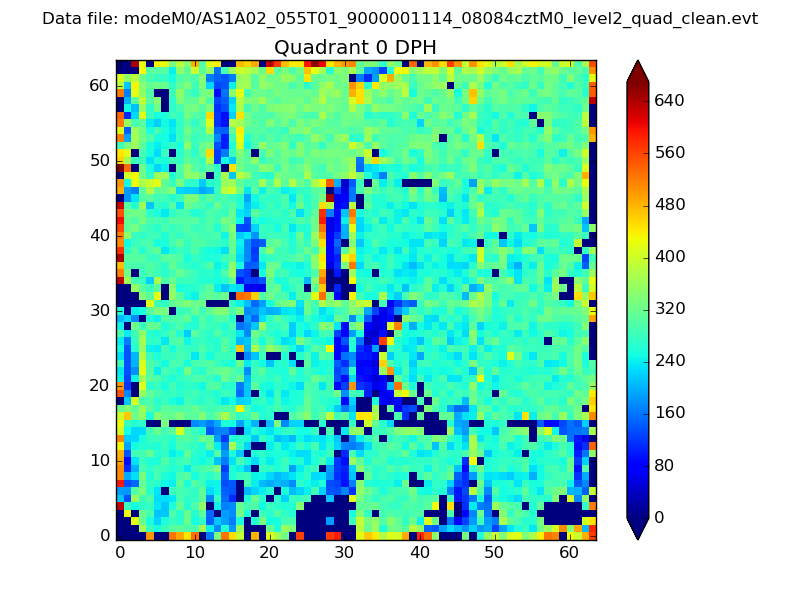 |
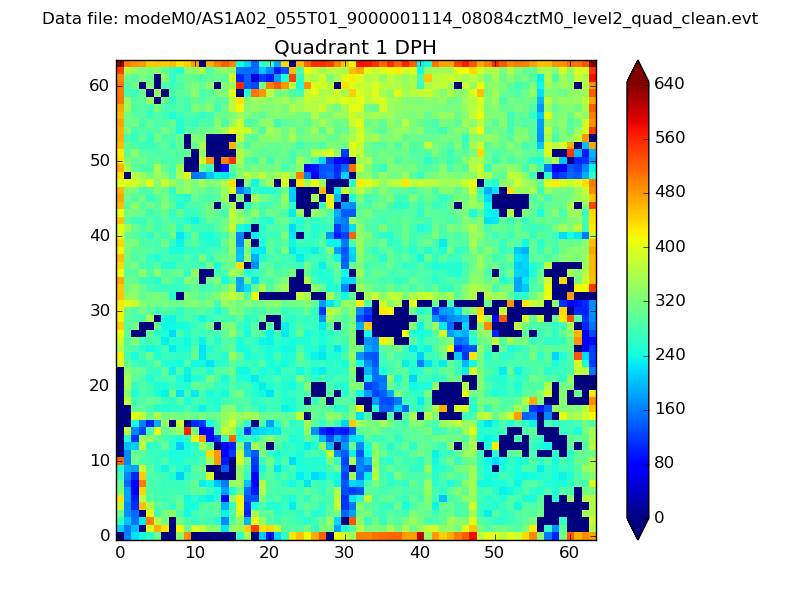 |
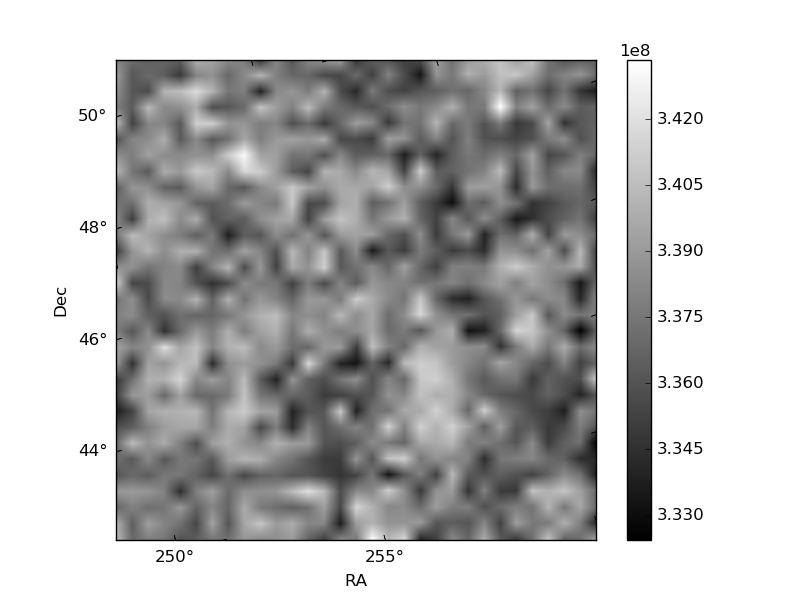
Quadrant B |
|---|---|---|---|
| Quadrant D | 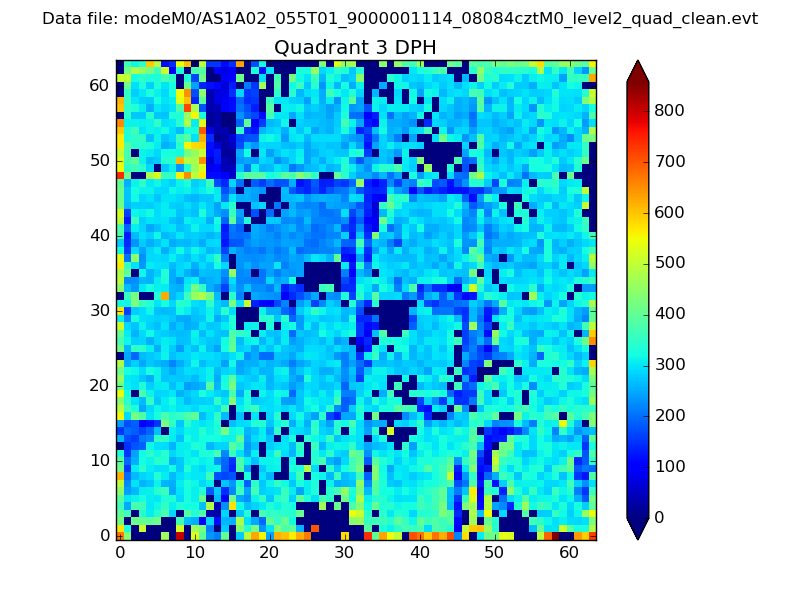 |
 |
Quadrant C |
| Plot type | Count rate plots | Images |
|---|---|---|
| Comparison with Poisson distribution Blue bars denote a histogram of data divided into 1 sec bins. Red curve is a Poisson curve with rate = median count rate of data. |
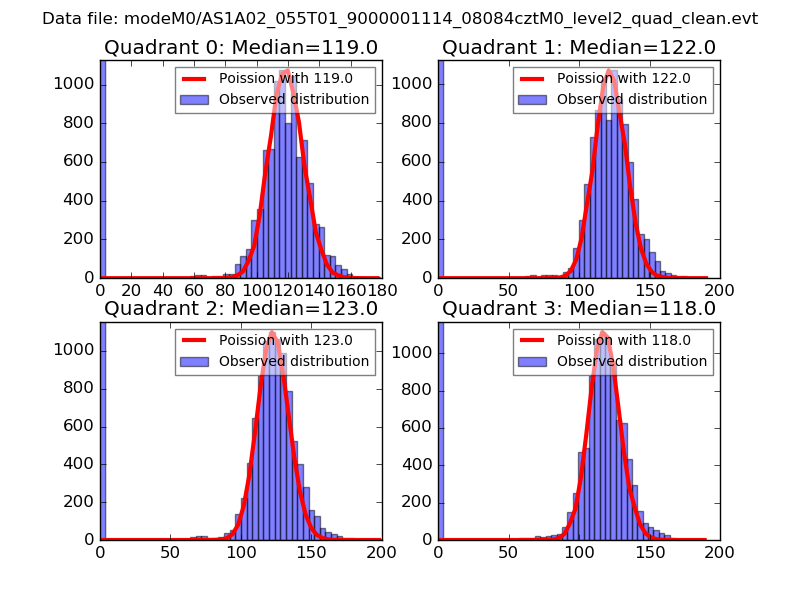 |
 |
| Quadrant-wise count rates Data is divided into 100 sec bins |
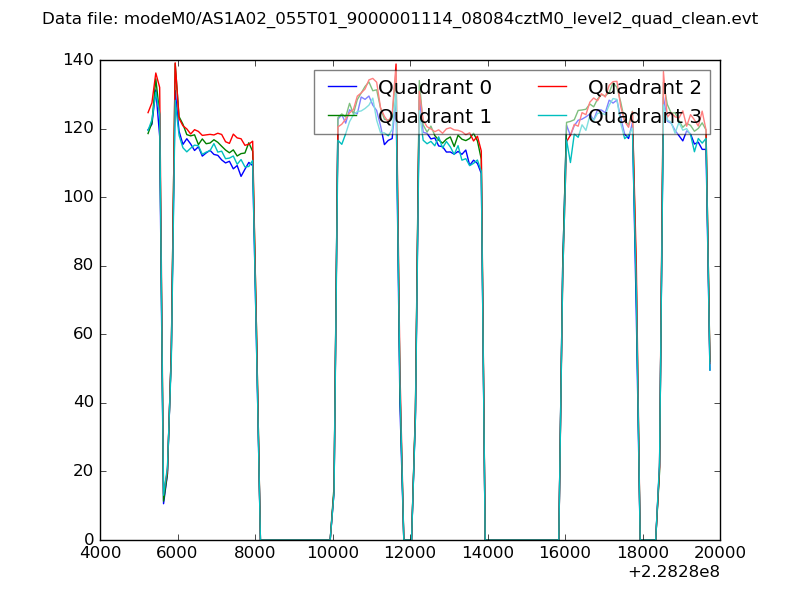 |
|
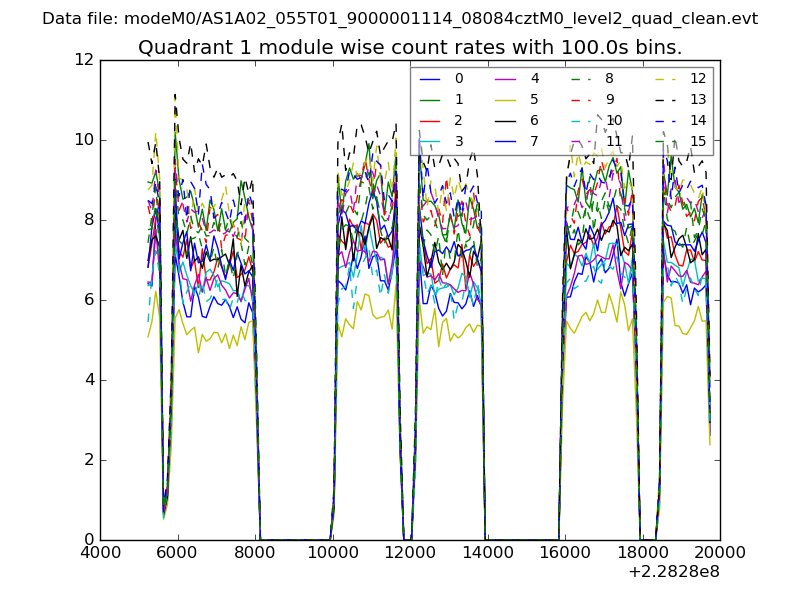
| Module-wise count rates for Quadrant A Data is divided into 100 sec bins |
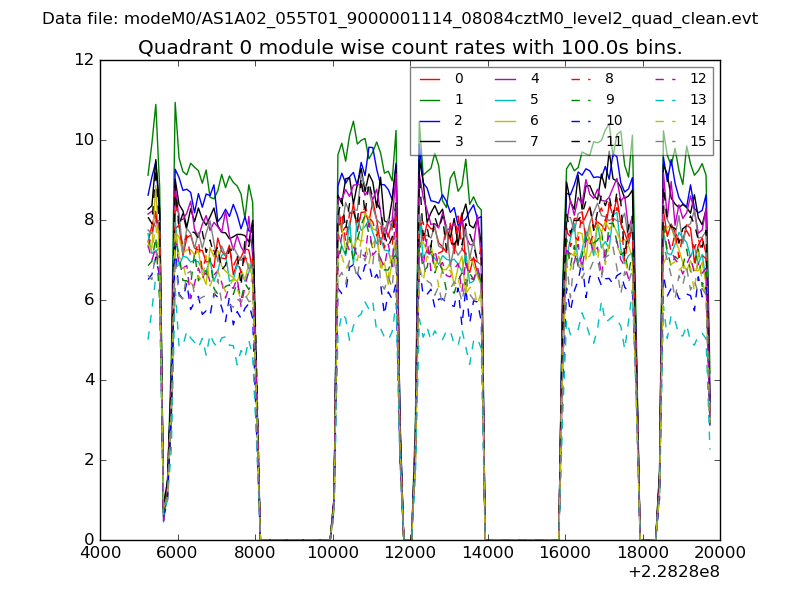 |
 |
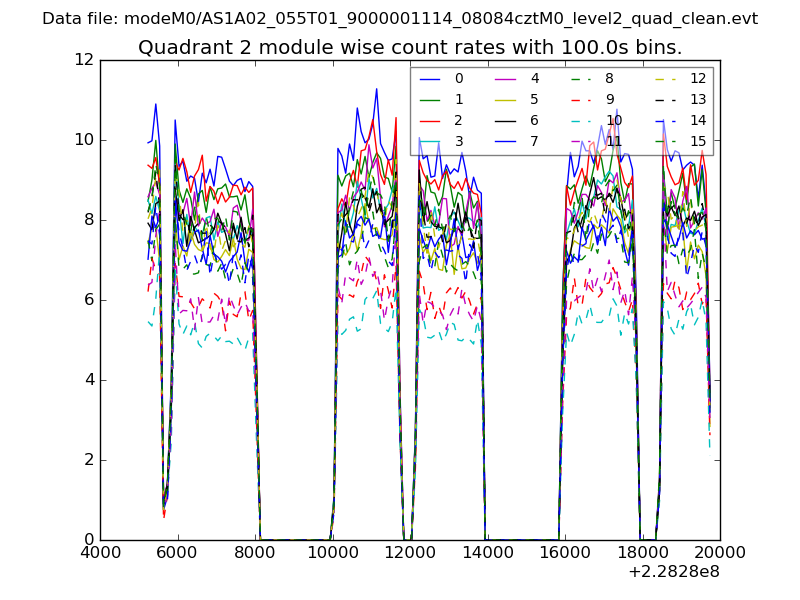
| Module-wise count rates for Quadrant B Data is divided into 100 sec bins |
 |
 |
| Module-wise count rates for Quadrant C Data is divided into 100 sec bins |
 |
 |
| Module-wise count rates for Quadrant D Data is divided into 100 sec bins |
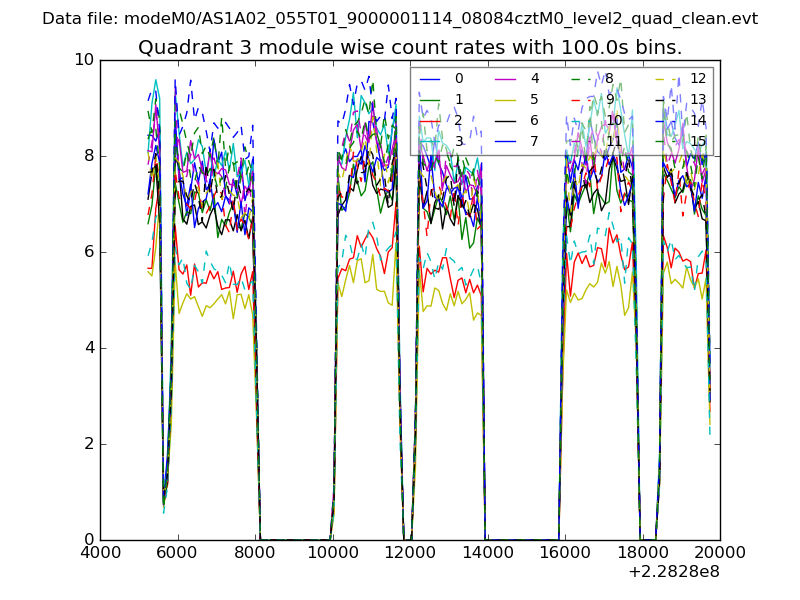 |
 |
| Parameter | Plot |
|---|---|
| CZT HV Monitor | 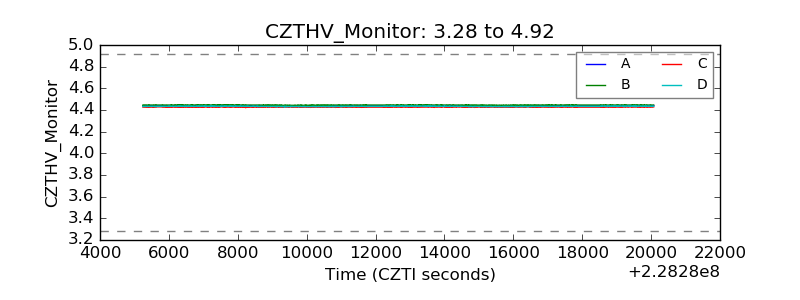 |
| D_VDD | 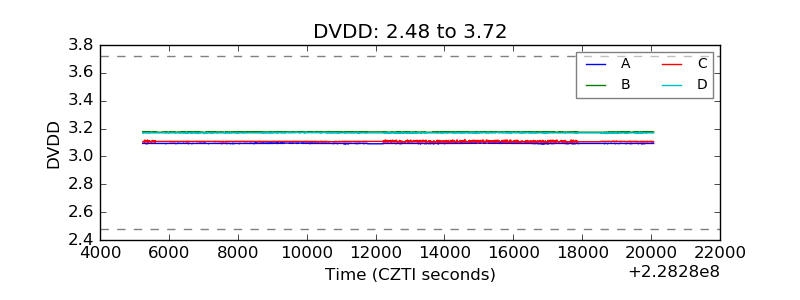 |
| Temperature 1 | 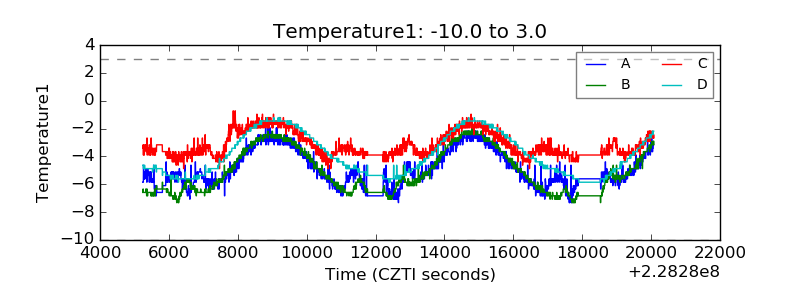 |
| Veto HV Monitor | 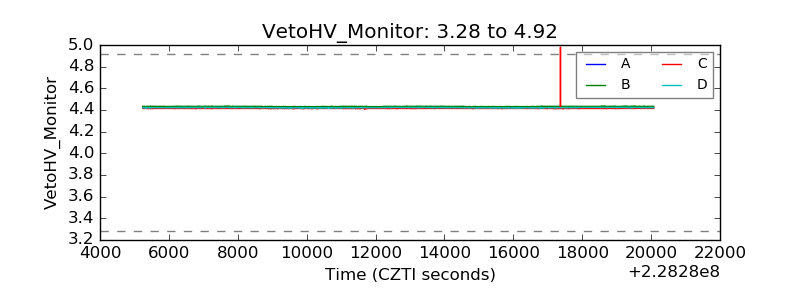 |
| Veto LLD | 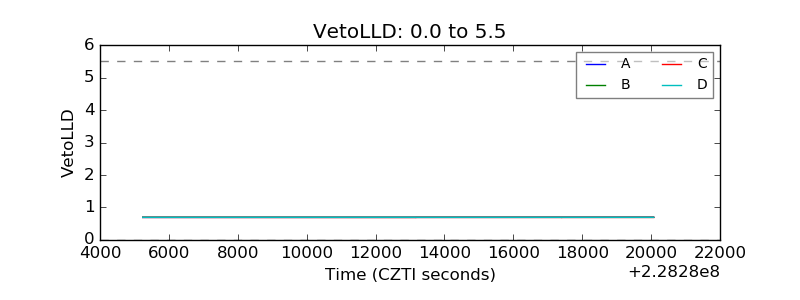 |
| Alpha Counter | 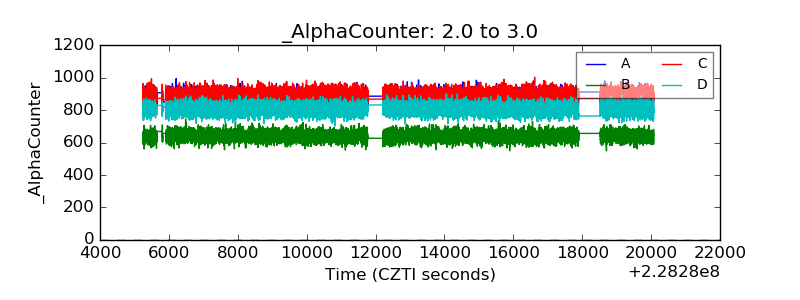 |
| _CPM_Rate | 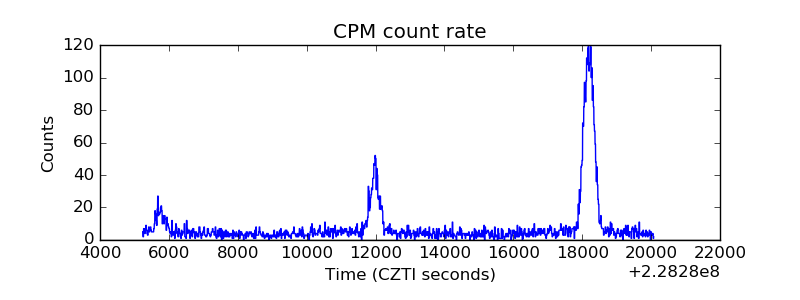 |
| CZT Counter | 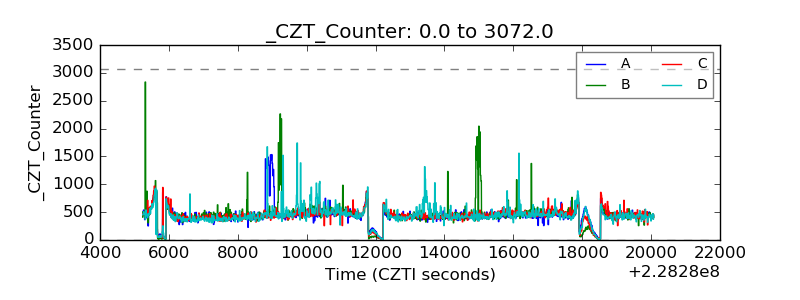 |
| +2.5 Volts monitor |  |
| +5 Volts monitor |  |
| _ROLL_ROT | 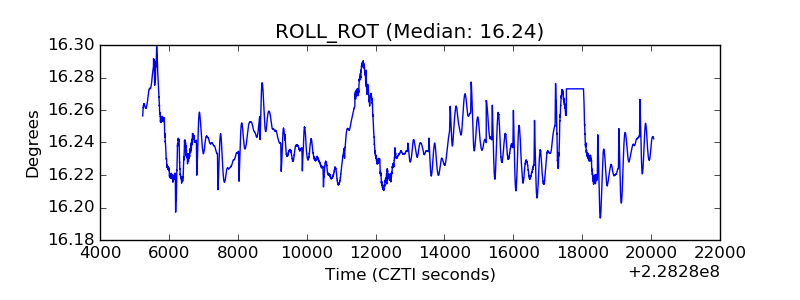 |
| _Roll_DEC | 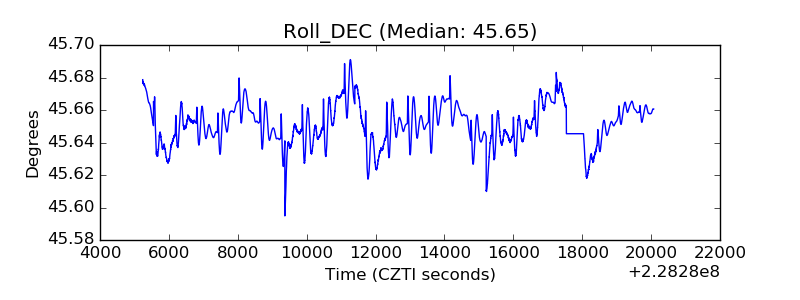 |
| _Roll_RA | 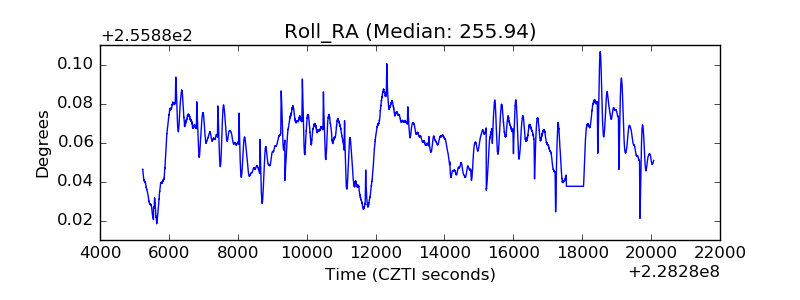 |
| Veto Counter | 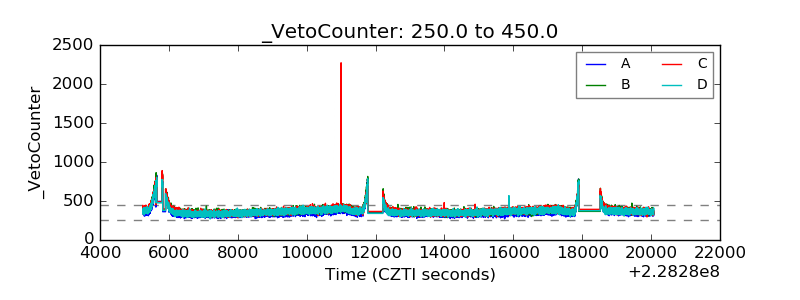 |