| Param | Original file | Final file |
|---|---|---|
| Filename | modeM0/AS1A02_055T01_9000001114_08086cztM0_level2.evt | modeM0/AS1A02_055T01_9000001114_08086cztM0_level2_quad_clean.evt |
| Size (bytes) | 448,427,520 | 79,159,680 |
| Size | 427.7 MB | 75.5 MB |
| Events in quadrant A | 3,163,834 | 482,790 |
| Events in quadrant B | 3,407,193 | 480,490 |
| Events in quadrant C | 3,171,234 | 485,833 |
| Events in quadrant D | 3,379,597 | 477,620 |
| Mode M0 | |||
|---|---|---|---|
| Quadrant | BADHDUFLAG | Total packets | Discarded packets |
| A | 0 | 13843 | 3 |
| B | 0 | 14367 | 2 |
| C | 0 | 13889 | 2 |
| D | 0 | 14518 | 2 |
| Mode M9 | |||
|---|---|---|---|
| Quadrant | BADHDUFLAG | Total packets | Discarded packets |
| A | 0 | 13 | 0 |
| B | 0 | 13 | 0 |
| C | 0 | 13 | 0 |
| D | 0 | 14 | 0 |
| Mode SS | |||
|---|---|---|---|
| Quadrant | BADHDUFLAG | Total packets | Discarded packets |
| A | 0 | 136 | 0 |
| B | 0 | 136 | 0 |
| C | 0 | 136 | 0 |
| D | 0 | 136 | 0 |
| Quadrant | Total seconds | Saturated seconds | Saturation percentage |
|---|---|---|---|
| A | 6751 | 63 | 0.933195% |
| B | 6751 | 95 | 1.407199% |
| C | 6751 | 46 | 0.681381% |
| D | 6751 | 56 | 0.829507% |
Noise dominated data is calculated using 1-second bins in cleaned event files. If a bin has >2000 counts, and if more than 50% of those come from <1% of pixels, then it is considered to be noise-dominated and hence unusable.
| Quadrant | # 1 sec bins | Bins with >0 counts | Bins with >2000 counts | High rate bins dominated by noise | Noise dominated (total time) | Noise dominated (detector-on time) | Marked lightcurve |
|---|---|---|---|---|---|---|---|
| A | 7716 | 6752 | 0 | 0 | 0.00% | 0.00% | 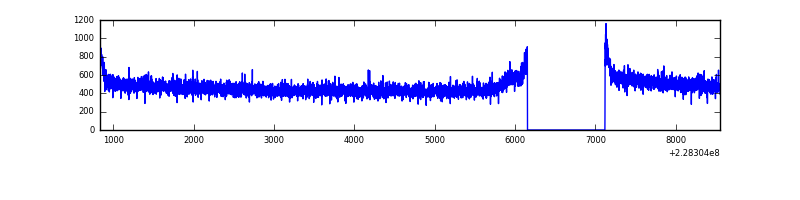 |
| B | 7716 | 6752 | 15 | 15 | 0.19% | 0.22% | 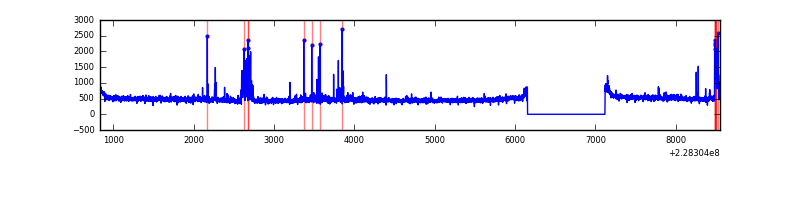 |
| C | 7716 | 6752 | 2 | 2 | 0.03% | 0.03% | 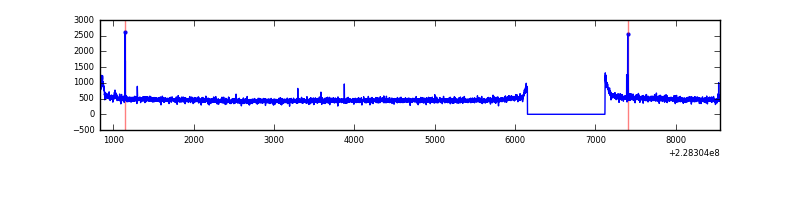 |
| D | 7716 | 6752 | 7 | 7 | 0.09% | 0.10% | 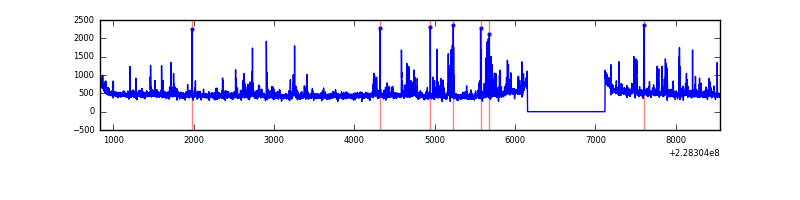 |
Top three noisy pixels from each quadrant. If the there are fewer than three noisy pixels in the level2.evt file, extra rows are filled as -1
| Pixel properties | Quadrant properties | ||||||
|---|---|---|---|---|---|---|---|
| Quadrant | DetID | PixID | Counts | Sigma | Mean | Median | Sigma |
| A | 0 | 226 | 7830 | 41.72 | 822 | 802 | 168.5 |
| A | 12 | 194 | 7412 | 39.24 | 822 | 802 | 168.5 |
| A | 3 | 137 | 3085 | 13.55 | 822 | 802 | 168.5 |
| B | 0 | 231 | 137936 | 869.36 | 819 | 798 | 157.7 |
| B | 11 | 51 | 44742 | 278.57 | 819 | 798 | 157.7 |
| B | 10 | 16 | 20284 | 123.53 | 819 | 798 | 157.7 |
| C | 1 | 16 | 49873 | 265.53 | 795 | 796 | 184.8 |
| C | 9 | 68 | 10299 | 51.42 | 795 | 796 | 184.8 |
| C | 1 | 3 | 9086 | 44.85 | 795 | 796 | 184.8 |
| D | 1 | 52 | 269037 | 1323.87 | 796 | 776 | 202.6 |
| D | 2 | 33 | 42529 | 206.05 | 796 | 776 | 202.6 |
| D | 2 | 234 | 23061 | 109.98 | 796 | 776 | 202.6 |
Histogram calculated using DETX and DETY for each event in the final _common_clean file
| Quadrant A | 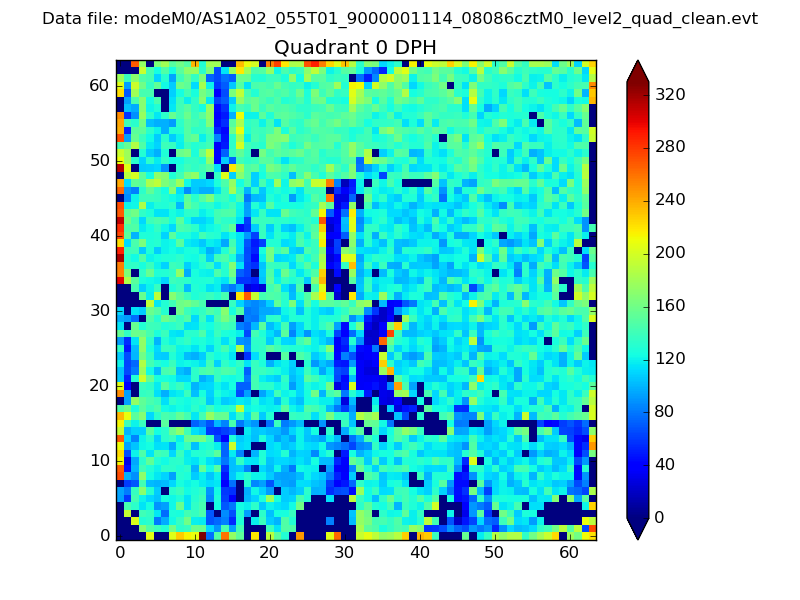 |
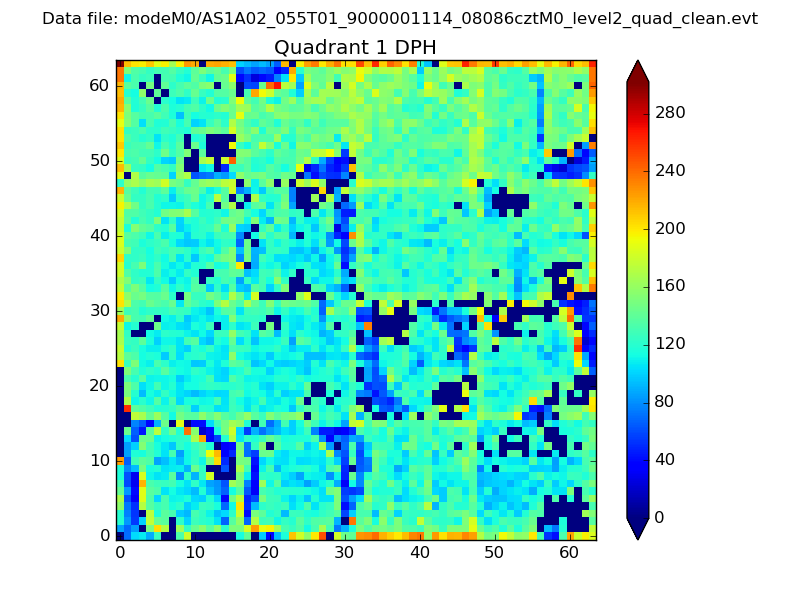 |
Quadrant B |
|---|---|---|---|
| Quadrant D | 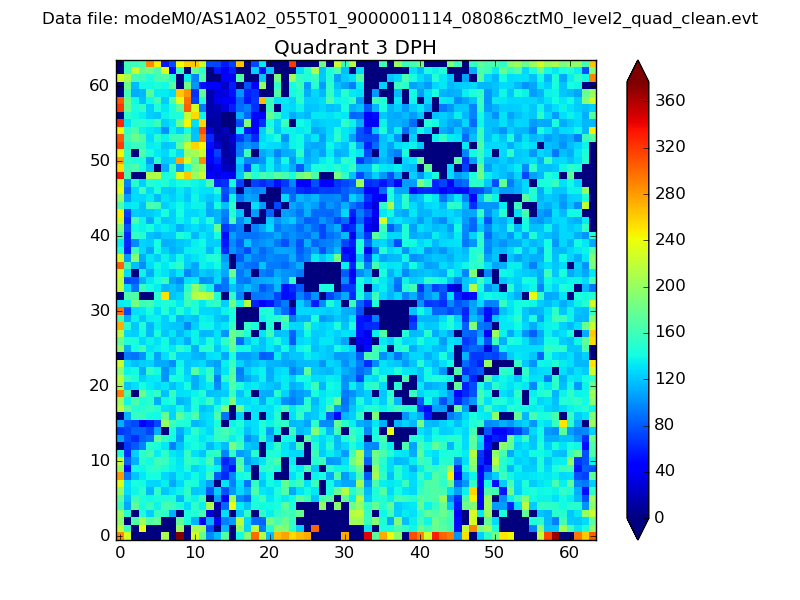 |
 |
Quadrant C |
| Plot type | Count rate plots | Images |
|---|---|---|
| Comparison with Poisson distribution Blue bars denote a histogram of data divided into 1 sec bins. Red curve is a Poisson curve with rate = median count rate of data. |
 |
 |
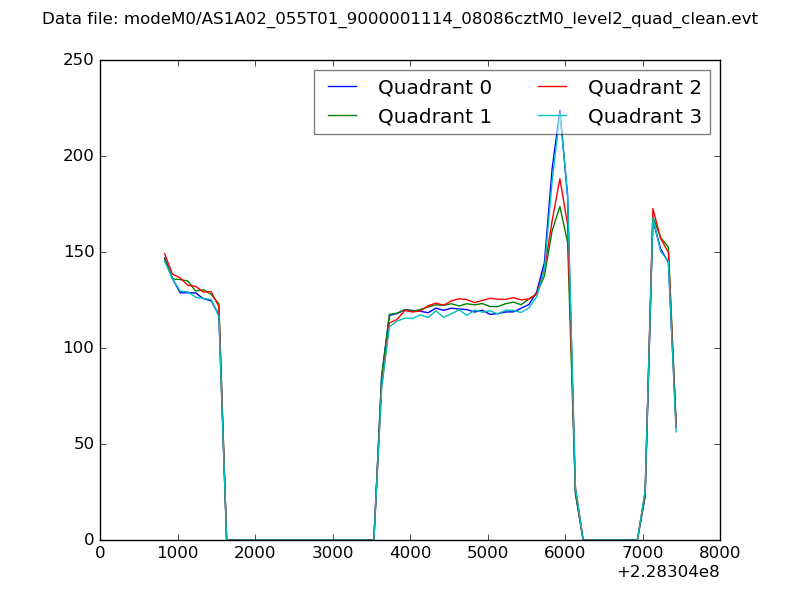
| Quadrant-wise count rates Data is divided into 100 sec bins |
 |
|
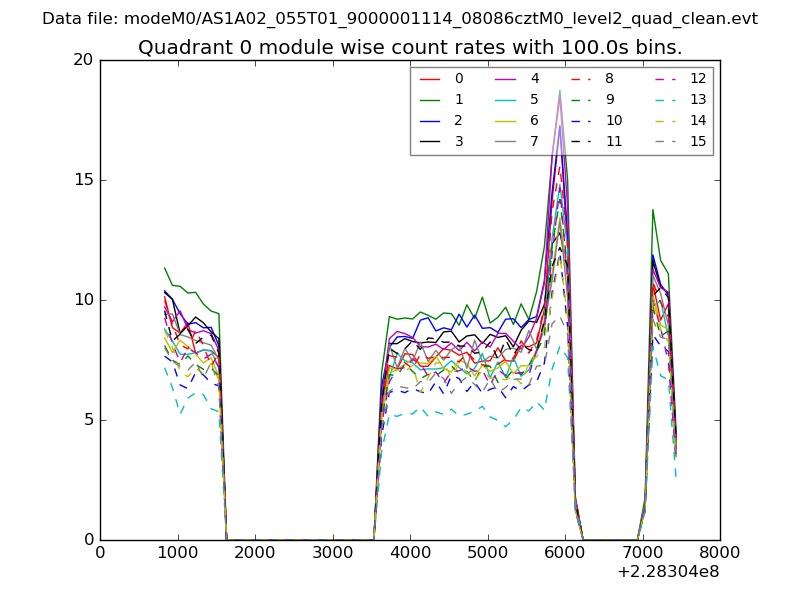
| Module-wise count rates for Quadrant A Data is divided into 100 sec bins |
 |
 |
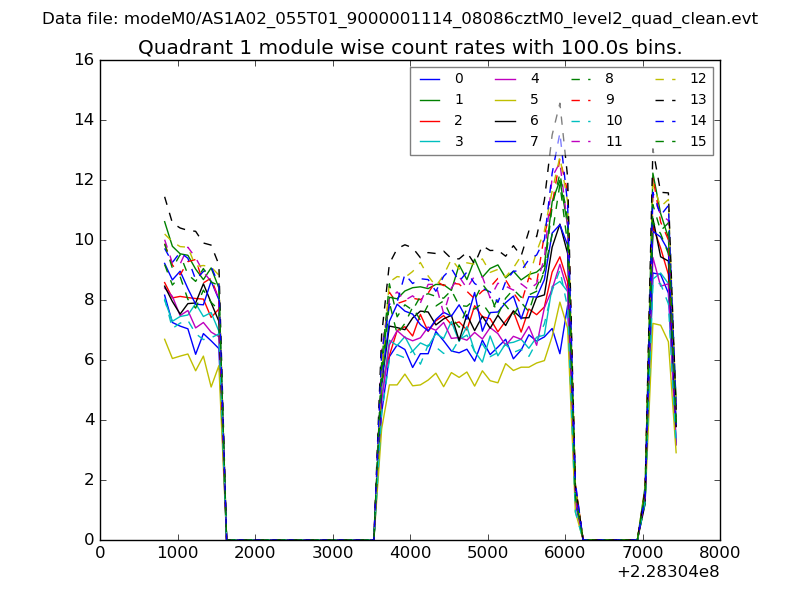
| Module-wise count rates for Quadrant B Data is divided into 100 sec bins |
 |
 |
| Module-wise count rates for Quadrant C Data is divided into 100 sec bins |
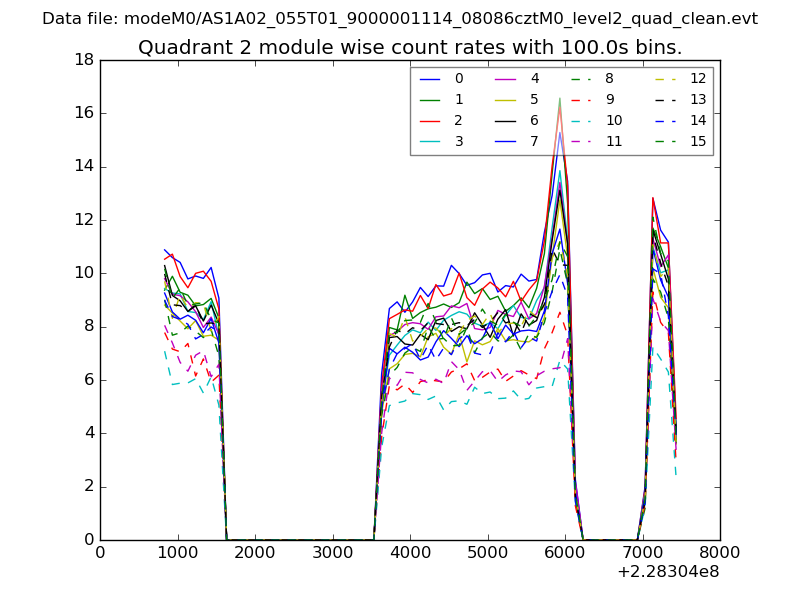 |
 |
| Module-wise count rates for Quadrant D Data is divided into 100 sec bins |
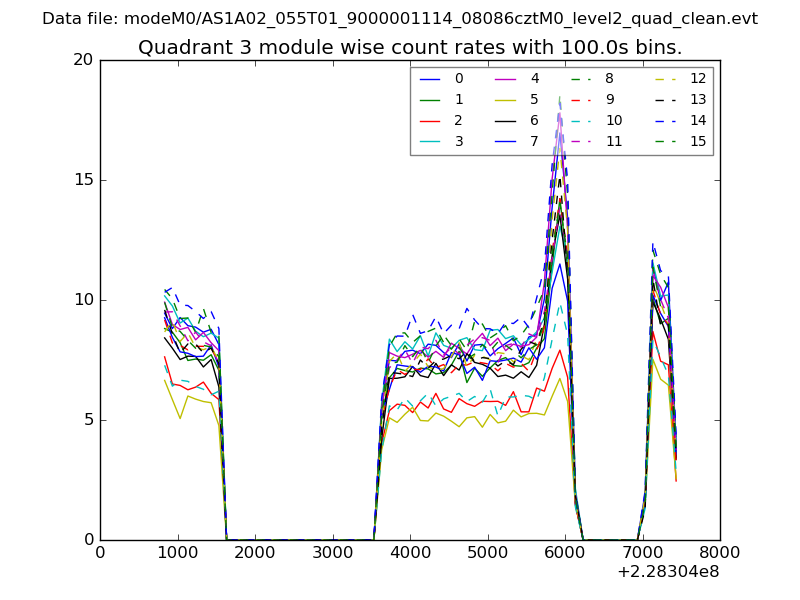 |
 |
| Parameter | Plot |
|---|---|
| CZT HV Monitor | 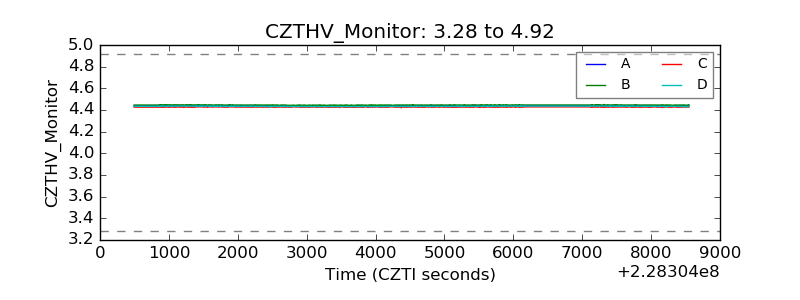 |
| D_VDD | 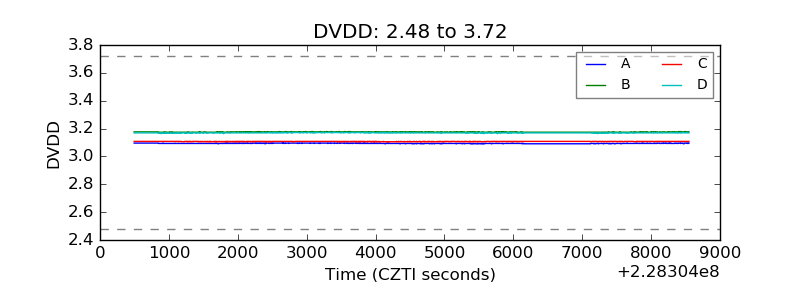 |
| Temperature 1 | 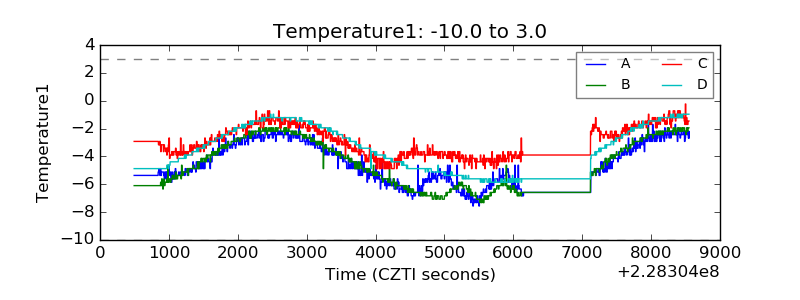 |
| Veto HV Monitor | 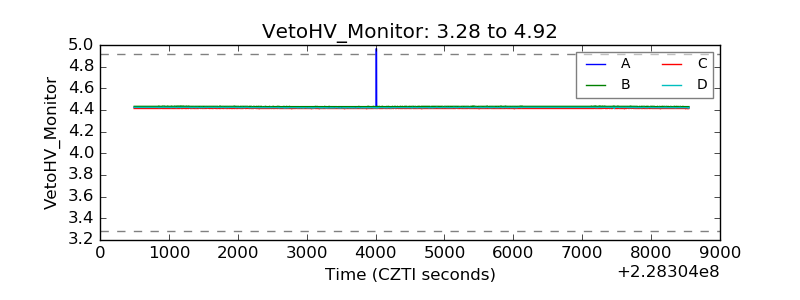 |
| Veto LLD | 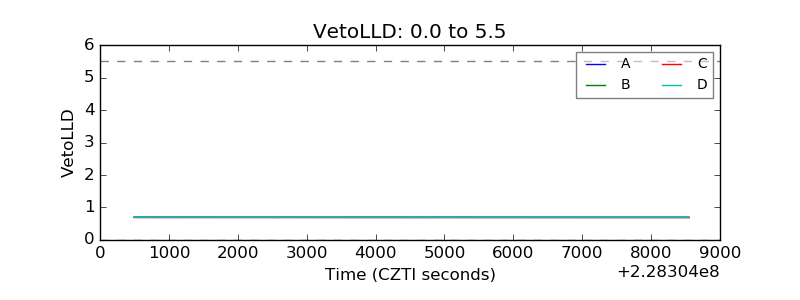 |
| Alpha Counter | 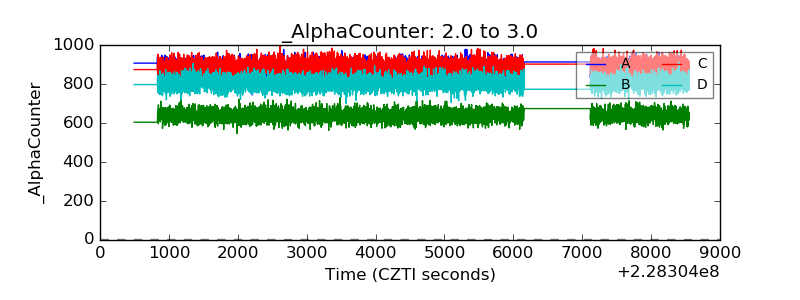 |
| _CPM_Rate | 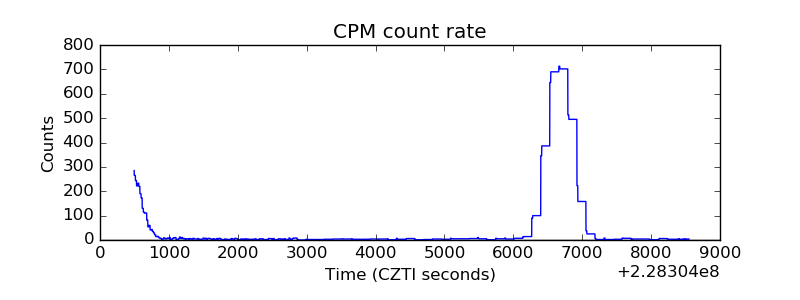 |
| CZT Counter | 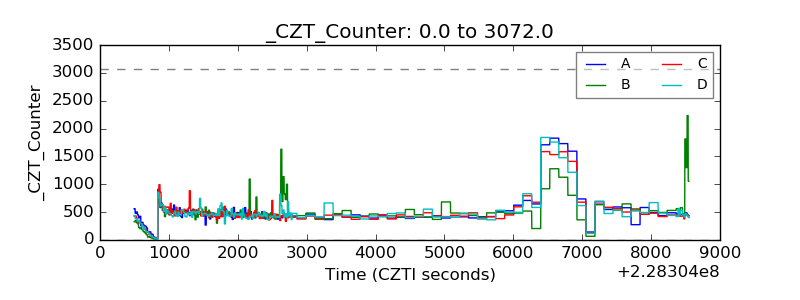 |
| +2.5 Volts monitor |  |
| +5 Volts monitor |  |
| _ROLL_ROT | 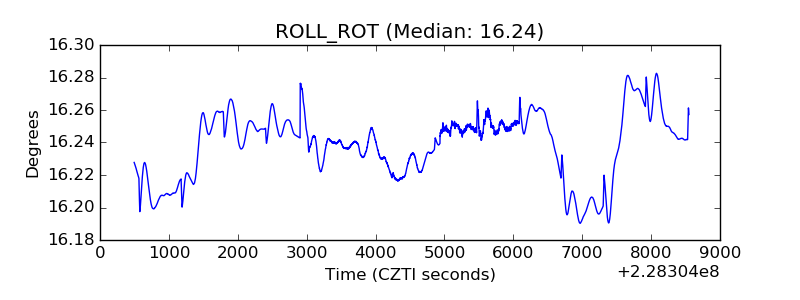 |
| _Roll_DEC | 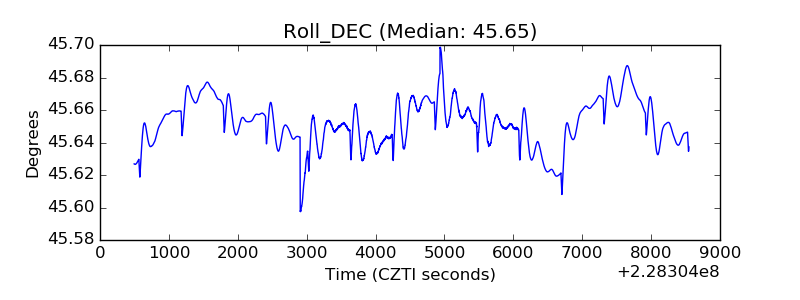 |
| _Roll_RA | 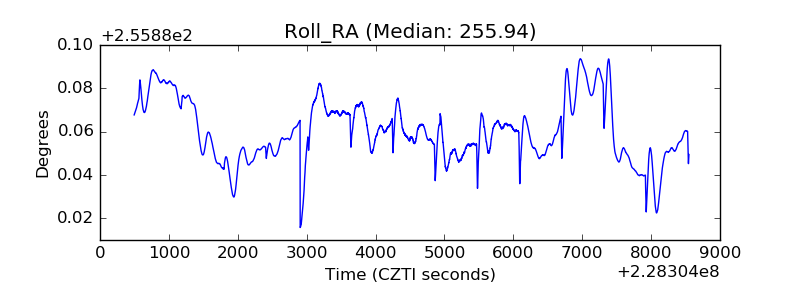 |
| Veto Counter | 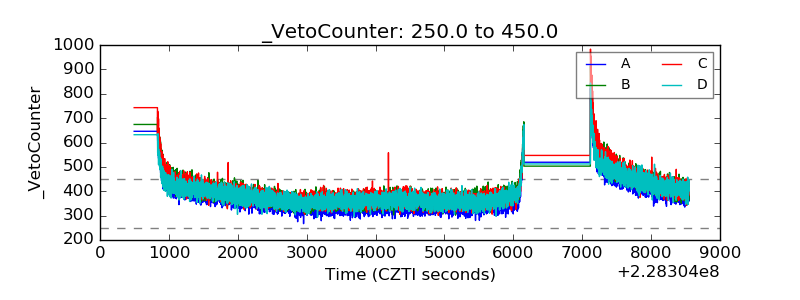 |