| Param | Original file | Final file |
|---|---|---|
| Filename | modeM0/AS1A02_055T01_9000001114_08089cztM0_level2.evt | modeM0/AS1A02_055T01_9000001114_08089cztM0_level2_quad_clean.evt |
| Size (bytes) | 477,642,240 | 68,172,480 |
| Size | 455.5 MB | 65.0 MB |
| Events in quadrant A | 3,267,142 | 400,725 |
| Events in quadrant B | 3,421,197 | 404,715 |
| Events in quadrant C | 3,257,871 | 410,018 |
| Events in quadrant D | 4,080,508 | 397,880 |
| Mode M0 | |||
|---|---|---|---|
| Quadrant | BADHDUFLAG | Total packets | Discarded packets |
| A | 0 | 13996 | 3 |
| B | 0 | 14370 | 2 |
| C | 0 | 13779 | 2 |
| D | 0 | 16580 | 2 |
| Mode M9 | |||
|---|---|---|---|
| Quadrant | BADHDUFLAG | Total packets | Discarded packets |
| A | 0 | 19 | 0 |
| B | 0 | 19 | 0 |
| C | 0 | 19 | 0 |
| D | 0 | 20 | 0 |
| Mode SS | |||
|---|---|---|---|
| Quadrant | BADHDUFLAG | Total packets | Discarded packets |
| A | 0 | 132 | 0 |
| B | 0 | 132 | 0 |
| C | 0 | 132 | 0 |
| D | 0 | 132 | 0 |
| Quadrant | Total seconds | Saturated seconds | Saturation percentage |
|---|---|---|---|
| A | 6457 | 81 | 1.254453% |
| B | 6457 | 90 | 1.393836% |
| C | 6457 | 64 | 0.991172% |
| D | 6457 | 273 | 4.227970% |
Noise dominated data is calculated using 1-second bins in cleaned event files. If a bin has >2000 counts, and if more than 50% of those come from <1% of pixels, then it is considered to be noise-dominated and hence unusable.
| Quadrant | # 1 sec bins | Bins with >0 counts | Bins with >2000 counts | High rate bins dominated by noise | Noise dominated (total time) | Noise dominated (detector-on time) | Marked lightcurve |
|---|---|---|---|---|---|---|---|
| A | 7662 | 6457 | 4 | 4 | 0.05% | 0.06% |  |
| B | 7662 | 6457 | 7 | 7 | 0.09% | 0.11% | 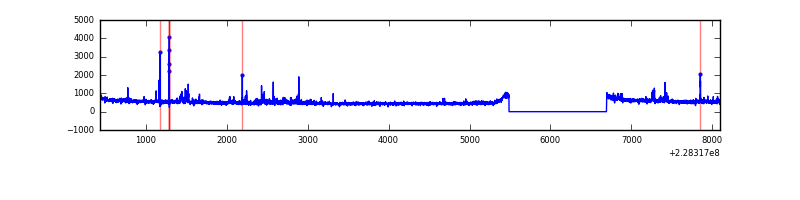 |
| C | 7662 | 6457 | 0 | 0 | 0.00% | 0.00% | 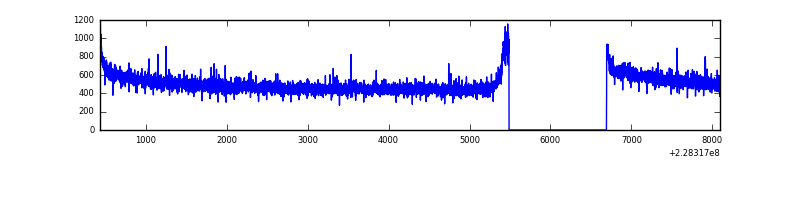 |
| D | 7662 | 6457 | 147 | 147 | 1.92% | 2.28% | 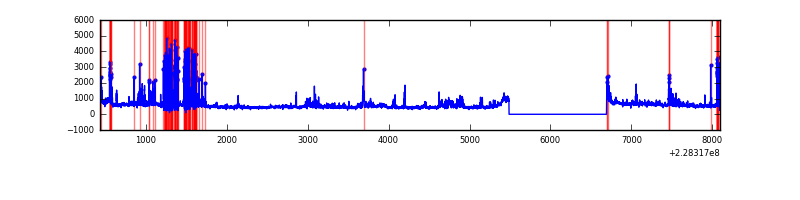 |
Top three noisy pixels from each quadrant. If the there are fewer than three noisy pixels in the level2.evt file, extra rows are filled as -1
| Pixel properties | Quadrant properties | ||||||
|---|---|---|---|---|---|---|---|
| Quadrant | DetID | PixID | Counts | Sigma | Mean | Median | Sigma |
| A | 15 | 223 | 45152 | 263.69 | 834 | 816 | 168.1 |
| A | 13 | 164 | 10901 | 59.98 | 834 | 816 | 168.1 |
| A | 0 | 226 | 8023 | 42.86 | 834 | 816 | 168.1 |
| B | 11 | 51 | 72702 | 457.11 | 835 | 816 | 157.3 |
| B | 0 | 231 | 47387 | 296.13 | 835 | 816 | 157.3 |
| B | 0 | 214 | 36410 | 226.33 | 835 | 816 | 157.3 |
| C | 1 | 16 | 62439 | 329.42 | 817 | 824 | 187.0 |
| C | 13 | 61 | 6277 | 29.15 | 817 | 824 | 187.0 |
| C | 1 | 3 | 3723 | 15.5 | 817 | 824 | 187.0 |
| D | 1 | 52 | 943520 | 4524.92 | 795 | 776 | 208.3 |
| D | 7 | 71 | 84950 | 404.01 | 795 | 776 | 208.3 |
| D | 2 | 234 | 20297 | 93.7 | 795 | 776 | 208.3 |
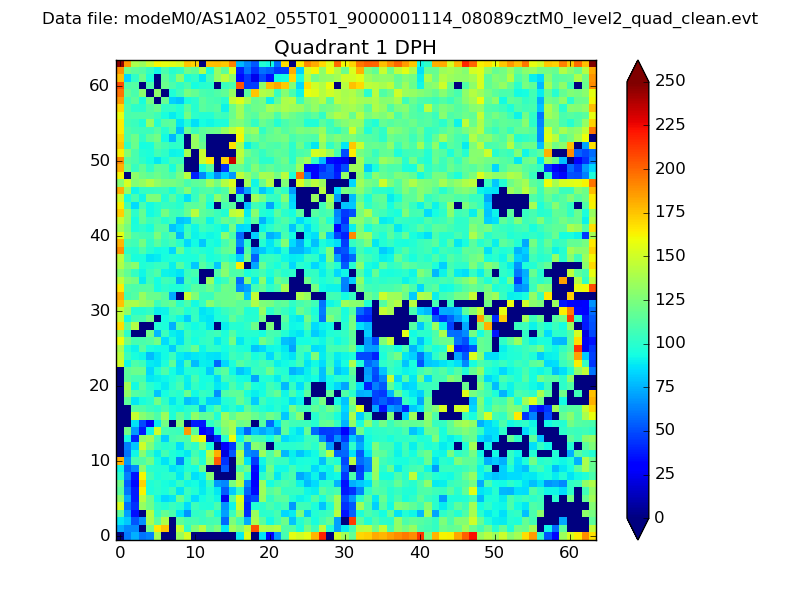
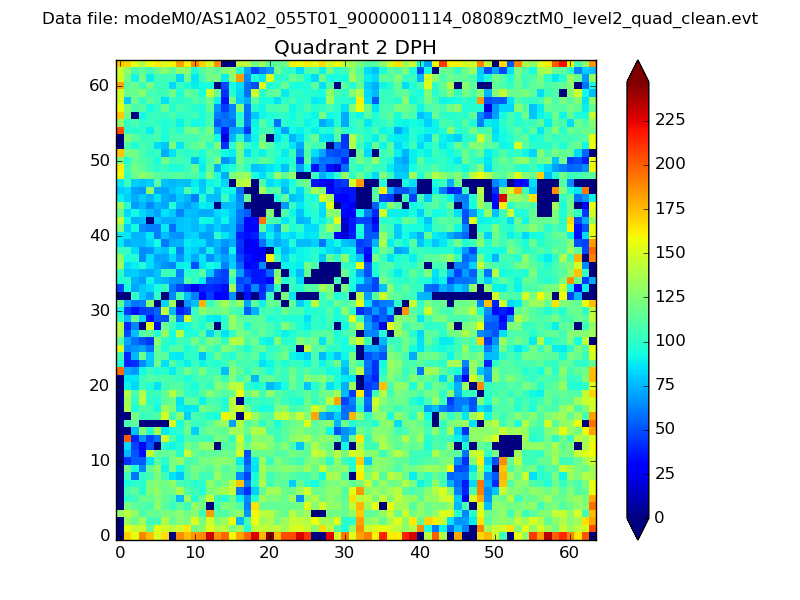
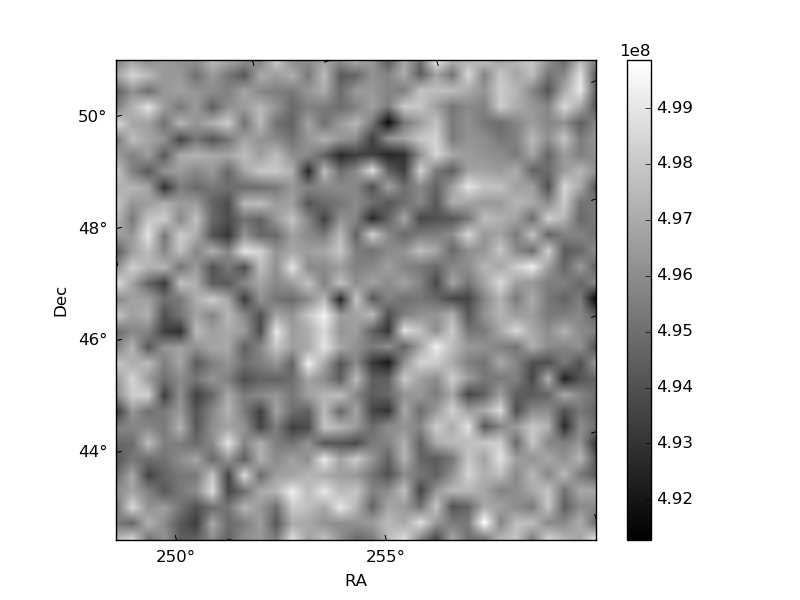
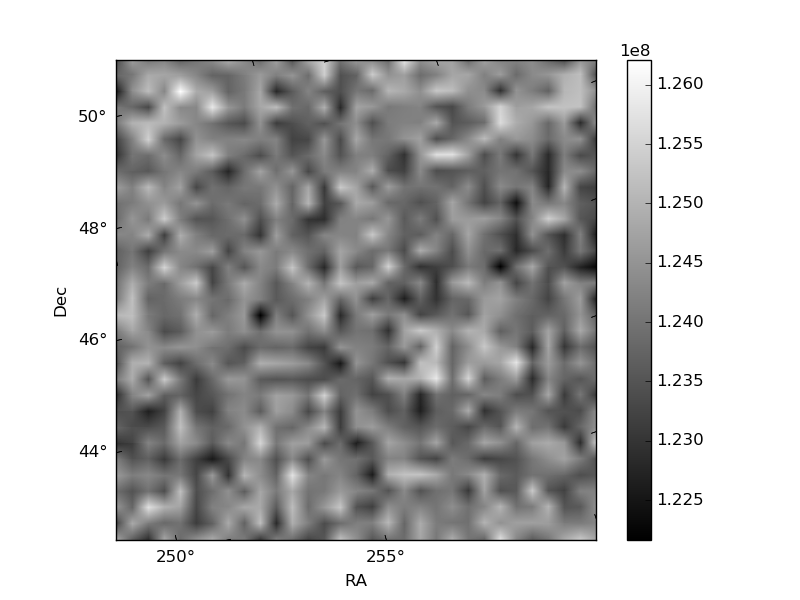
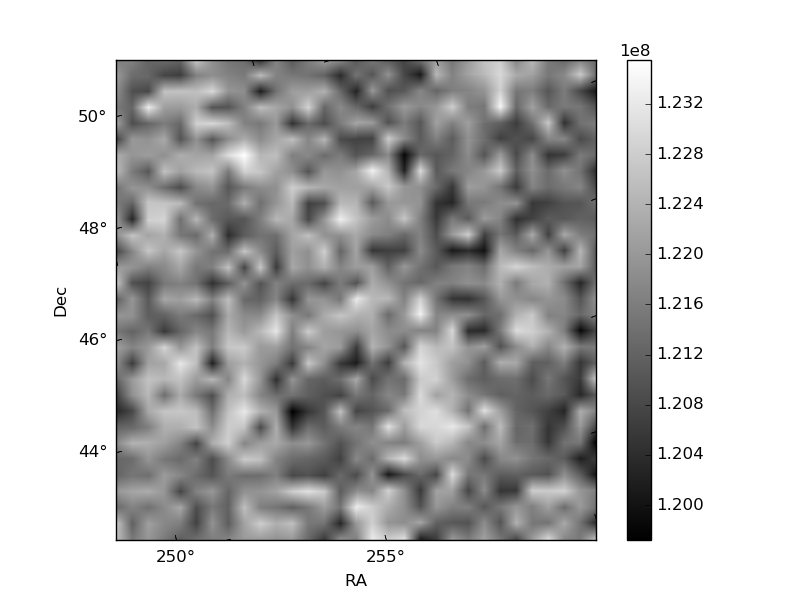
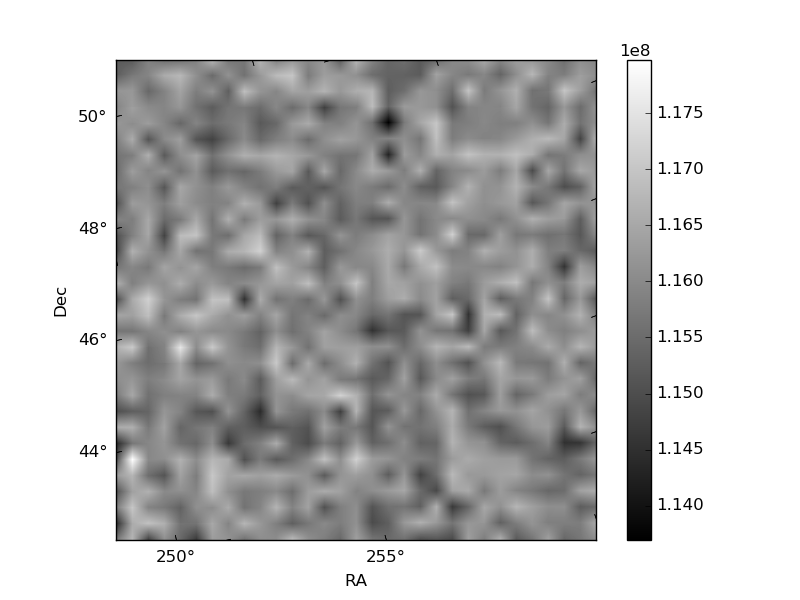
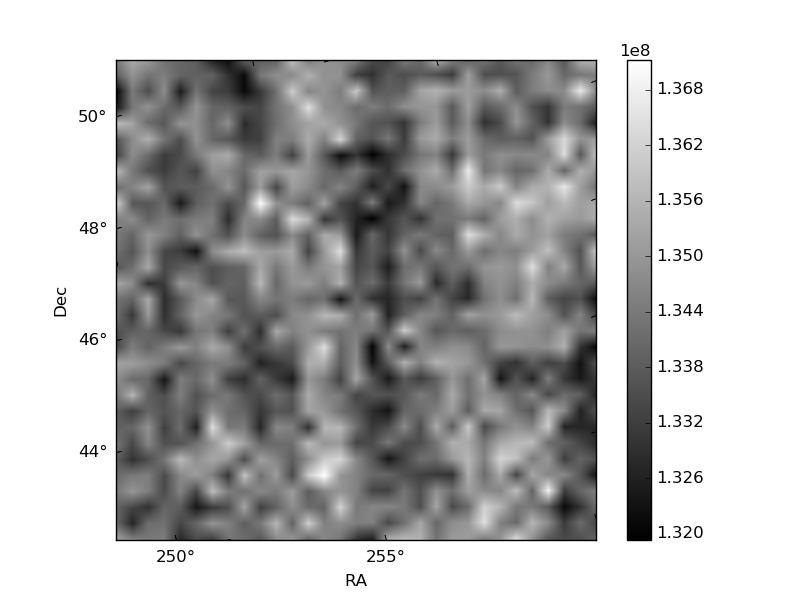
Histogram calculated using DETX and DETY for each event in the final _common_clean file
| Quadrant A | 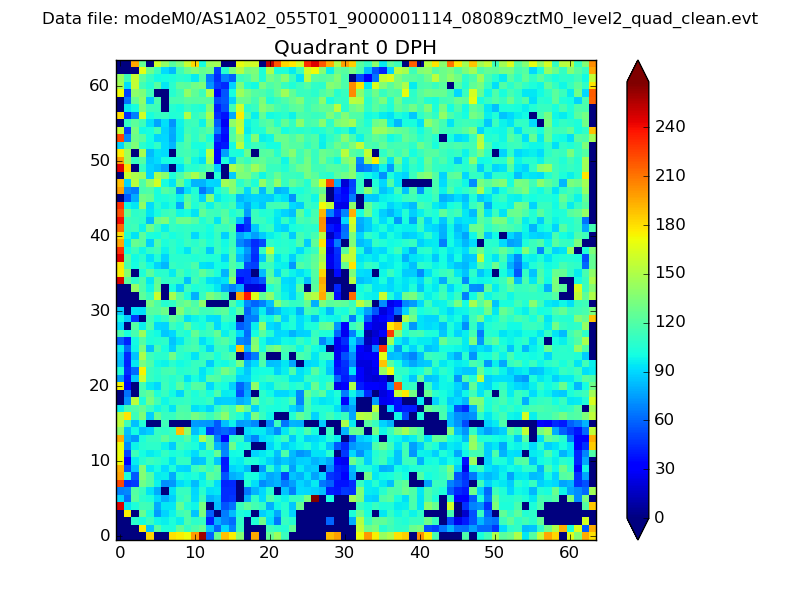 |
 |
Quadrant B |
|---|---|---|---|
| Quadrant D | 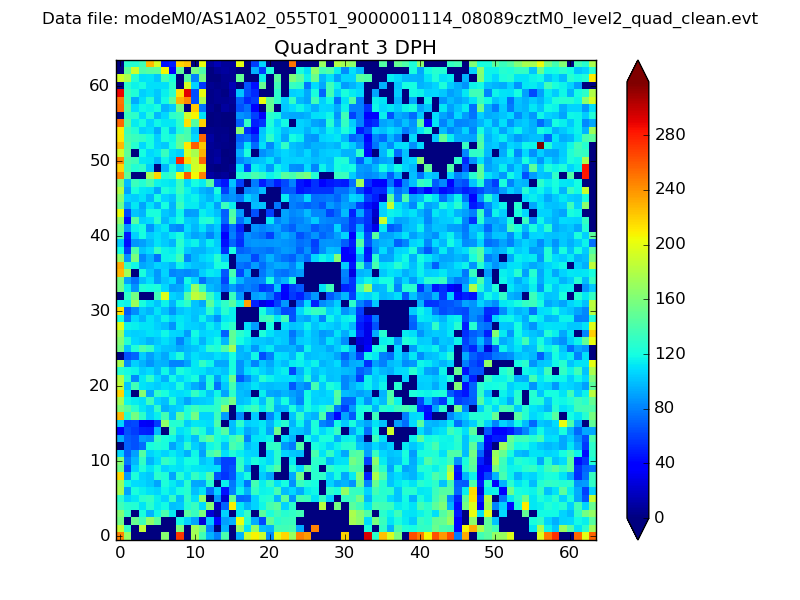 |
 |
Quadrant C |
| Plot type | Count rate plots | Images |
|---|---|---|
| Comparison with Poisson distribution Blue bars denote a histogram of data divided into 1 sec bins. Red curve is a Poisson curve with rate = median count rate of data. |
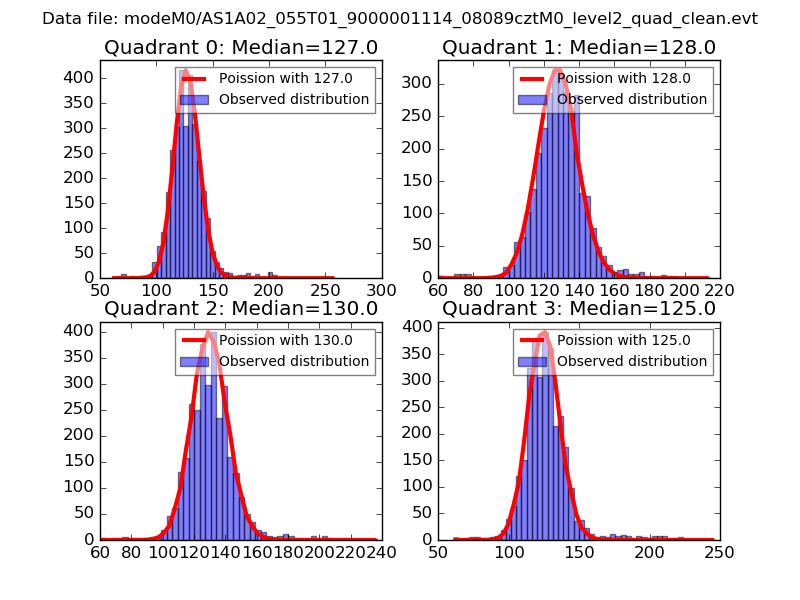 |
 |
| Quadrant-wise count rates Data is divided into 100 sec bins |
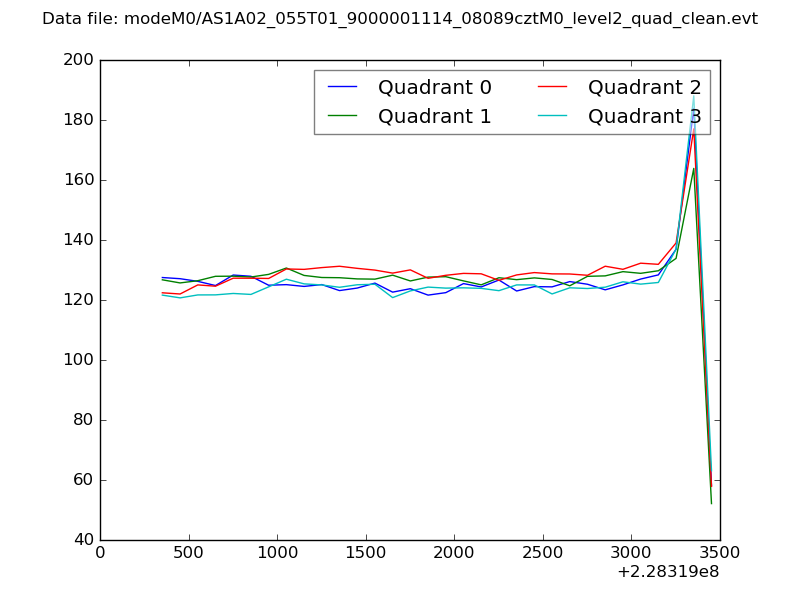 |
|
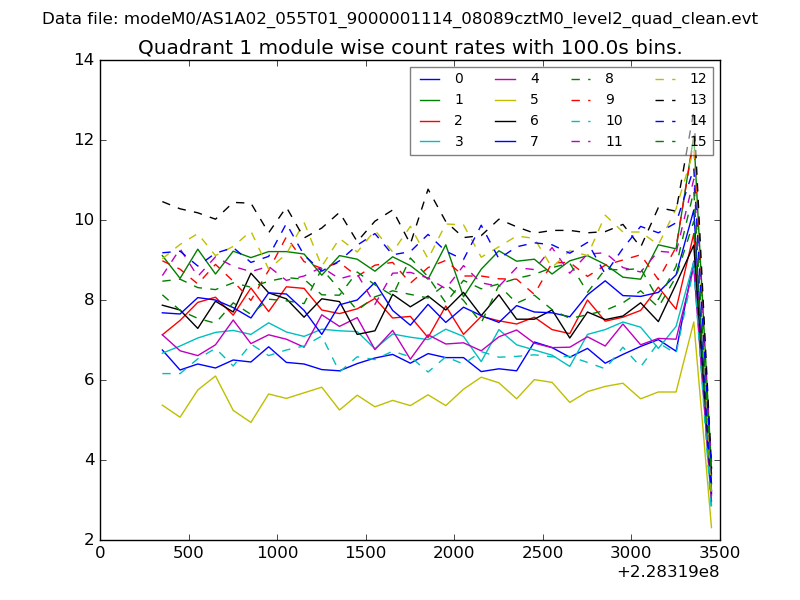
| Module-wise count rates for Quadrant A Data is divided into 100 sec bins |
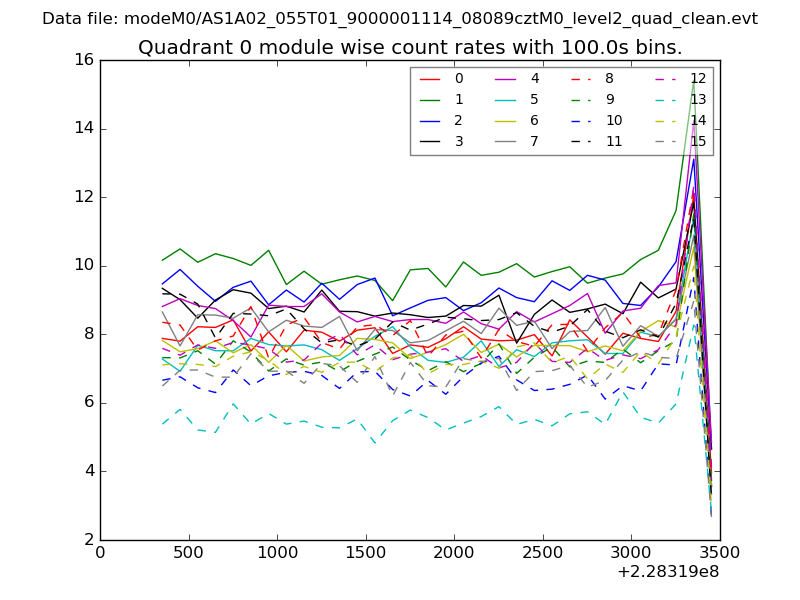 |
 |
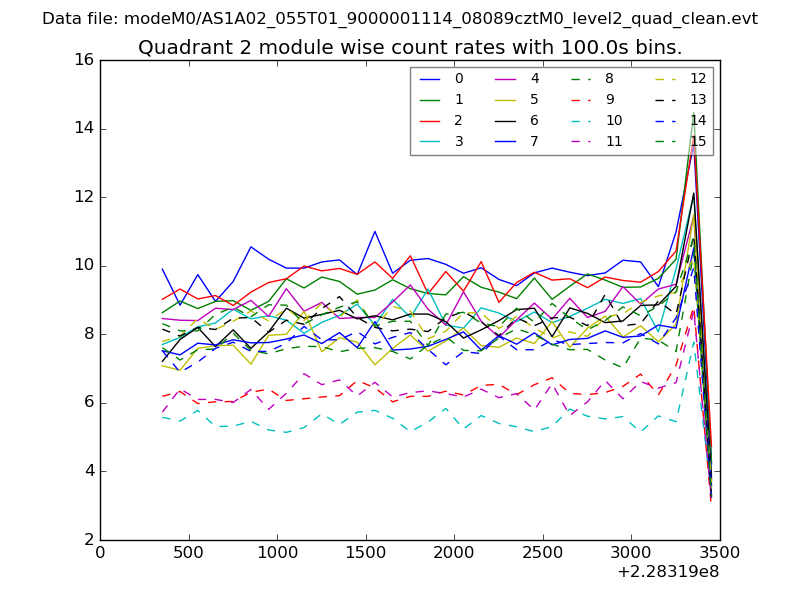
| Module-wise count rates for Quadrant B Data is divided into 100 sec bins |
 |
 |
| Module-wise count rates for Quadrant C Data is divided into 100 sec bins |
 |
 |
| Module-wise count rates for Quadrant D Data is divided into 100 sec bins |
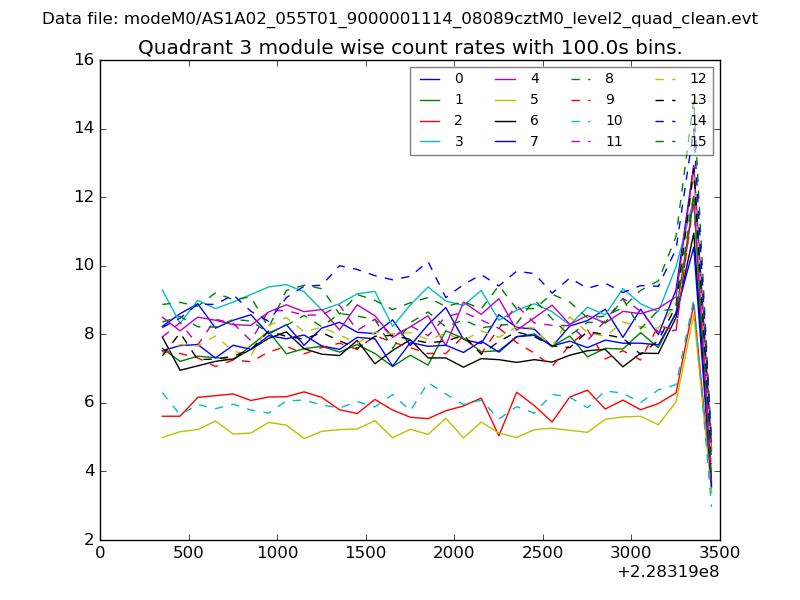 |
 |
| Parameter | Plot |
|---|---|
| CZT HV Monitor | 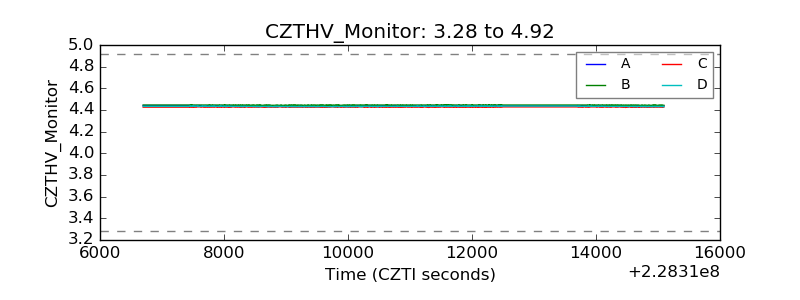 |
| D_VDD | 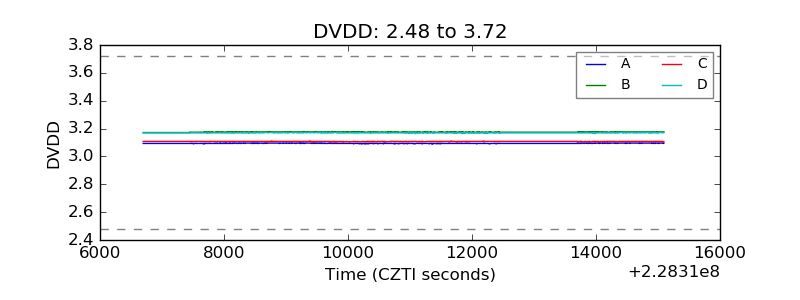 |
| Temperature 1 | 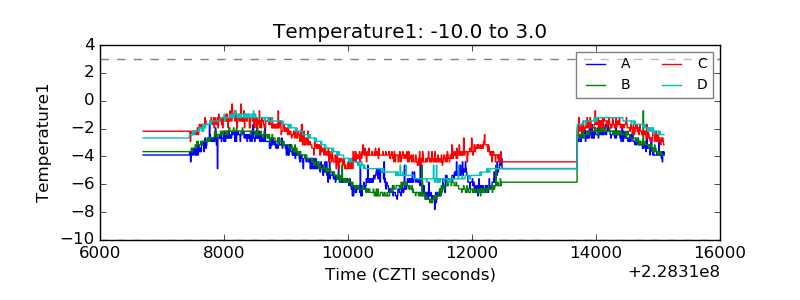 |
| Veto HV Monitor |  |
| Veto LLD | 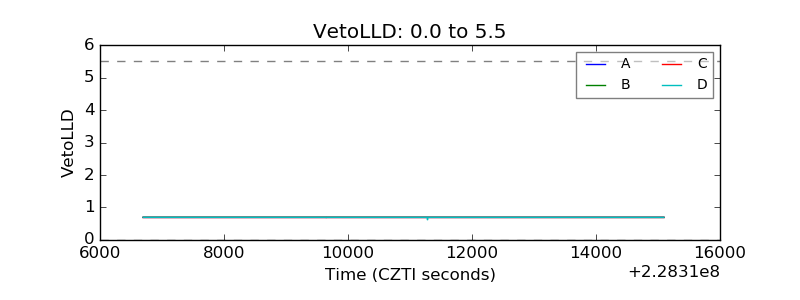 |
| Alpha Counter | 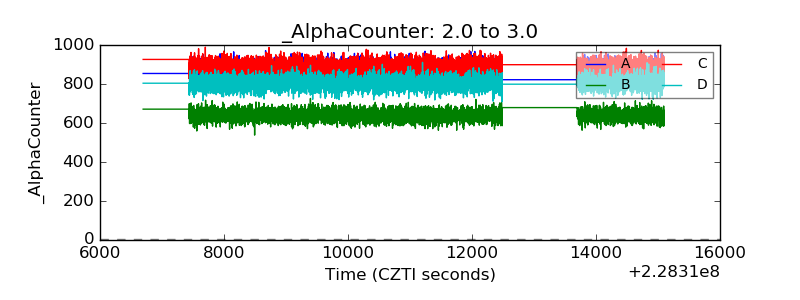 |
| _CPM_Rate | 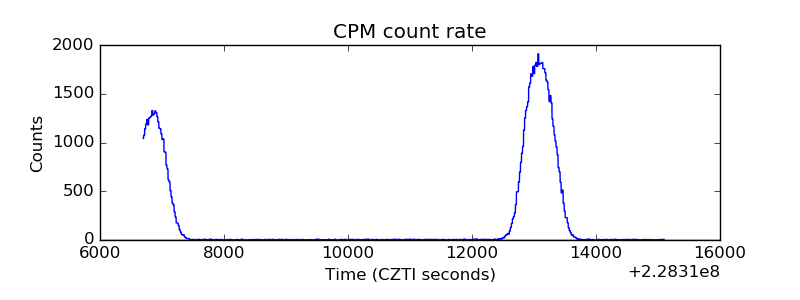 |
| CZT Counter | 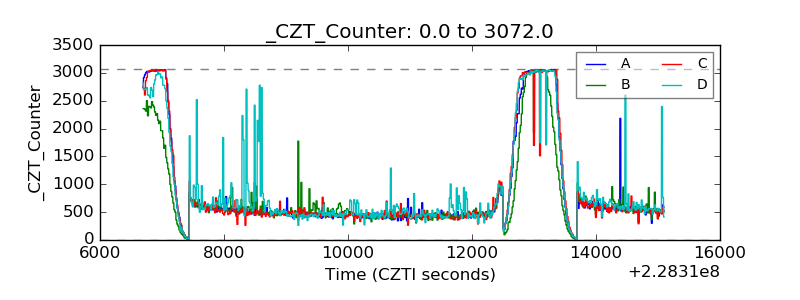 |
| +2.5 Volts monitor |  |
| +5 Volts monitor |  |
| _ROLL_ROT | 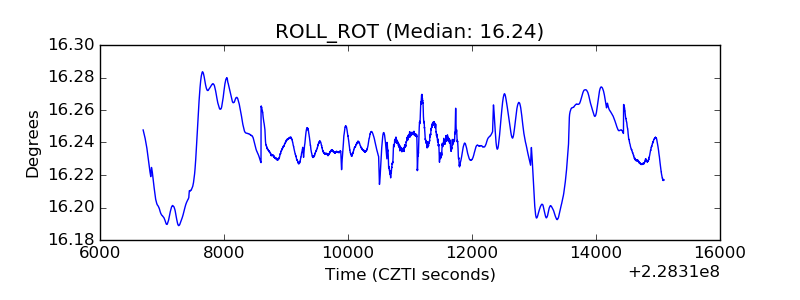 |
| _Roll_DEC | 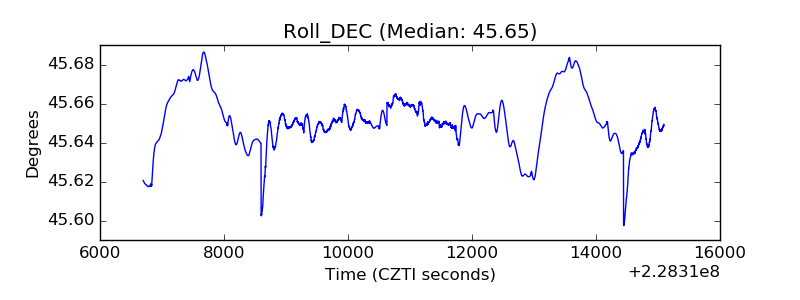 |
| _Roll_RA | 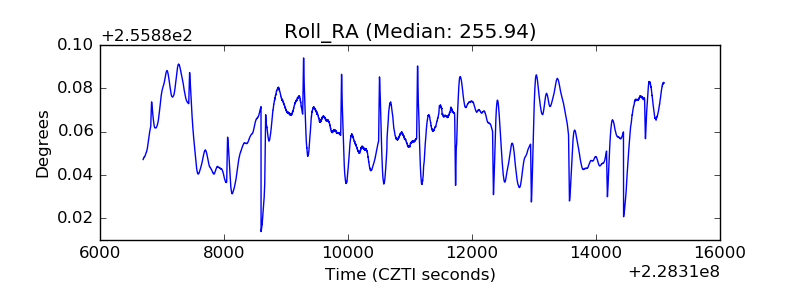 |
| Veto Counter | 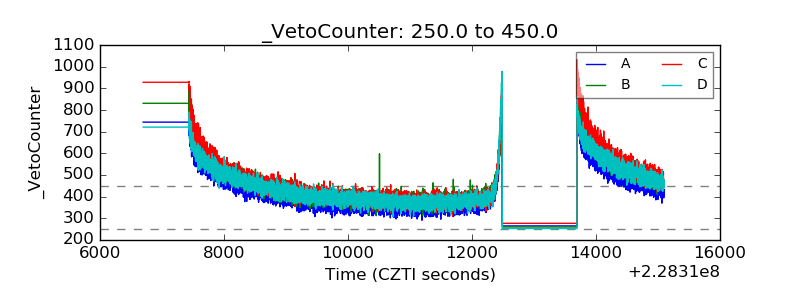 |