| Param | Original file | Final file |
|---|---|---|
| Filename | modeM0/AS1A02_055T01_9000001114_08090cztM0_level2.evt | modeM0/AS1A02_055T01_9000001114_08090cztM0_level2_quad_clean.evt |
| Size (bytes) | 480,286,080 | 76,127,040 |
| Size | 458.0 MB | 72.6 MB |
| Events in quadrant A | 3,167,206 | 467,509 |
| Events in quadrant B | 3,387,670 | 478,865 |
| Events in quadrant C | 3,214,611 | 484,314 |
| Events in quadrant D | 4,356,771 | 443,390 |
| Mode M0 | |||
|---|---|---|---|
| Quadrant | BADHDUFLAG | Total packets | Discarded packets |
| A | 0 | 13458 | 3 |
| B | 0 | 14137 | 2 |
| C | 0 | 13625 | 2 |
| D | 0 | 17162 | 2 |
| Mode M9 | |||
|---|---|---|---|
| Quadrant | BADHDUFLAG | Total packets | Discarded packets |
| A | 0 | 19 | 0 |
| B | 0 | 19 | 0 |
| C | 0 | 19 | 0 |
| D | 0 | 20 | 0 |
| Mode SS | |||
|---|---|---|---|
| Quadrant | BADHDUFLAG | Total packets | Discarded packets |
| A | 0 | 126 | 0 |
| B | 0 | 126 | 0 |
| C | 0 | 126 | 0 |
| D | 0 | 126 | 0 |
| Quadrant | Total seconds | Saturated seconds | Saturation percentage |
|---|---|---|---|
| A | 6173 | 80 | 1.295966% |
| B | 6173 | 102 | 1.652357% |
| C | 6173 | 64 | 1.036773% |
| D | 6173 | 455 | 7.370808% |
Noise dominated data is calculated using 1-second bins in cleaned event files. If a bin has >2000 counts, and if more than 50% of those come from <1% of pixels, then it is considered to be noise-dominated and hence unusable.
| Quadrant | # 1 sec bins | Bins with >0 counts | Bins with >2000 counts | High rate bins dominated by noise | Noise dominated (total time) | Noise dominated (detector-on time) | Marked lightcurve |
|---|---|---|---|---|---|---|---|
| A | 7473 | 6174 | 4 | 4 | 0.05% | 0.06% | 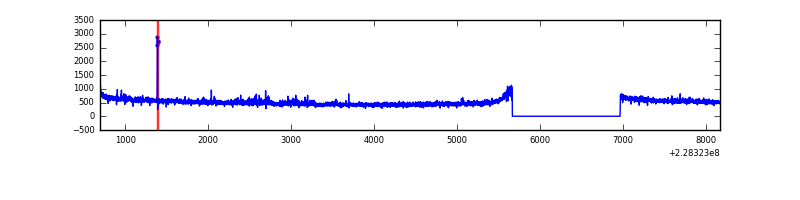 |
| B | 7473 | 6174 | 13 | 13 | 0.17% | 0.21% | 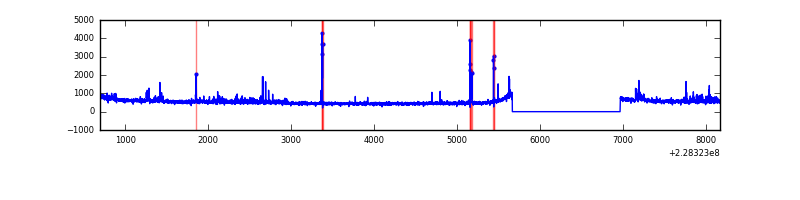 |
| C | 7473 | 6174 | 0 | 0 | 0.00% | 0.00% | 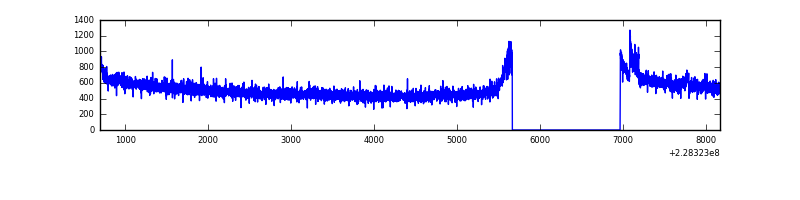 |
| D | 7473 | 6173 | 270 | 270 | 3.61% | 4.37% | 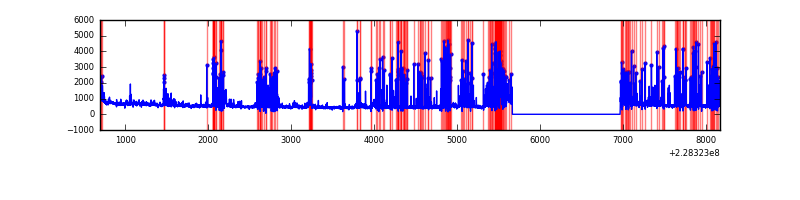 |
Top three noisy pixels from each quadrant. If the there are fewer than three noisy pixels in the level2.evt file, extra rows are filled as -1
| Pixel properties | Quadrant properties | ||||||
|---|---|---|---|---|---|---|---|
| Quadrant | DetID | PixID | Counts | Sigma | Mean | Median | Sigma |
| A | 13 | 164 | 52810 | 321.83 | 804 | 790 | 161.6 |
| A | 15 | 223 | 16743 | 98.7 | 804 | 790 | 161.6 |
| A | 0 | 226 | 7575 | 41.98 | 804 | 790 | 161.6 |
| B | 11 | 51 | 90354 | 590.76 | 811 | 792 | 151.6 |
| B | 10 | 16 | 75400 | 492.12 | 811 | 792 | 151.6 |
| B | 0 | 231 | 46671 | 302.62 | 811 | 792 | 151.6 |
| C | 1 | 16 | 102137 | 555.46 | 796 | 801 | 182.4 |
| C | 13 | 61 | 6153 | 29.34 | 796 | 801 | 182.4 |
| C | 8 | 222 | 3575 | 15.21 | 796 | 801 | 182.4 |
| D | 1 | 52 | 1344783 | 6624.31 | 762 | 746 | 202.9 |
| D | 7 | 71 | 104646 | 512.09 | 762 | 746 | 202.9 |
| D | 2 | 234 | 19407 | 91.97 | 762 | 746 | 202.9 |
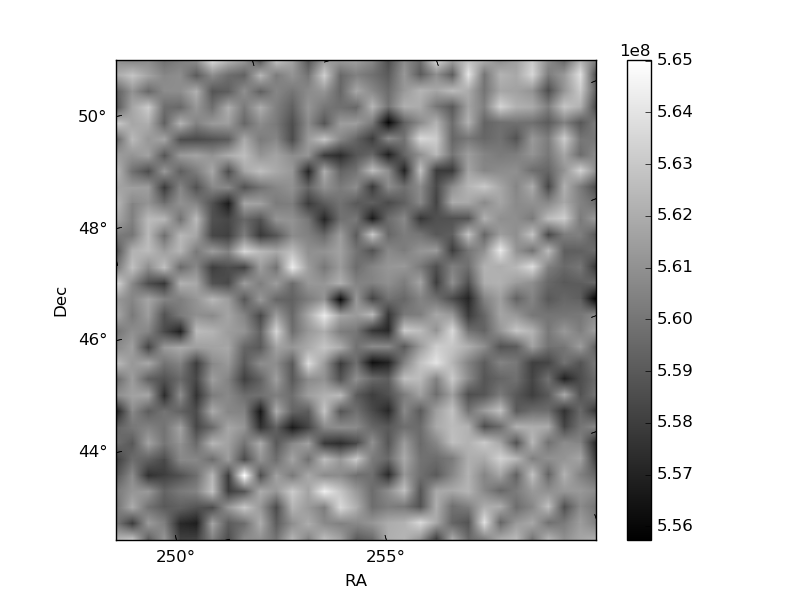
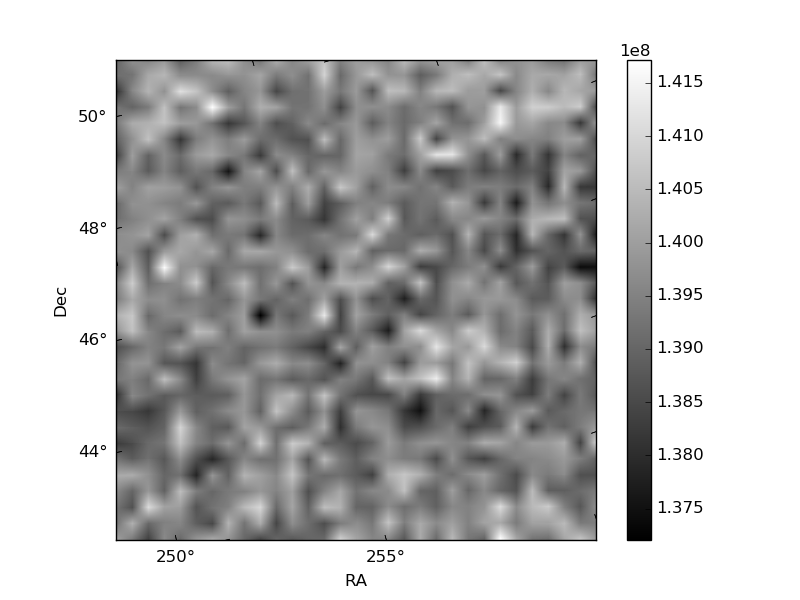
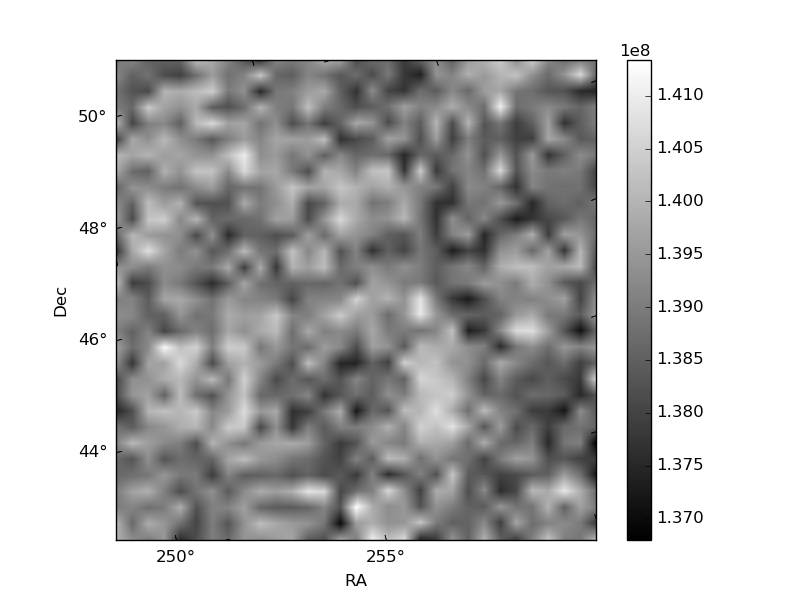
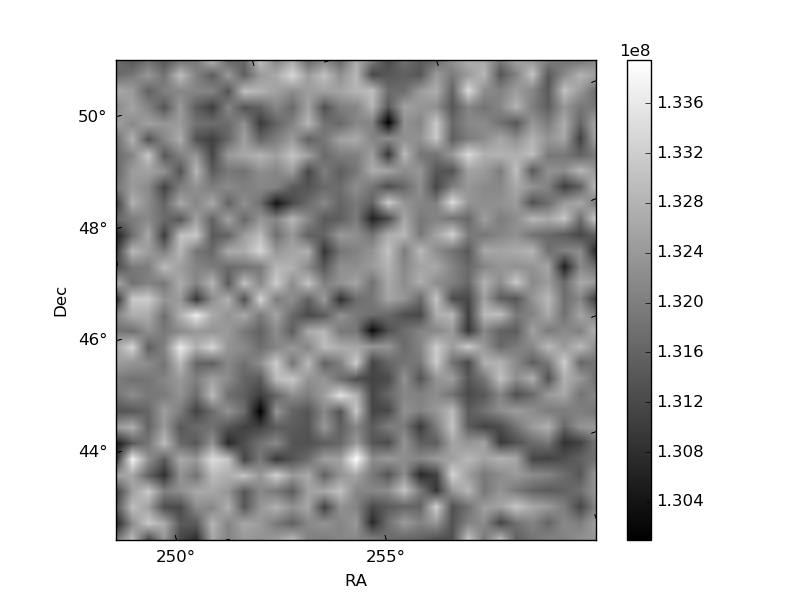
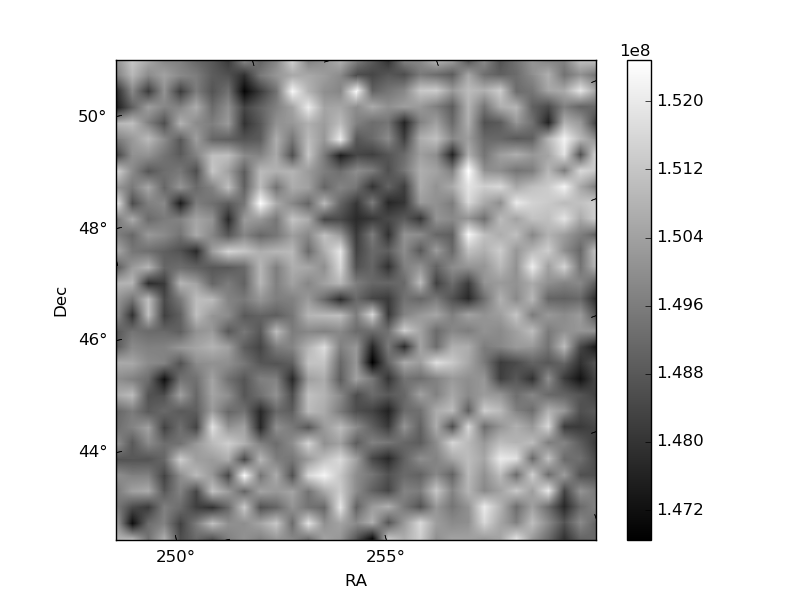
Histogram calculated using DETX and DETY for each event in the final _common_clean file
| Quadrant A | 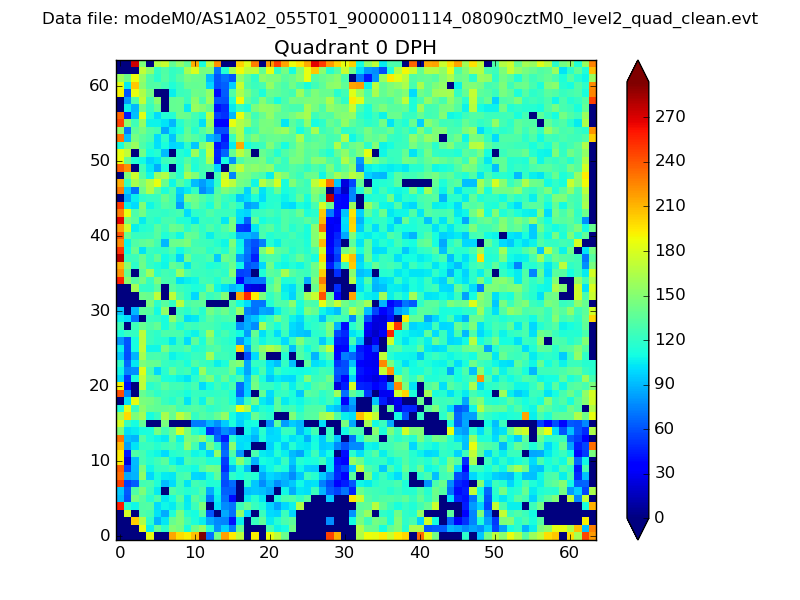 |
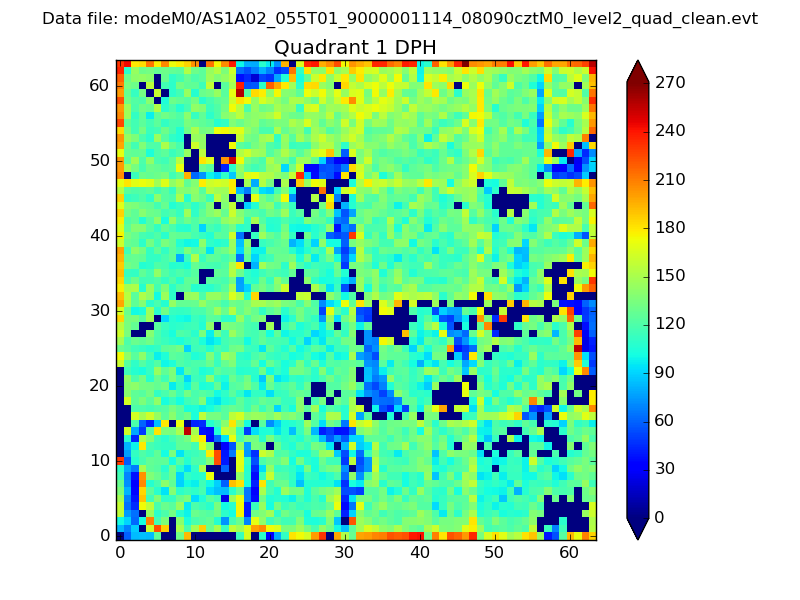 |
Quadrant B |
|---|---|---|---|
| Quadrant D | 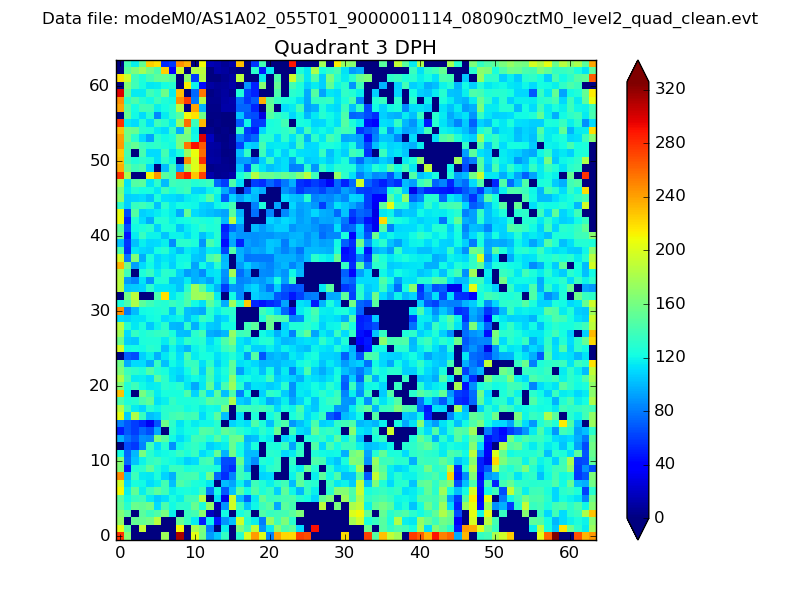 |
 |
Quadrant C |
| Plot type | Count rate plots | Images |
|---|---|---|
| Comparison with Poisson distribution Blue bars denote a histogram of data divided into 1 sec bins. Red curve is a Poisson curve with rate = median count rate of data. |
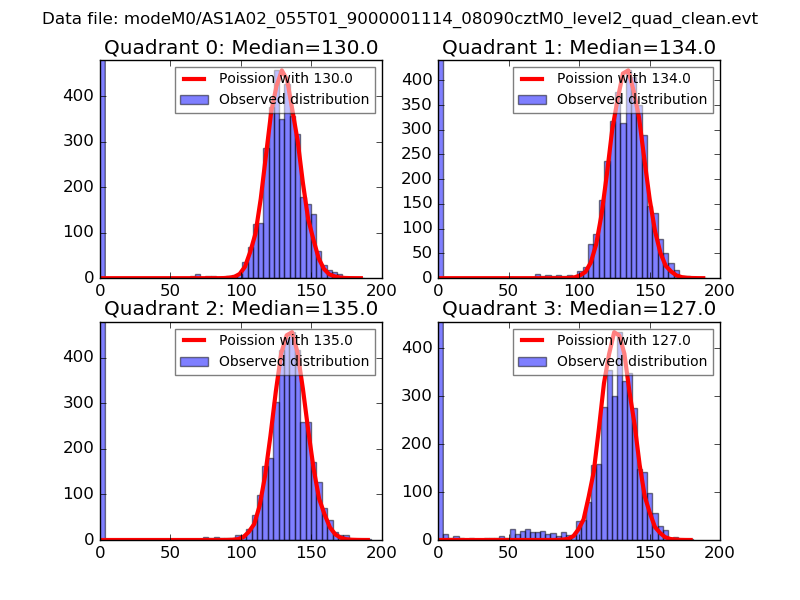 |
 |
| Quadrant-wise count rates Data is divided into 100 sec bins |
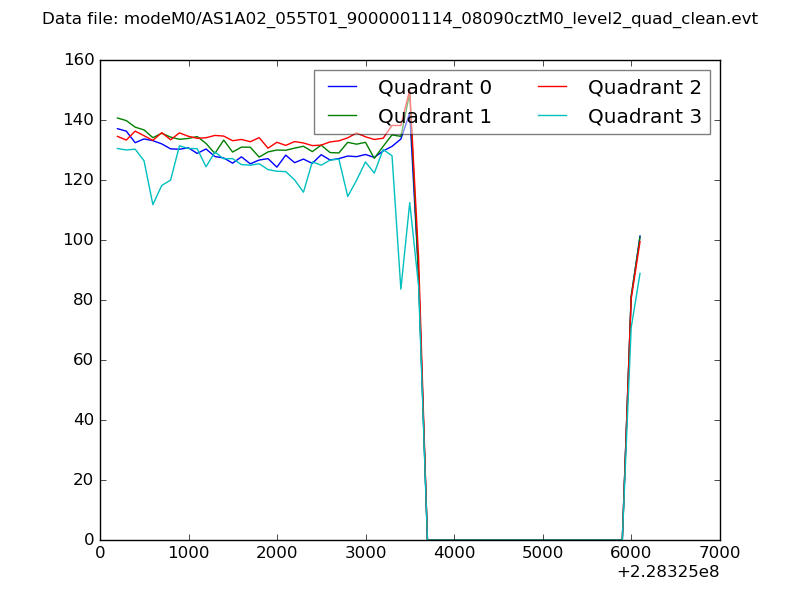 |
|
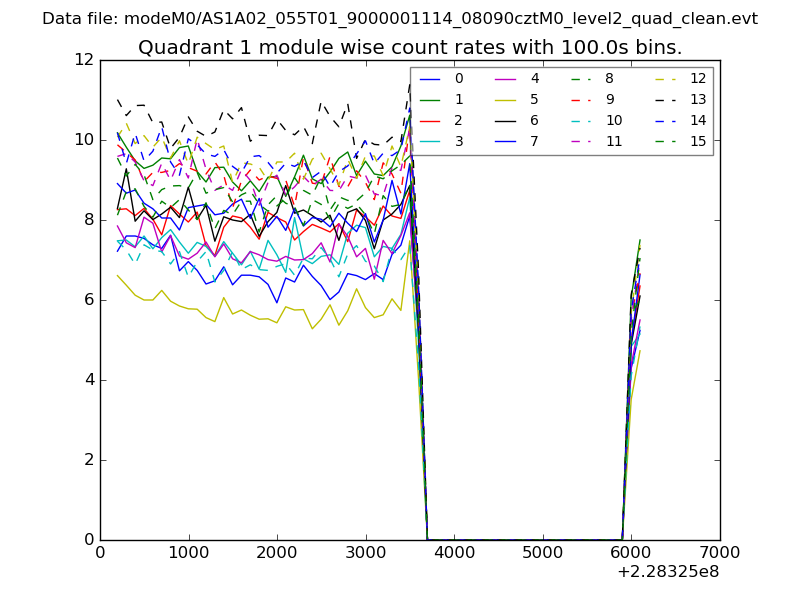
| Module-wise count rates for Quadrant A Data is divided into 100 sec bins |
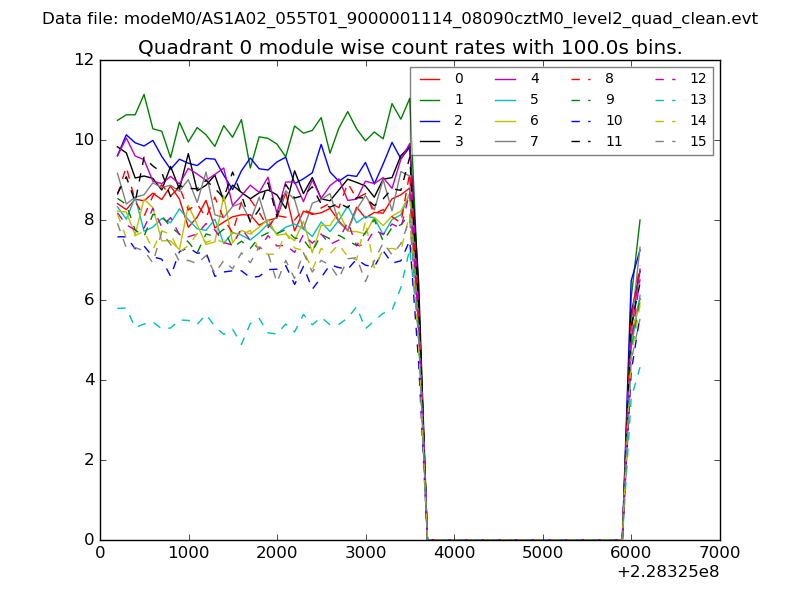 |
 |
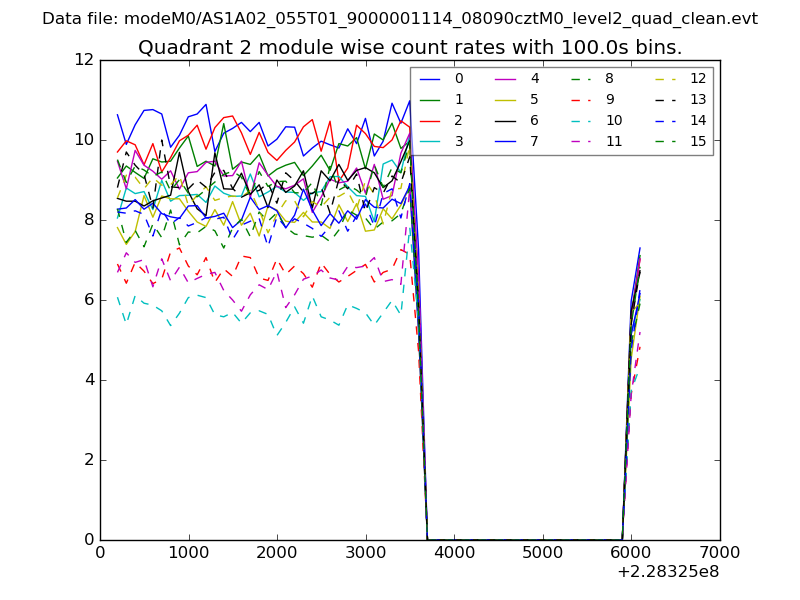
| Module-wise count rates for Quadrant B Data is divided into 100 sec bins |
 |
 |
| Module-wise count rates for Quadrant C Data is divided into 100 sec bins |
 |
 |
| Module-wise count rates for Quadrant D Data is divided into 100 sec bins |
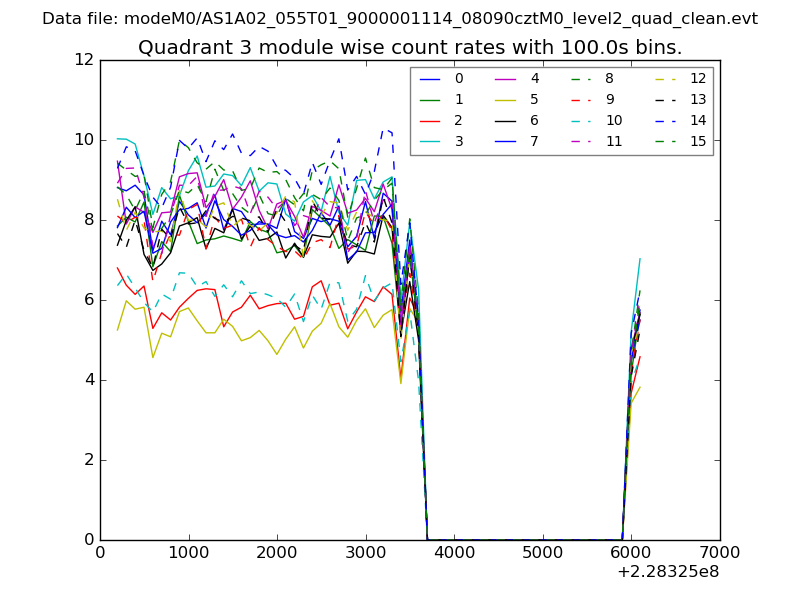 |
 |
| Parameter | Plot |
|---|---|
| CZT HV Monitor | 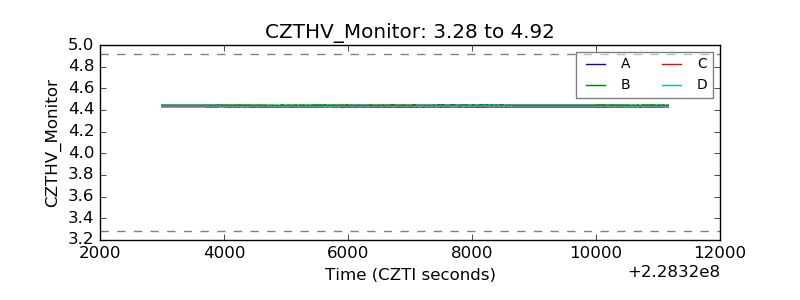 |
| D_VDD | 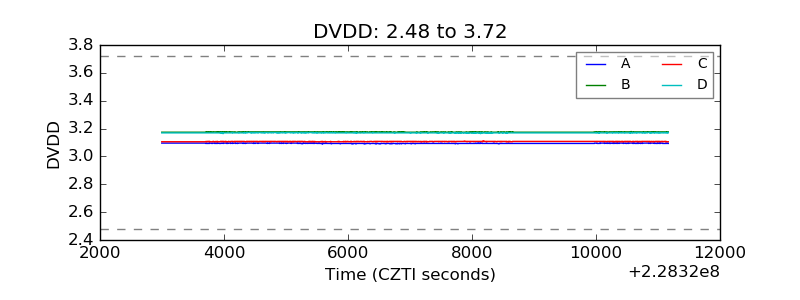 |
| Temperature 1 | 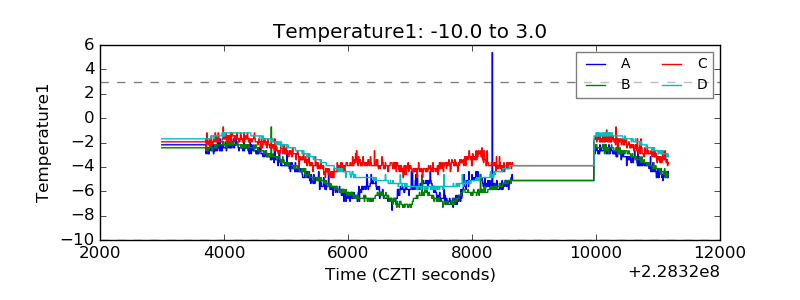 |
| Veto HV Monitor | 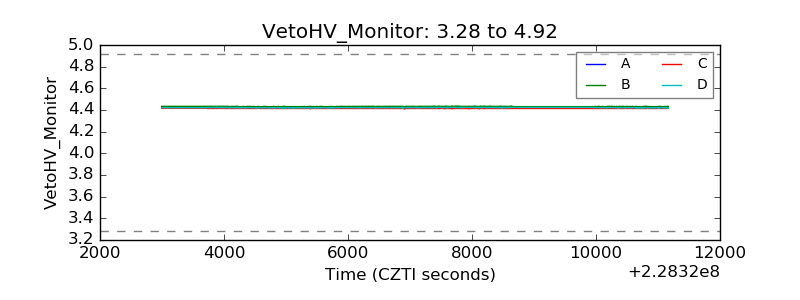 |
| Veto LLD | 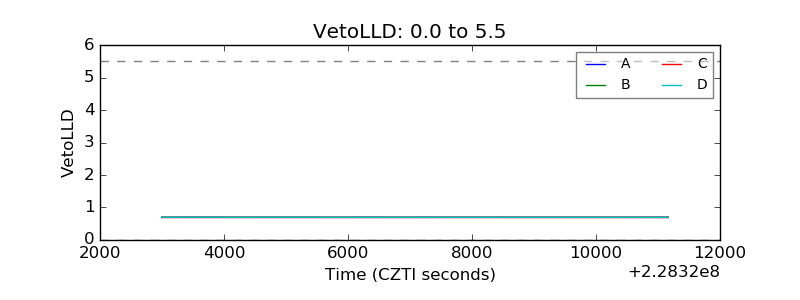 |
| Alpha Counter | 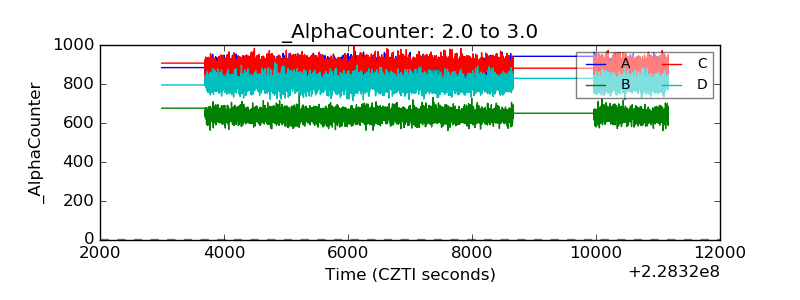 |
| _CPM_Rate | 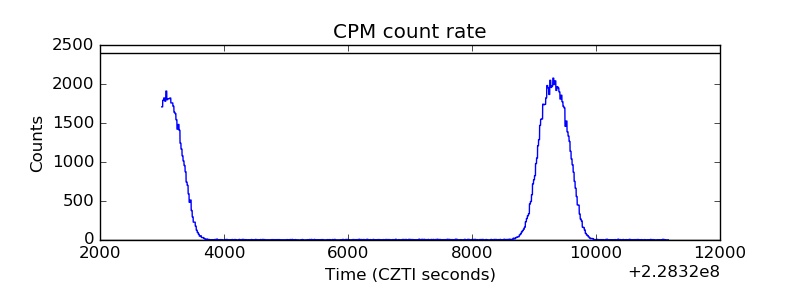 |
| CZT Counter |  |
| +2.5 Volts monitor |  |
| +5 Volts monitor |  |
| _ROLL_ROT | 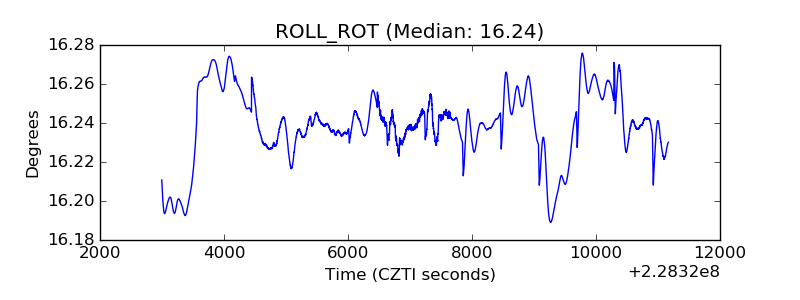 |
| _Roll_DEC | 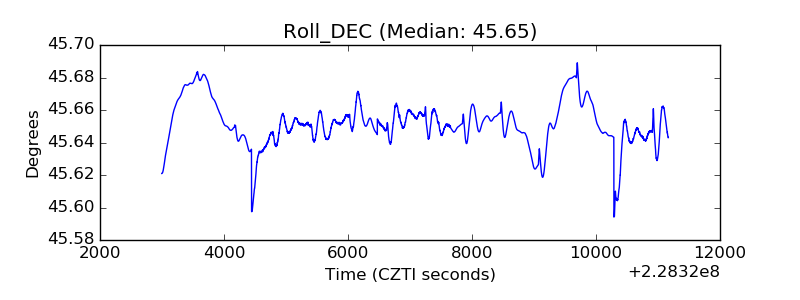 |
| _Roll_RA | 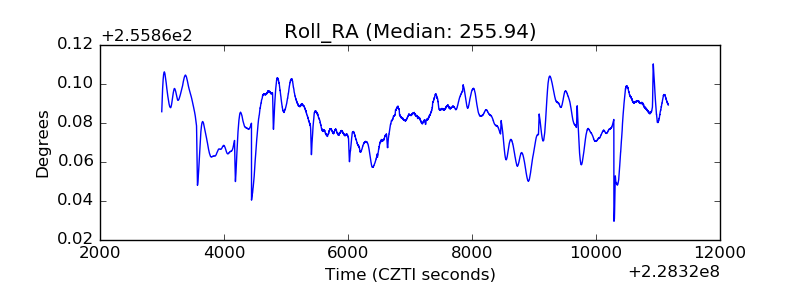 |
| Veto Counter | 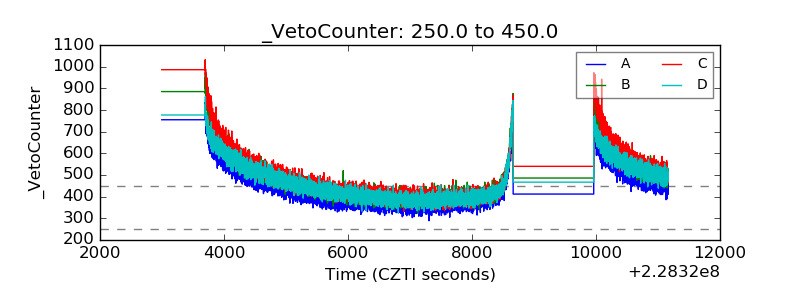 |