| Param | Original file | Final file |
|---|---|---|
| Filename | modeM0/AS1A02_055T01_9000001114_08091cztM0_level2.evt | modeM0/AS1A02_055T01_9000001114_08091cztM0_level2_quad_clean.evt |
| Size (bytes) | 494,472,960 | 91,595,520 |
| Size | 471.6 MB | 87.4 MB |
| Events in quadrant A | 3,057,392 | 580,952 |
| Events in quadrant B | 3,259,327 | 600,681 |
| Events in quadrant C | 3,349,364 | 605,078 |
| Events in quadrant D | 4,890,492 | 556,338 |
| Mode M0 | |||
|---|---|---|---|
| Quadrant | BADHDUFLAG | Total packets | Discarded packets |
| A | 0 | 13104 | 3 |
| B | 0 | 13736 | 2 |
| C | 0 | 14062 | 2 |
| D | 0 | 18566 | 2 |
| Mode M9 | |||
|---|---|---|---|
| Quadrant | BADHDUFLAG | Total packets | Discarded packets |
| A | 0 | 17 | 0 |
| B | 0 | 17 | 0 |
| C | 0 | 17 | 0 |
| D | 0 | 18 | 0 |
| Mode SS | |||
|---|---|---|---|
| Quadrant | BADHDUFLAG | Total packets | Discarded packets |
| A | 0 | 124 | 0 |
| B | 0 | 124 | 0 |
| C | 0 | 124 | 0 |
| D | 0 | 124 | 0 |
| Quadrant | Total seconds | Saturated seconds | Saturation percentage |
|---|---|---|---|
| A | 6176 | 59 | 0.955311% |
| B | 6176 | 73 | 1.181995% |
| C | 6176 | 58 | 0.939119% |
| D | 6176 | 355 | 5.748057% |
Noise dominated data is calculated using 1-second bins in cleaned event files. If a bin has >2000 counts, and if more than 50% of those come from <1% of pixels, then it is considered to be noise-dominated and hence unusable.
| Quadrant | # 1 sec bins | Bins with >0 counts | Bins with >2000 counts | High rate bins dominated by noise | Noise dominated (total time) | Noise dominated (detector-on time) | Marked lightcurve |
|---|---|---|---|---|---|---|---|
| A | 7516 | 6178 | 0 | 0 | 0.00% | 0.00% | 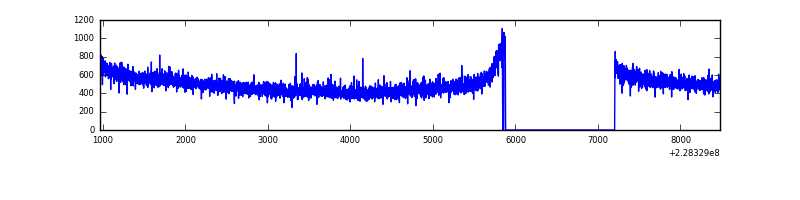 |
| B | 7516 | 6178 | 3 | 3 | 0.04% | 0.05% | 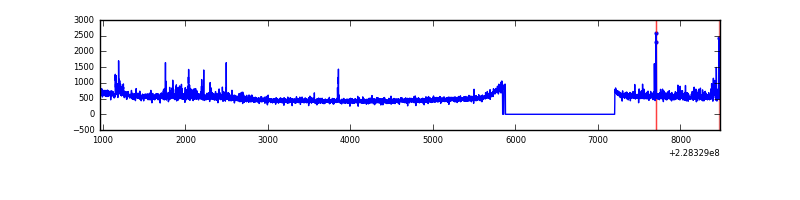 |
| C | 7516 | 6178 | 5 | 5 | 0.07% | 0.08% |  |
| D | 7516 | 6178 | 204 | 204 | 2.71% | 3.30% | 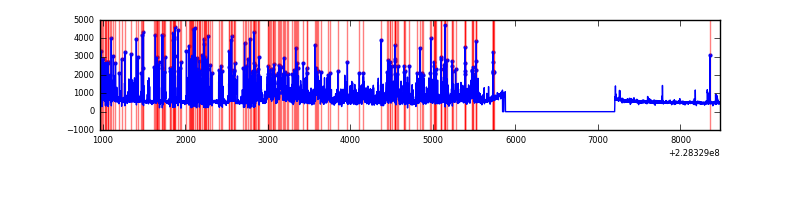 |
Top three noisy pixels from each quadrant. If the there are fewer than three noisy pixels in the level2.evt file, extra rows are filled as -1
| Pixel properties | Quadrant properties | ||||||
|---|---|---|---|---|---|---|---|
| Quadrant | DetID | PixID | Counts | Sigma | Mean | Median | Sigma |
| A | 13 | 164 | 14652 | 87.43 | 790 | 774 | 158.7 |
| A | 0 | 226 | 7447 | 42.04 | 790 | 774 | 158.7 |
| A | 12 | 194 | 6956 | 38.95 | 790 | 774 | 158.7 |
| B | 11 | 51 | 109585 | 724.83 | 799 | 781 | 150.1 |
| B | 0 | 231 | 37177 | 242.46 | 799 | 781 | 150.1 |
| B | 12 | 111 | 15329 | 96.92 | 799 | 781 | 150.1 |
| C | 1 | 16 | 151505 | 837.32 | 786 | 792 | 180.0 |
| C | 0 | 224 | 128761 | 710.96 | 786 | 792 | 180.0 |
| C | 13 | 61 | 5927 | 28.53 | 786 | 792 | 180.0 |
| D | 1 | 52 | 1954763 | 10436.52 | 764 | 744 | 187.2 |
| D | 7 | 71 | 39296 | 205.91 | 764 | 744 | 187.2 |
| D | 2 | 234 | 20472 | 105.37 | 764 | 744 | 187.2 |
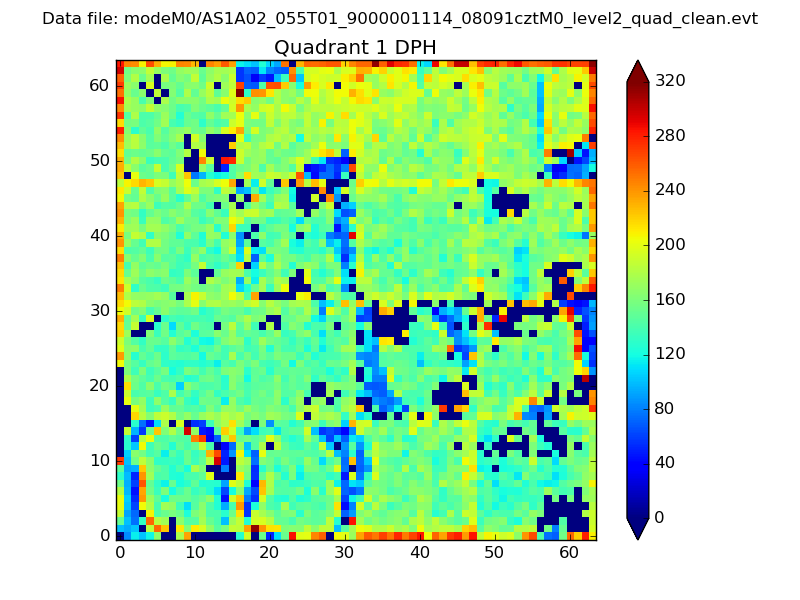
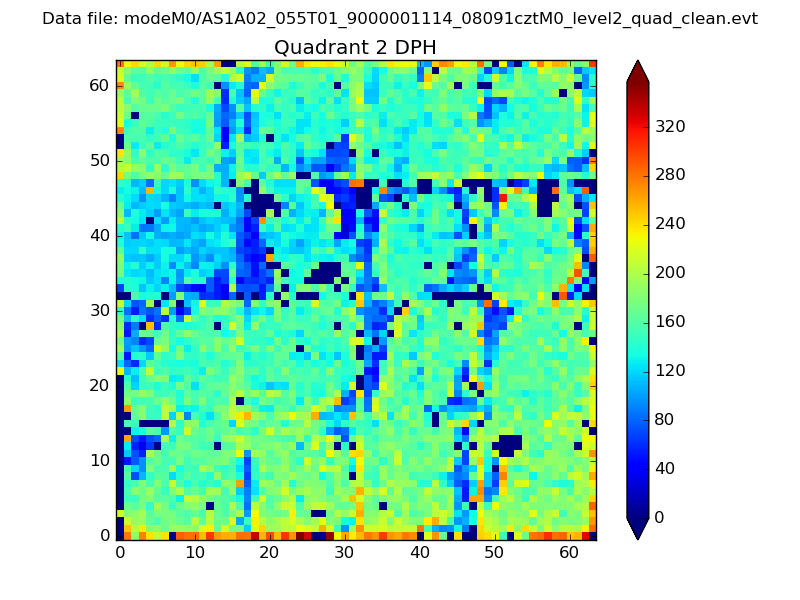
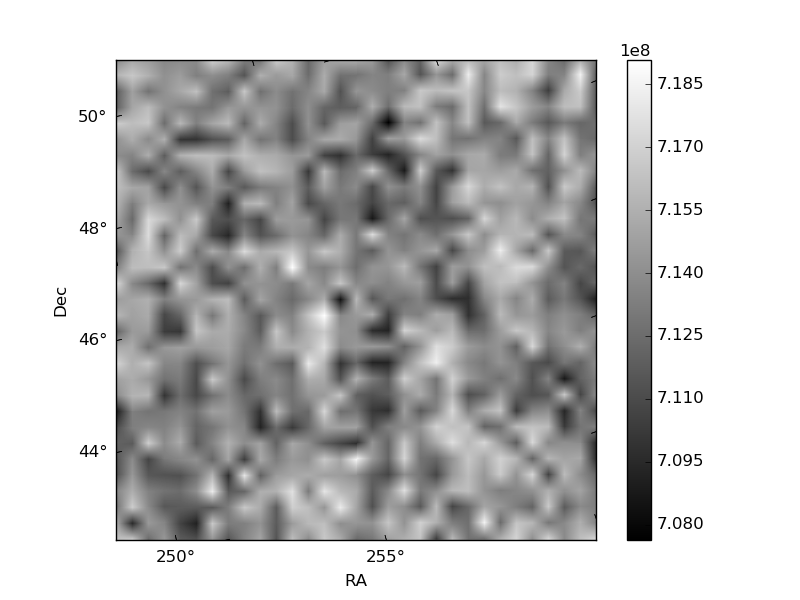
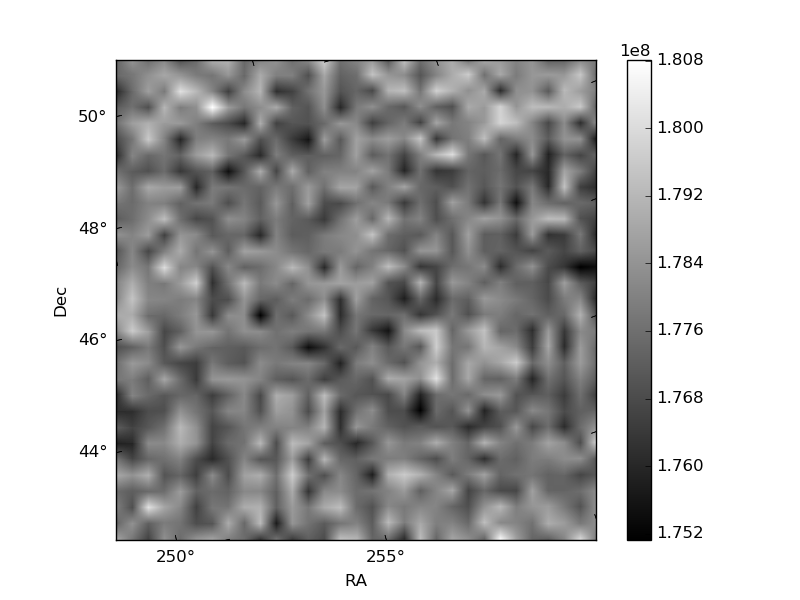
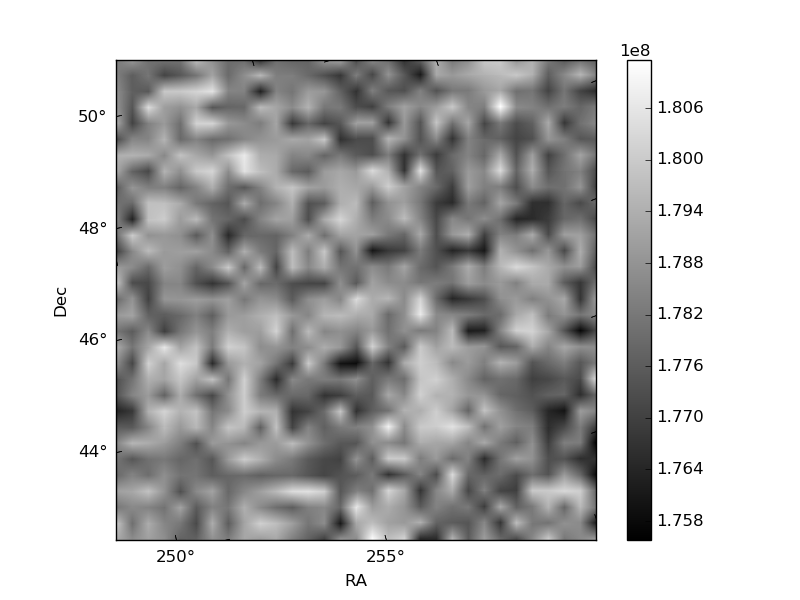
Histogram calculated using DETX and DETY for each event in the final _common_clean file
| Quadrant A | 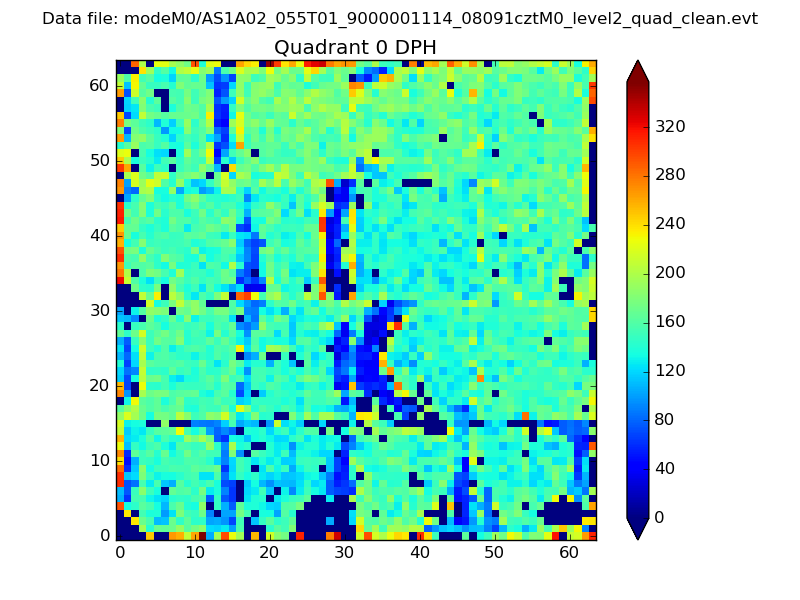 |
 |
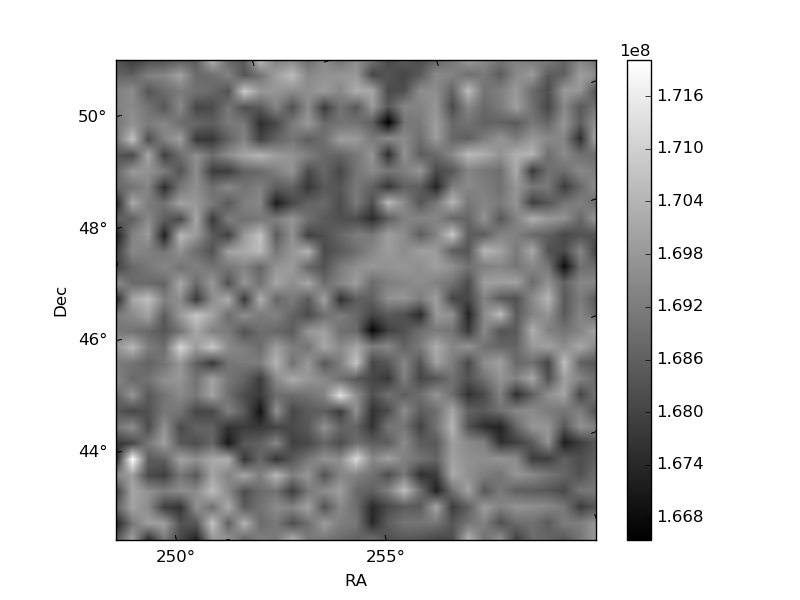
Quadrant B |
|---|---|---|---|
| Quadrant D | 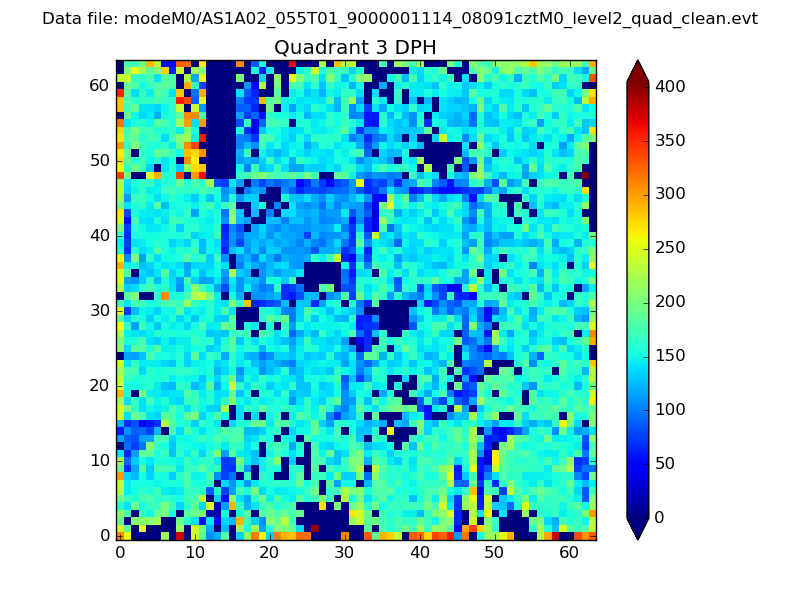 |
 |
Quadrant C |
| Plot type | Count rate plots | Images |
|---|---|---|
| Comparison with Poisson distribution Blue bars denote a histogram of data divided into 1 sec bins. Red curve is a Poisson curve with rate = median count rate of data. |
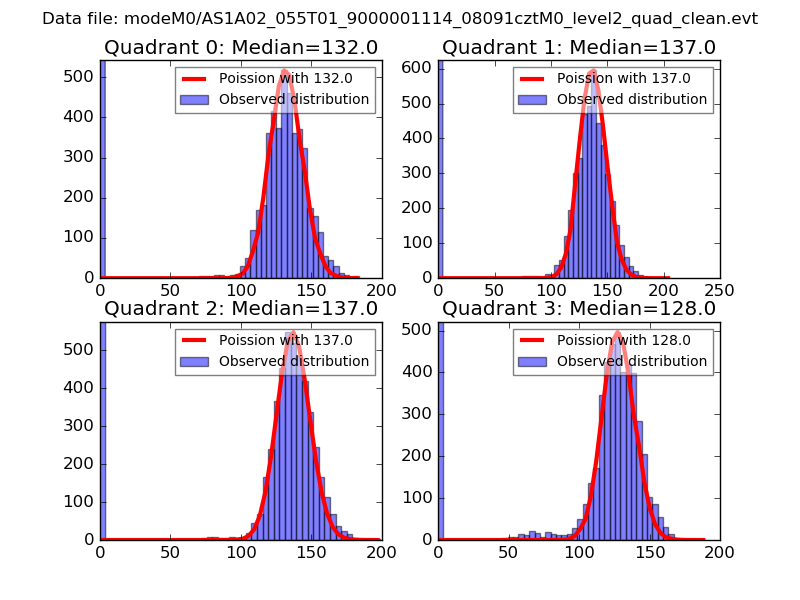 |
 |
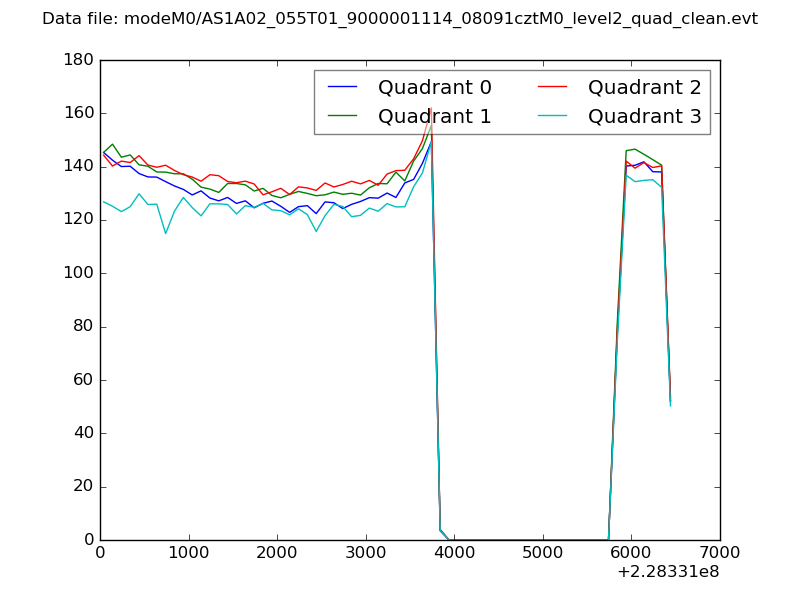
| Quadrant-wise count rates Data is divided into 100 sec bins |
 |
|
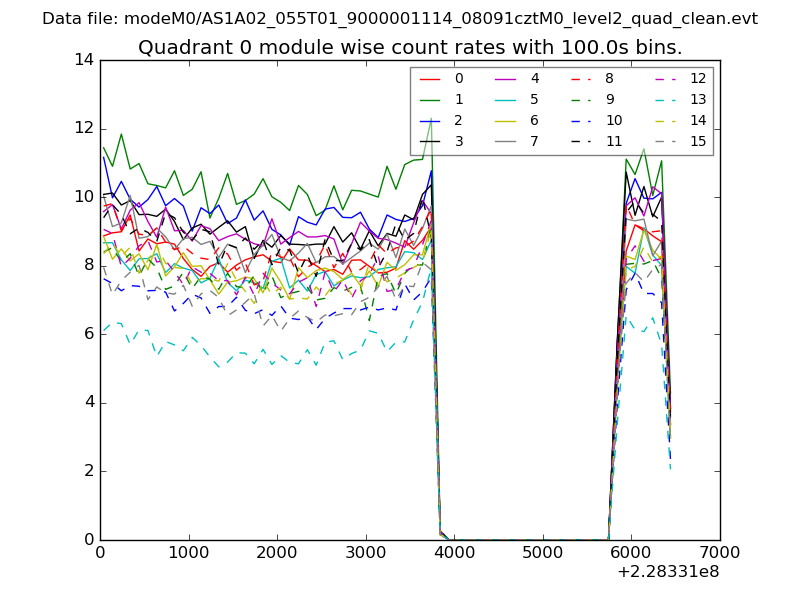
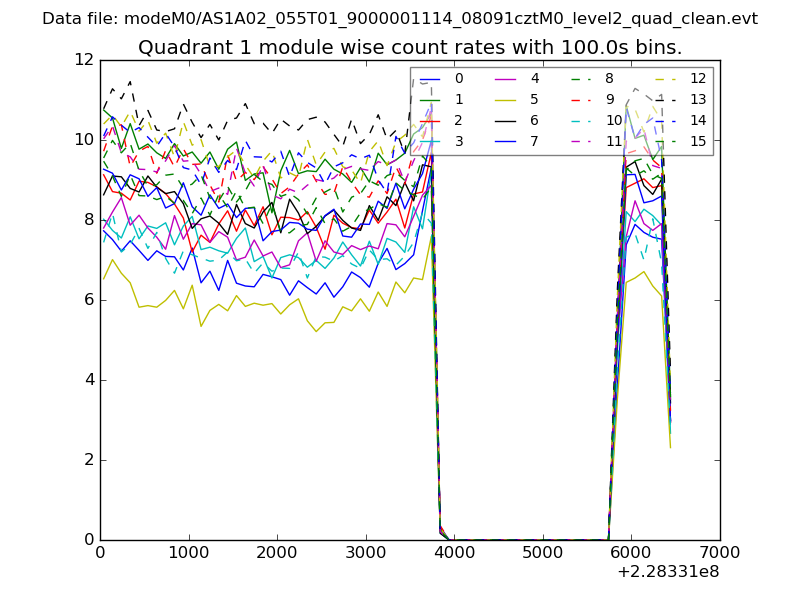
| Module-wise count rates for Quadrant A Data is divided into 100 sec bins |
 |
 |
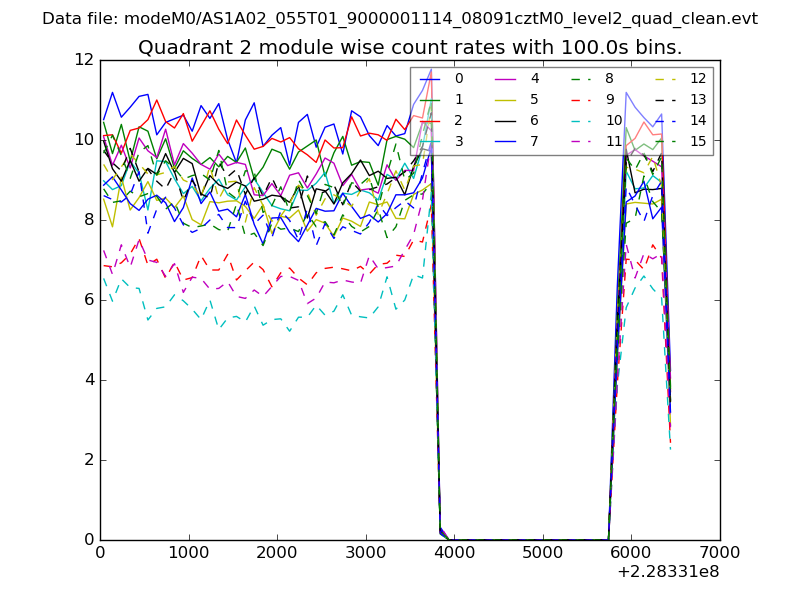
| Module-wise count rates for Quadrant B Data is divided into 100 sec bins |
 |
 |
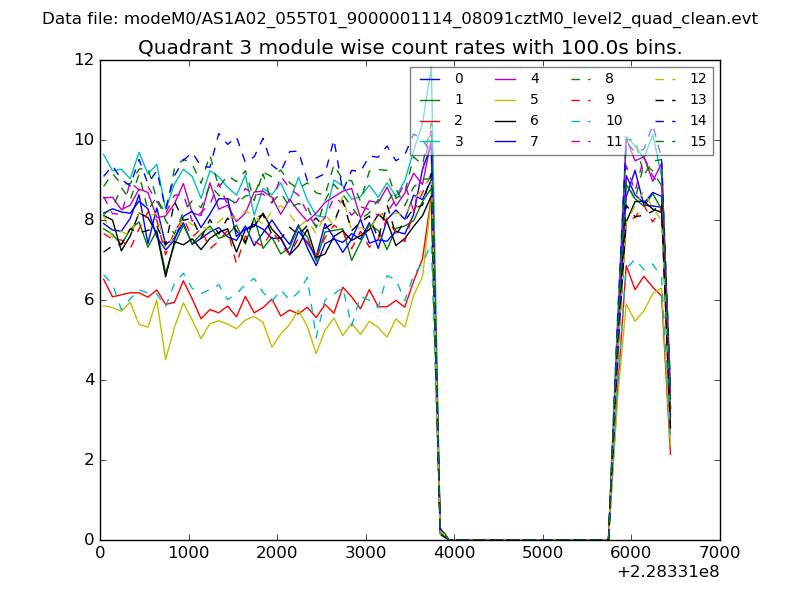
| Module-wise count rates for Quadrant C Data is divided into 100 sec bins |
 |
 |
| Module-wise count rates for Quadrant D Data is divided into 100 sec bins |
 |
 |
| Parameter | Plot |
|---|---|
| CZT HV Monitor | 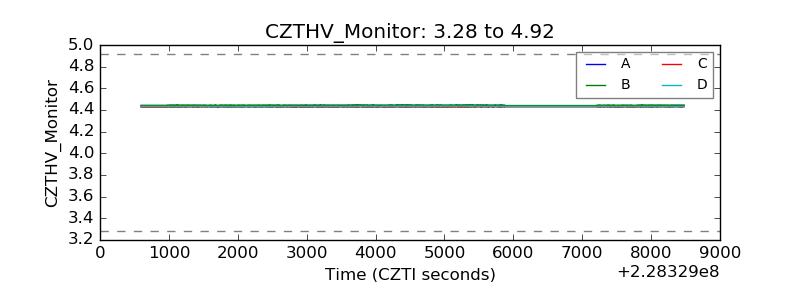 |
| D_VDD | 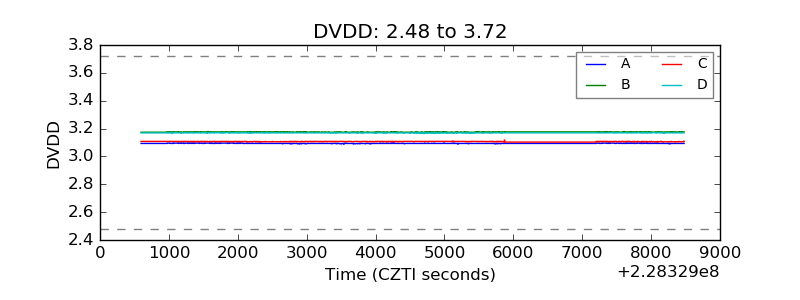 |
| Temperature 1 | 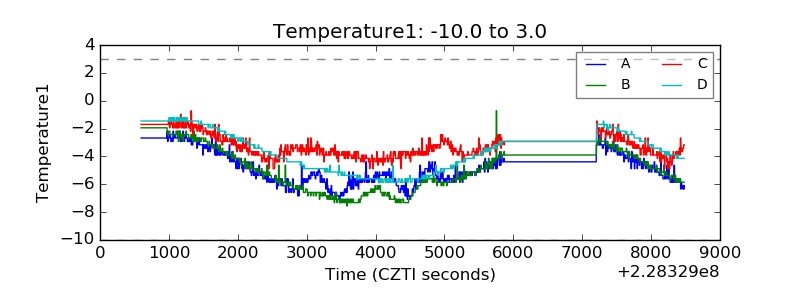 |
| Veto HV Monitor | 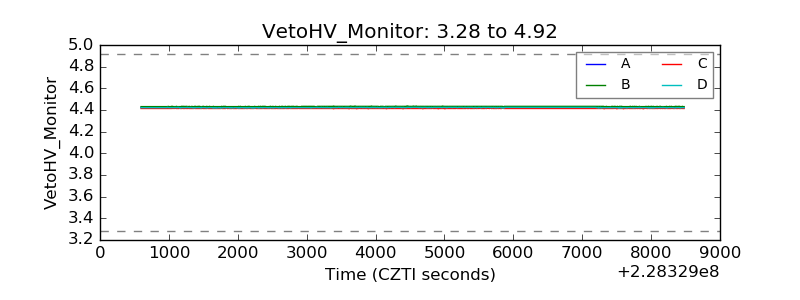 |
| Veto LLD | 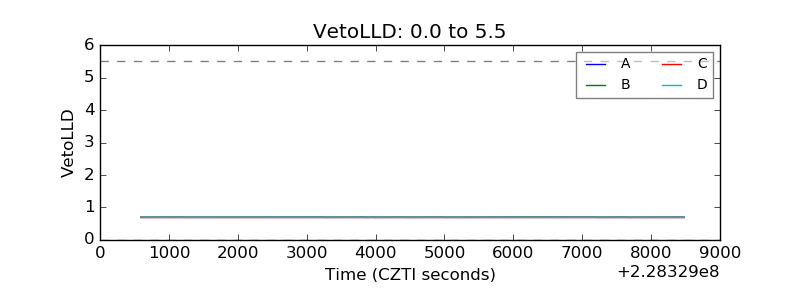 |
| Alpha Counter | 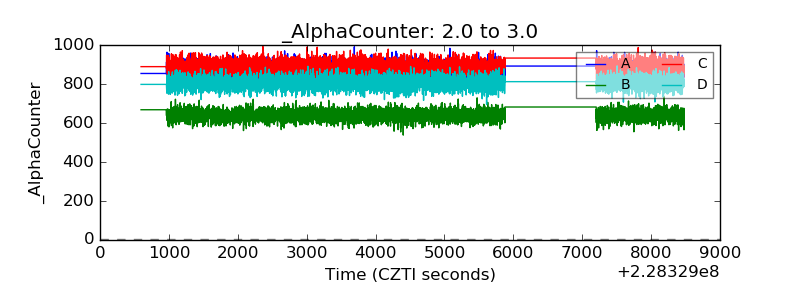 |
| _CPM_Rate | 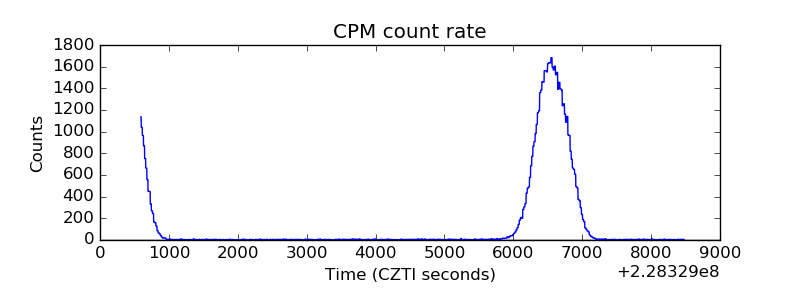 |
| CZT Counter | 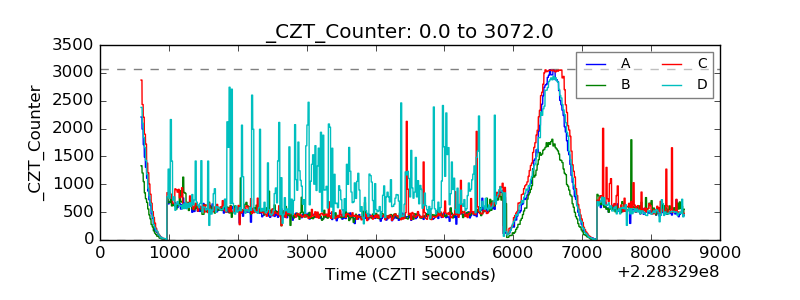 |
| +2.5 Volts monitor | 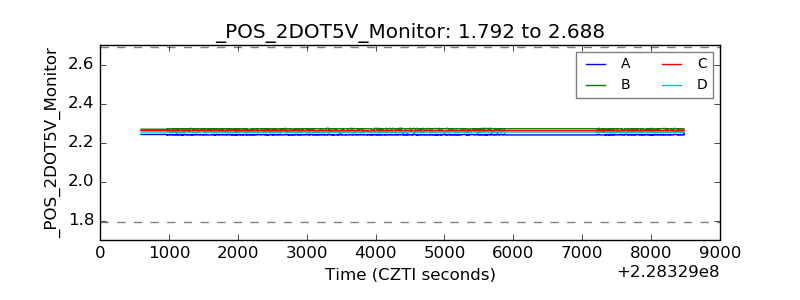 |
| +5 Volts monitor |  |
| _ROLL_ROT | 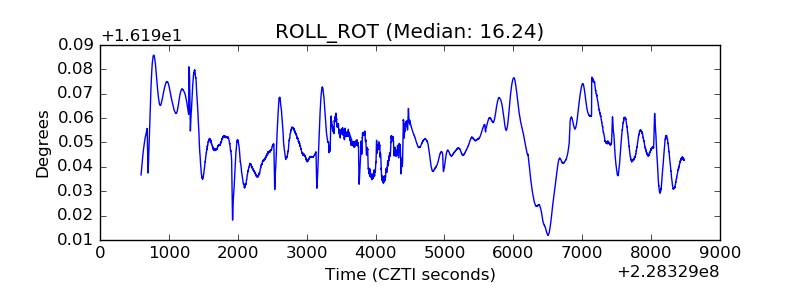 |
| _Roll_DEC | 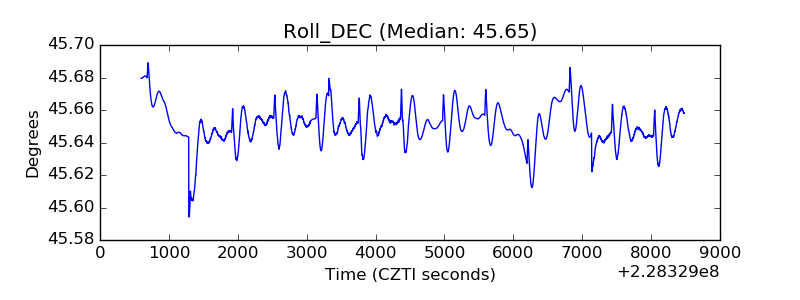 |
| _Roll_RA | 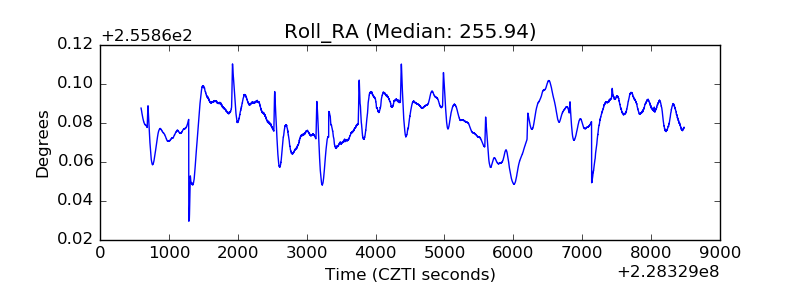 |
| Veto Counter | 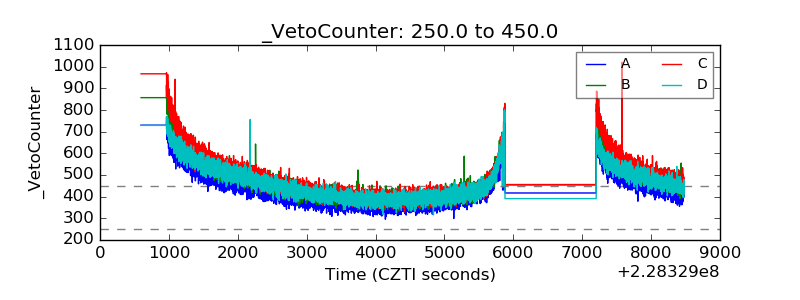 |