| Param | Original file | Final file |
|---|---|---|
| Filename | modeM0/AS1A02_055T01_9000001114_08093cztM0_level2.evt | modeM0/AS1A02_055T01_9000001114_08093cztM0_level2_quad_clean.evt |
| Size (bytes) | 463,731,840 | 101,695,680 |
| Size | 442.2 MB | 97.0 MB |
| Events in quadrant A | 3,315,426 | 643,873 |
| Events in quadrant B | 3,402,157 | 662,450 |
| Events in quadrant C | 3,410,082 | 670,523 |
| Events in quadrant D | 3,464,107 | 639,201 |
| Mode M0 | |||
|---|---|---|---|
| Quadrant | BADHDUFLAG | Total packets | Discarded packets |
| A | 0 | 14560 | 4 |
| B | 0 | 14644 | 3 |
| C | 0 | 14647 | 3 |
| D | 0 | 15089 | 3 |
| Mode M9 | |||
|---|---|---|---|
| Quadrant | BADHDUFLAG | Total packets | Discarded packets |
| A | 0 | 12 | 0 |
| B | 0 | 12 | 0 |
| C | 0 | 12 | 0 |
| D | 0 | 13 | 0 |
| Mode SS | |||
|---|---|---|---|
| Quadrant | BADHDUFLAG | Total packets | Discarded packets |
| A | 0 | 136 | 0 |
| B | 0 | 136 | 0 |
| C | 0 | 136 | 0 |
| D | 0 | 136 | 0 |
| Quadrant | Total seconds | Saturated seconds | Saturation percentage |
|---|---|---|---|
| A | 6649 | 191 | 2.872612% |
| B | 6649 | 174 | 2.616935% |
| C | 6649 | 174 | 2.616935% |
| D | 6649 | 211 | 3.173410% |
Noise dominated data is calculated using 1-second bins in cleaned event files. If a bin has >2000 counts, and if more than 50% of those come from <1% of pixels, then it is considered to be noise-dominated and hence unusable.
| Quadrant | # 1 sec bins | Bins with >0 counts | Bins with >2000 counts | High rate bins dominated by noise | Noise dominated (total time) | Noise dominated (detector-on time) | Marked lightcurve |
|---|---|---|---|---|---|---|---|
| A | 7619 | 6651 | 29 | 29 | 0.38% | 0.44% | 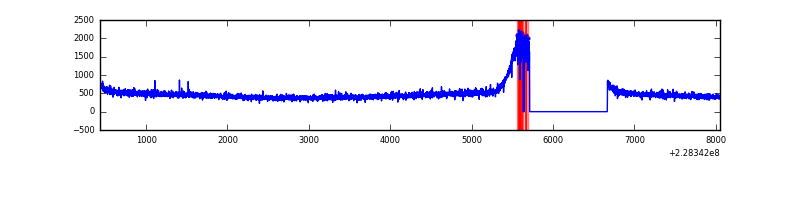 |
| B | 7619 | 6651 | 16 | 16 | 0.21% | 0.24% | 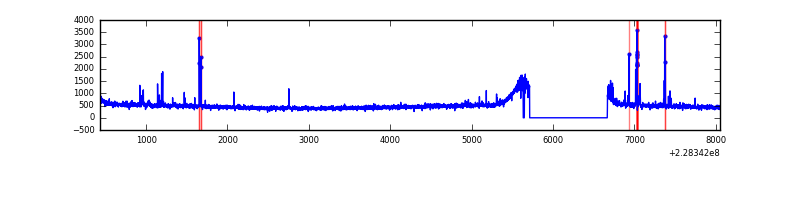 |
| C | 7619 | 6650 | 16 | 16 | 0.21% | 0.24% | 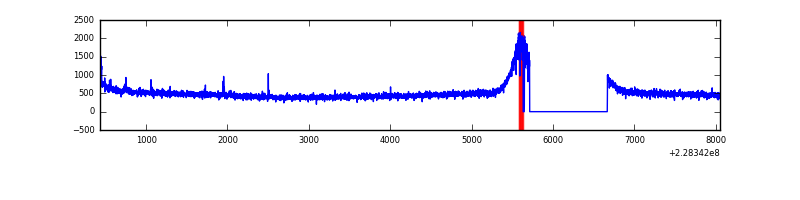 |
| D | 7619 | 6651 | 85 | 85 | 1.12% | 1.28% | 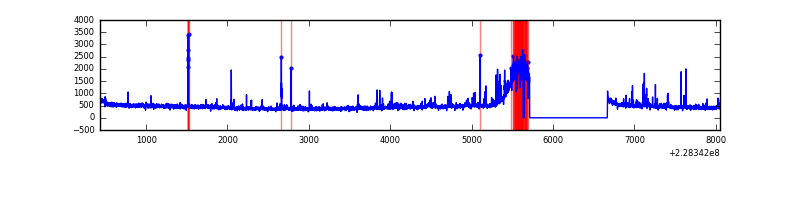 |
Top three noisy pixels from each quadrant. If the there are fewer than three noisy pixels in the level2.evt file, extra rows are filled as -1
| Pixel properties | Quadrant properties | ||||||
|---|---|---|---|---|---|---|---|
| Quadrant | DetID | PixID | Counts | Sigma | Mean | Median | Sigma |
| A | 0 | 226 | 8104 | 40.63 | 862 | 848 | 178.6 |
| A | 12 | 194 | 8071 | 40.45 | 862 | 848 | 178.6 |
| A | 3 | 137 | 3140 | 12.83 | 862 | 848 | 178.6 |
| B | 10 | 16 | 69606 | 426.32 | 841 | 822 | 161.3 |
| B | 0 | 231 | 19129 | 113.46 | 841 | 822 | 161.3 |
| B | 11 | 51 | 17965 | 106.25 | 841 | 822 | 161.3 |
| C | 1 | 16 | 95100 | 471.35 | 848 | 855 | 199.9 |
| C | 13 | 61 | 6099 | 26.23 | 848 | 855 | 199.9 |
| C | 0 | 224 | 5548 | 23.47 | 848 | 855 | 199.9 |
| D | 1 | 52 | 94383 | 417.03 | 855 | 838 | 224.3 |
| D | 7 | 71 | 35017 | 152.37 | 855 | 838 | 224.3 |
| D | 2 | 234 | 22447 | 96.34 | 855 | 838 | 224.3 |
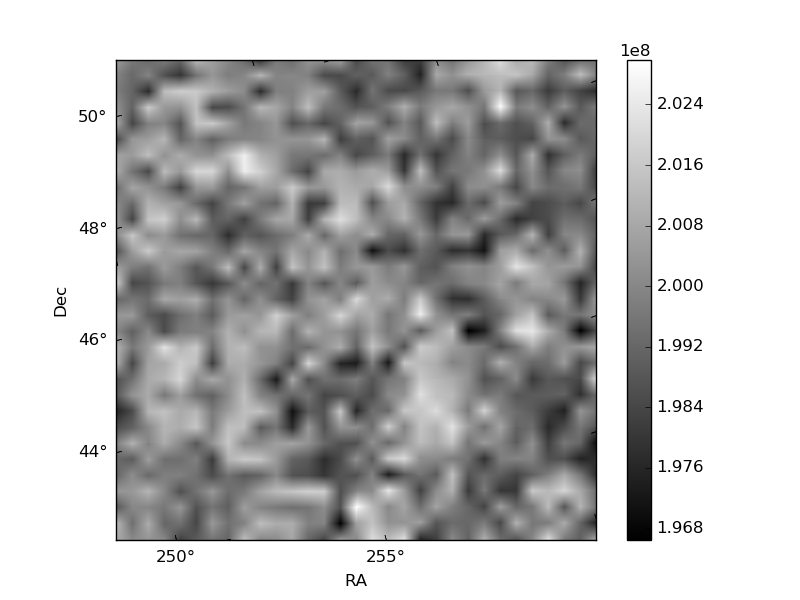
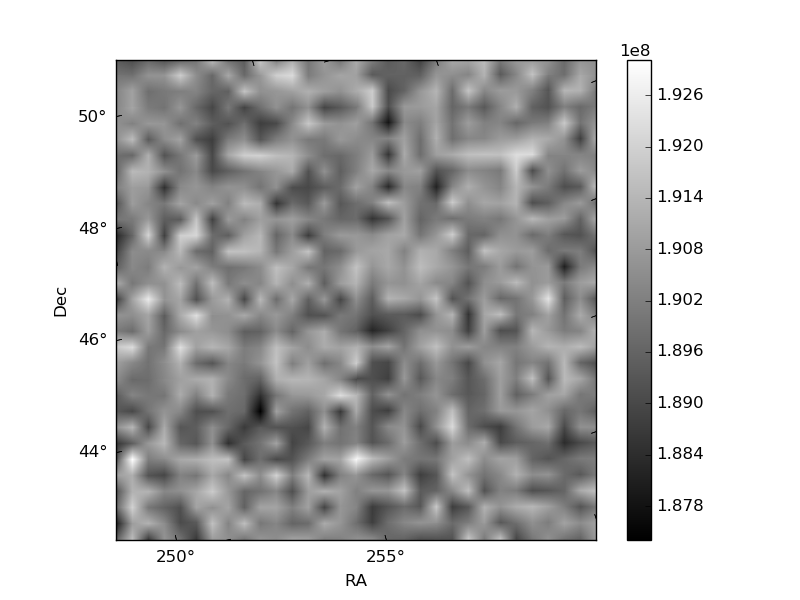
Histogram calculated using DETX and DETY for each event in the final _common_clean file
| Quadrant A |  |
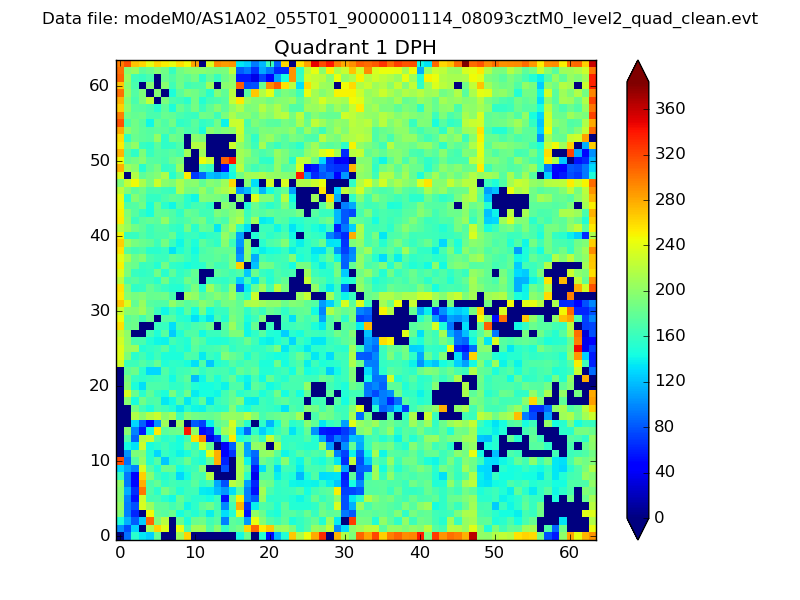 |
Quadrant B |
|---|---|---|---|
| Quadrant D | 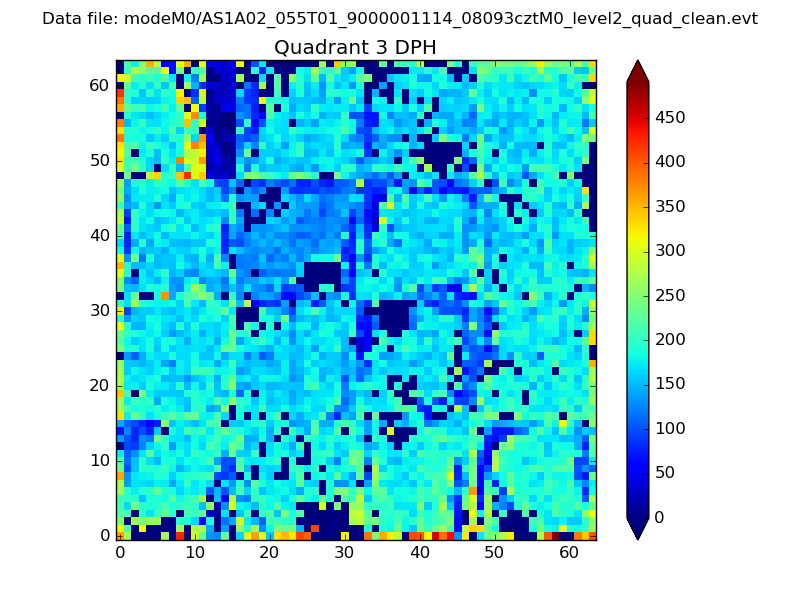 |
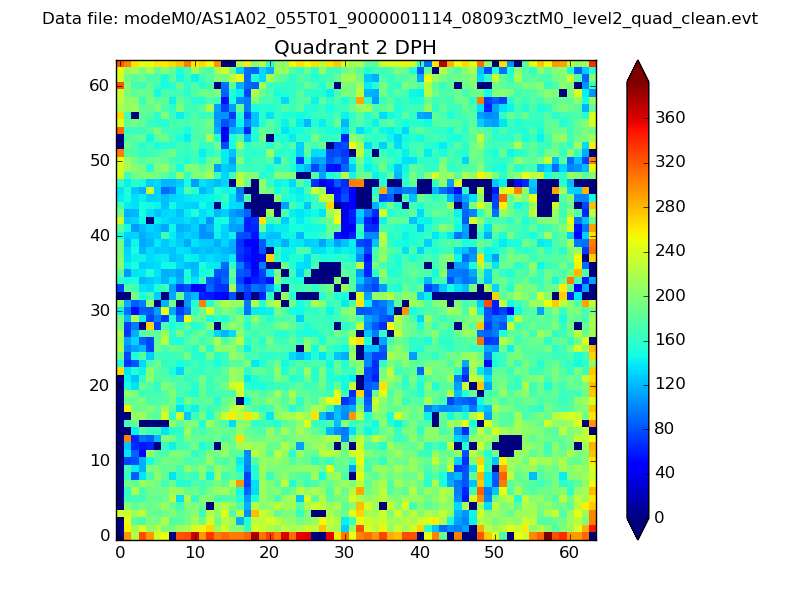 |
Quadrant C |
| Plot type | Count rate plots | Images |
|---|---|---|
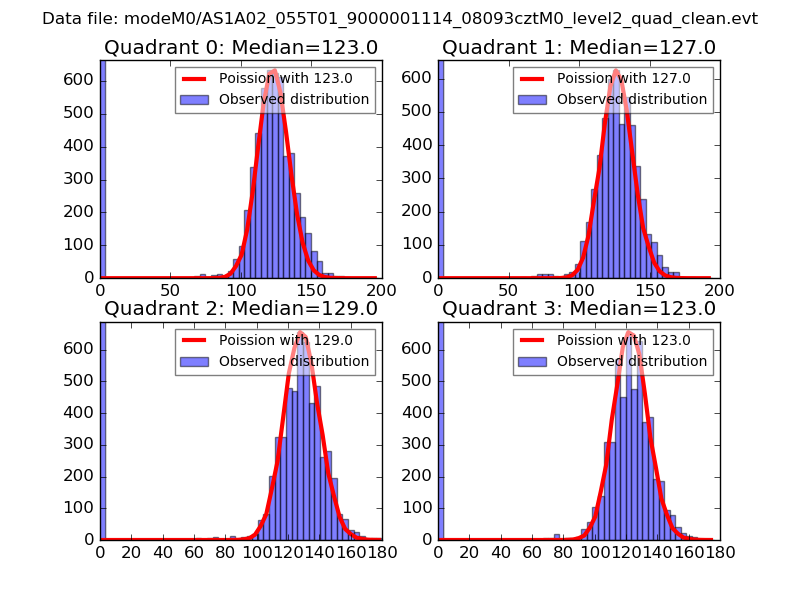
| Comparison with Poisson distribution Blue bars denote a histogram of data divided into 1 sec bins. Red curve is a Poisson curve with rate = median count rate of data. |
 |
 |
| Quadrant-wise count rates Data is divided into 100 sec bins |
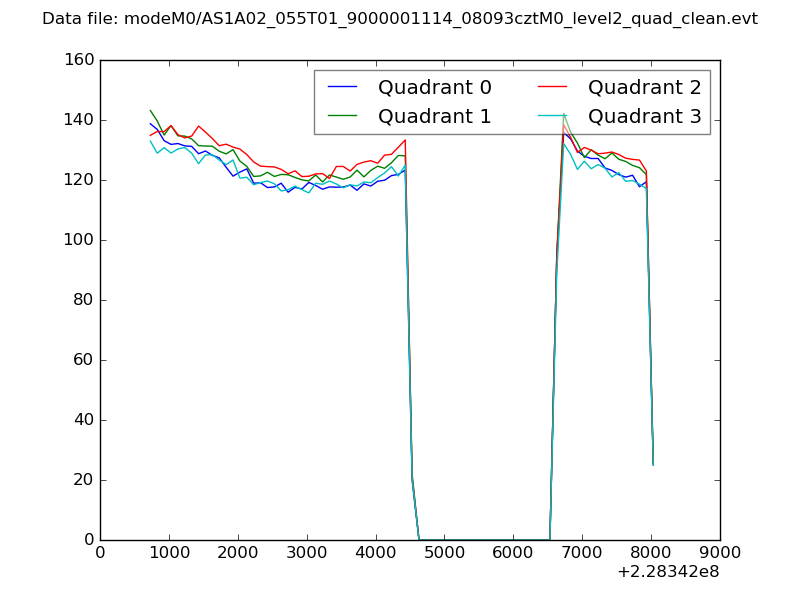 |
|
| Module-wise count rates for Quadrant A Data is divided into 100 sec bins |
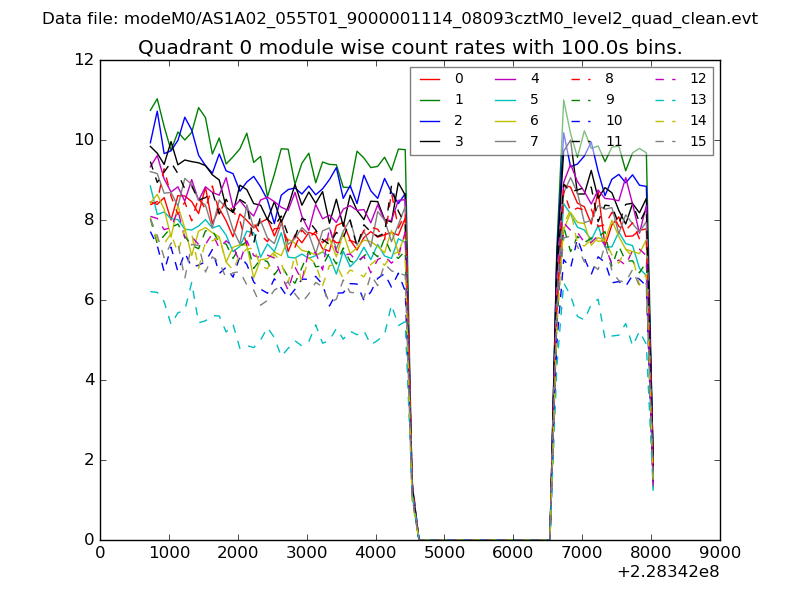 |
 |
| Module-wise count rates for Quadrant B Data is divided into 100 sec bins |
 |
 |
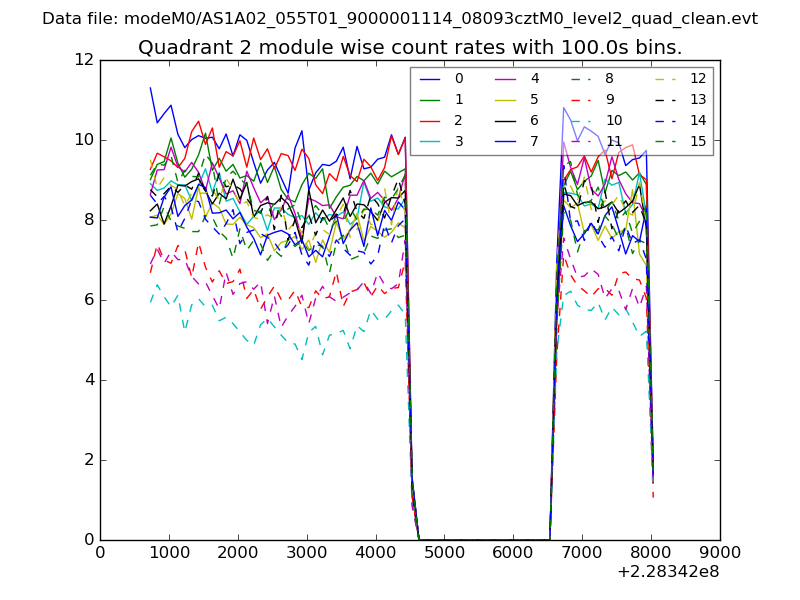
| Module-wise count rates for Quadrant C Data is divided into 100 sec bins |
 |
 |
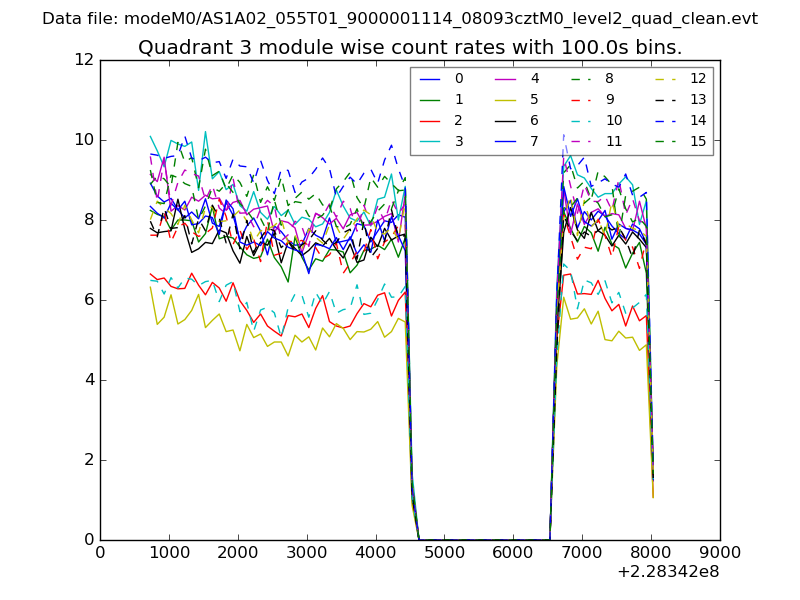
| Module-wise count rates for Quadrant D Data is divided into 100 sec bins |
 |
 |
| Parameter | Plot |
|---|---|
| CZT HV Monitor | 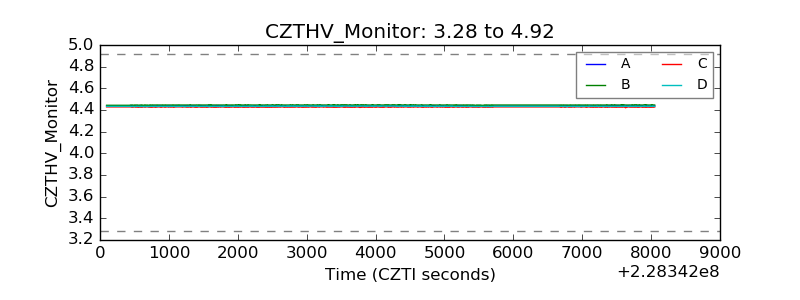 |
| D_VDD | 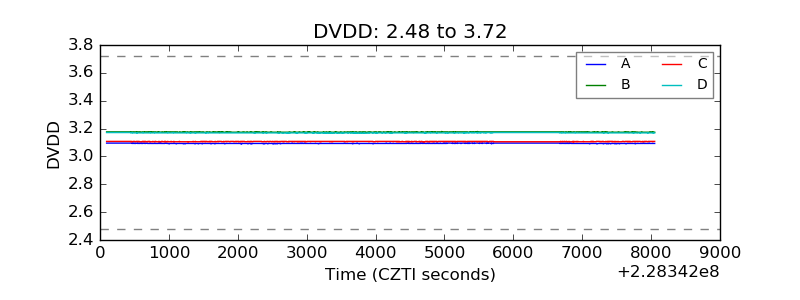 |
| Temperature 1 | 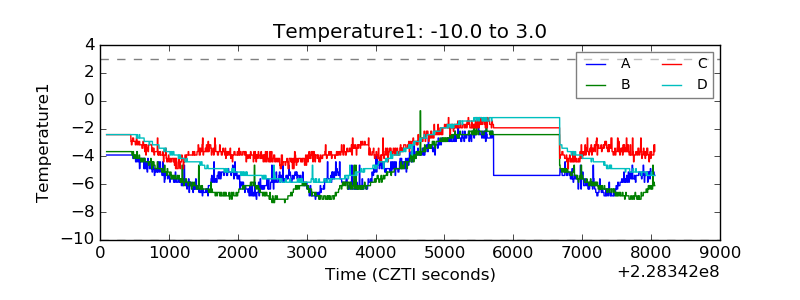 |
| Veto HV Monitor | 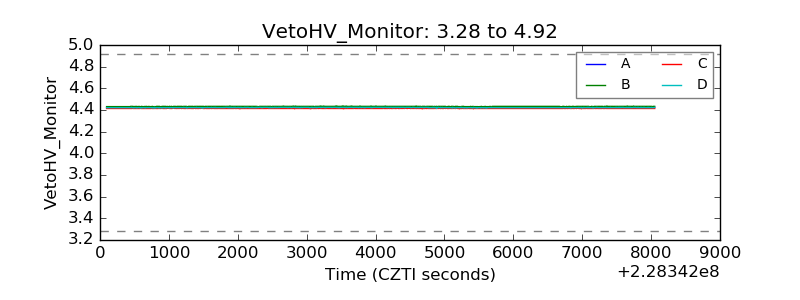 |
| Veto LLD | 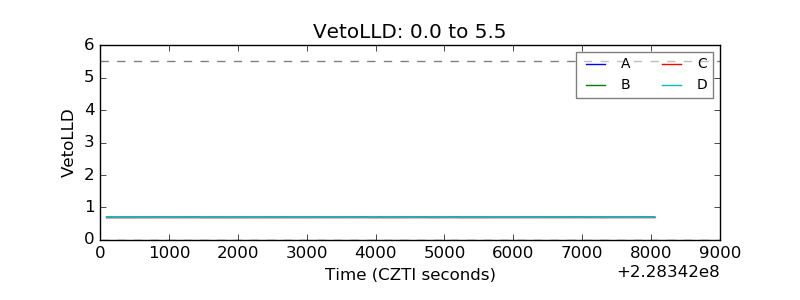 |
| Alpha Counter | 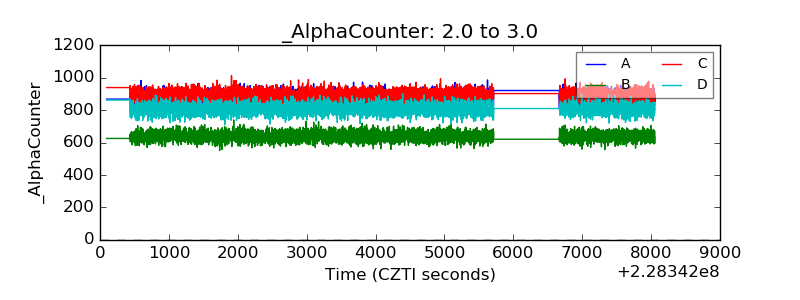 |
| _CPM_Rate | 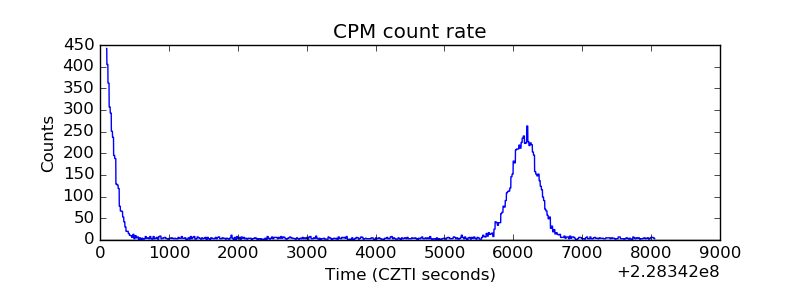 |
| CZT Counter | 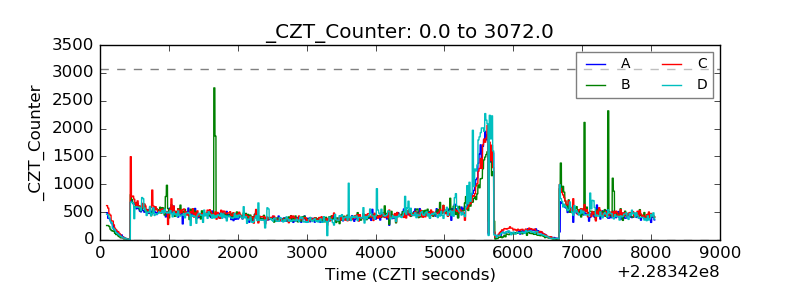 |
| +2.5 Volts monitor |  |
| +5 Volts monitor | 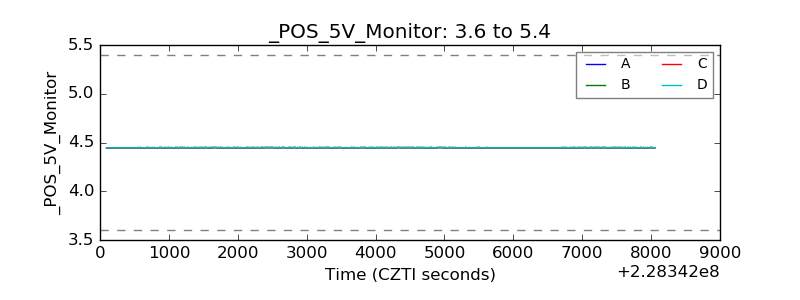 |
| _ROLL_ROT | 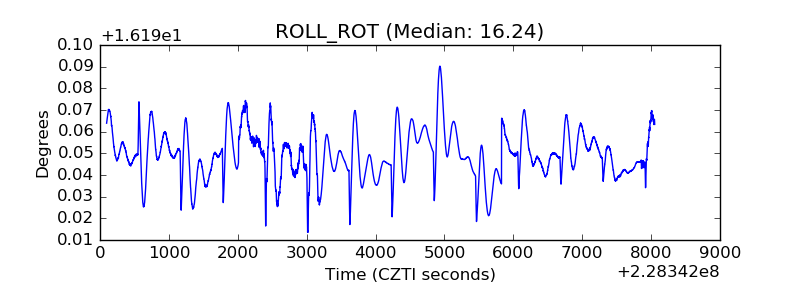 |
| _Roll_DEC | 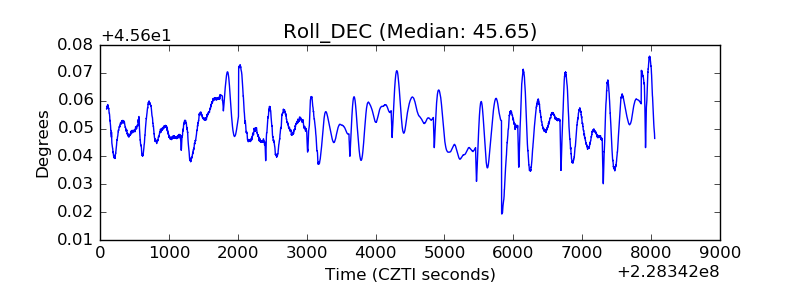 |
| _Roll_RA | 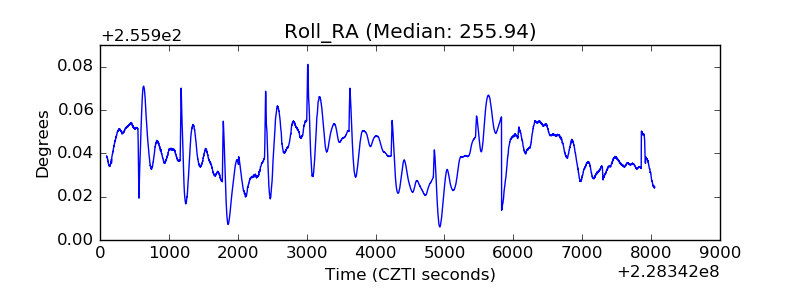 |
| Veto Counter | 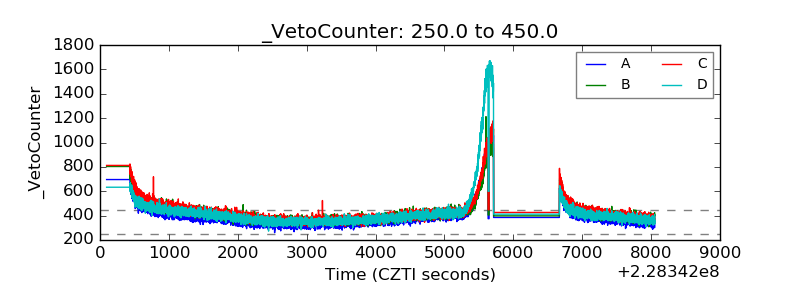 |