| Param | Original file | Final file |
|---|---|---|
| Filename | modeM0/AS1A02_055T01_9000001114_08094cztM0_level2.evt | modeM0/AS1A02_055T01_9000001114_08094cztM0_level2_quad_clean.evt |
| Size (bytes) | 486,794,880 | 100,062,720 |
| Size | 464.2 MB | 95.4 MB |
| Events in quadrant A | 3,250,445 | 623,656 |
| Events in quadrant B | 3,440,039 | 645,294 |
| Events in quadrant C | 3,357,684 | 652,558 |
| Events in quadrant D | 4,209,173 | 611,456 |
| Mode M0 | |||
|---|---|---|---|
| Quadrant | BADHDUFLAG | Total packets | Discarded packets |
| A | 0 | 14853 | 3 |
| B | 0 | 15206 | 2 |
| C | 0 | 14906 | 2 |
| D | 0 | 17654 | 2 |
| Mode M9 | |||
|---|---|---|---|
| Quadrant | BADHDUFLAG | Total packets | Discarded packets |
| A | 0 | 8 | 0 |
| B | 0 | 8 | 0 |
| C | 0 | 8 | 0 |
| D | 0 | 9 | 0 |
| Mode SS | |||
|---|---|---|---|
| Quadrant | BADHDUFLAG | Total packets | Discarded packets |
| A | 0 | 146 | 0 |
| B | 0 | 146 | 0 |
| C | 0 | 146 | 0 |
| D | 0 | 146 | 0 |
| Quadrant | Total seconds | Saturated seconds | Saturation percentage |
|---|---|---|---|
| A | 7137 | 22 | 0.308253% |
| B | 7137 | 82 | 1.148942% |
| C | 7137 | 29 | 0.406333% |
| D | 7137 | 216 | 3.026482% |
Noise dominated data is calculated using 1-second bins in cleaned event files. If a bin has >2000 counts, and if more than 50% of those come from <1% of pixels, then it is considered to be noise-dominated and hence unusable.
| Quadrant | # 1 sec bins | Bins with >0 counts | Bins with >2000 counts | High rate bins dominated by noise | Noise dominated (total time) | Noise dominated (detector-on time) | Marked lightcurve |
|---|---|---|---|---|---|---|---|
| A | 7687 | 7138 | 0 | 0 | 0.00% | 0.00% | 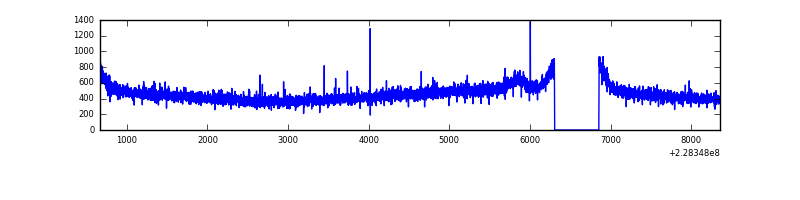 |
| B | 7687 | 7138 | 14 | 14 | 0.18% | 0.20% | 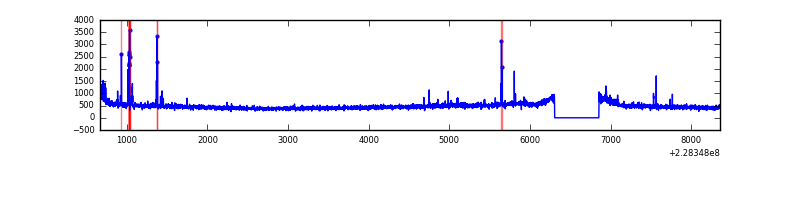 |
| C | 7687 | 7138 | 0 | 0 | 0.00% | 0.00% | 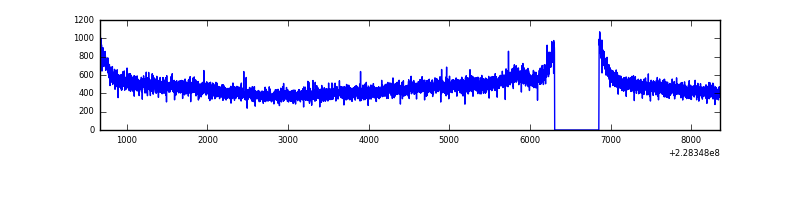 |
| D | 7687 | 7138 | 175 | 175 | 2.28% | 2.45% | 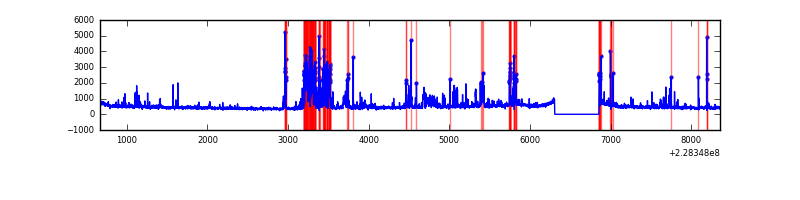 |
Top three noisy pixels from each quadrant. If the there are fewer than three noisy pixels in the level2.evt file, extra rows are filled as -1
| Pixel properties | Quadrant properties | ||||||
|---|---|---|---|---|---|---|---|
| Quadrant | DetID | PixID | Counts | Sigma | Mean | Median | Sigma |
| A | 0 | 226 | 7973 | 41.39 | 843 | 825 | 172.7 |
| A | 12 | 194 | 7485 | 38.56 | 843 | 825 | 172.7 |
| A | 13 | 251 | 4212 | 19.61 | 843 | 825 | 172.7 |
| B | 10 | 16 | 78461 | 473.89 | 852 | 831 | 163.8 |
| B | 11 | 51 | 30810 | 183.01 | 852 | 831 | 163.8 |
| B | 0 | 214 | 22822 | 134.24 | 852 | 831 | 163.8 |
| C | 1 | 16 | 97378 | 495.52 | 836 | 838 | 194.8 |
| C | 13 | 61 | 6381 | 28.45 | 836 | 838 | 194.8 |
| C | 3 | 202 | 2118 | 6.57 | 836 | 838 | 194.8 |
| D | 14 | 34 | 516767 | 2395.43 | 813 | 791 | 215.4 |
| D | 1 | 52 | 398615 | 1846.91 | 813 | 791 | 215.4 |
| D | 12 | 221 | 55097 | 252.12 | 813 | 791 | 215.4 |
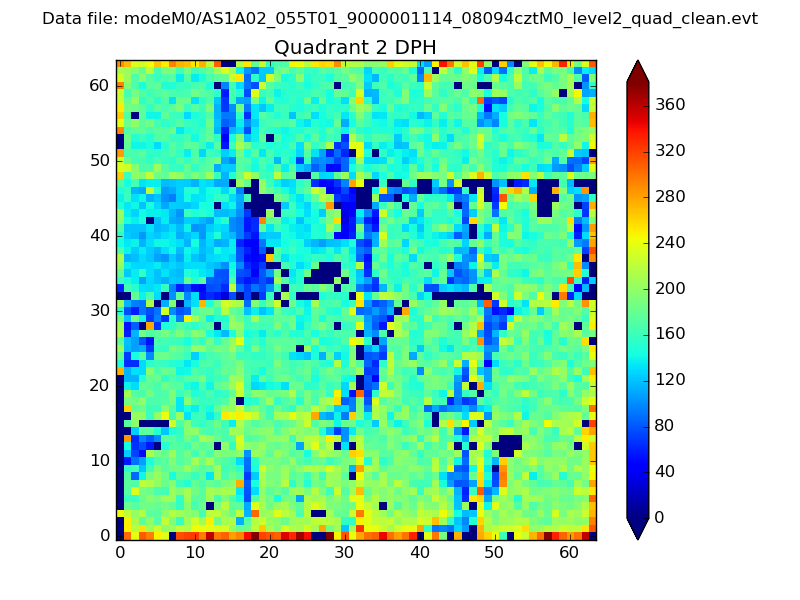
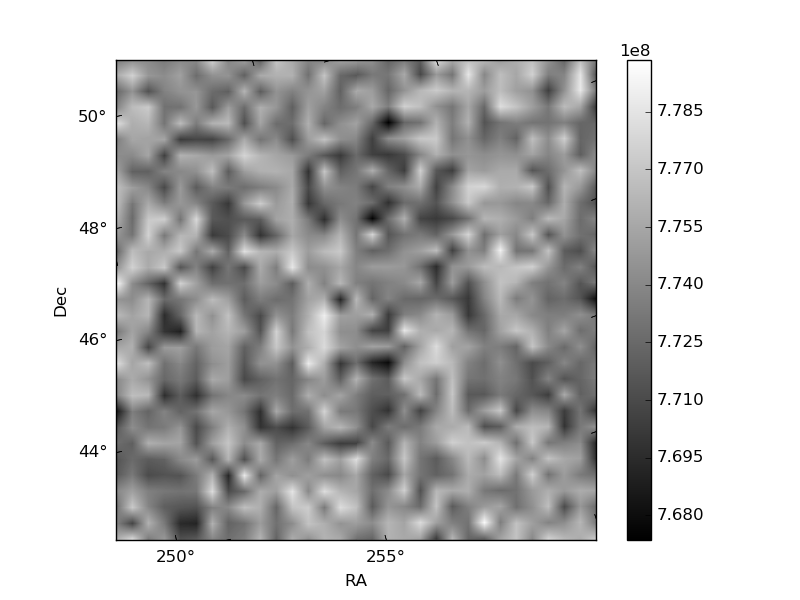
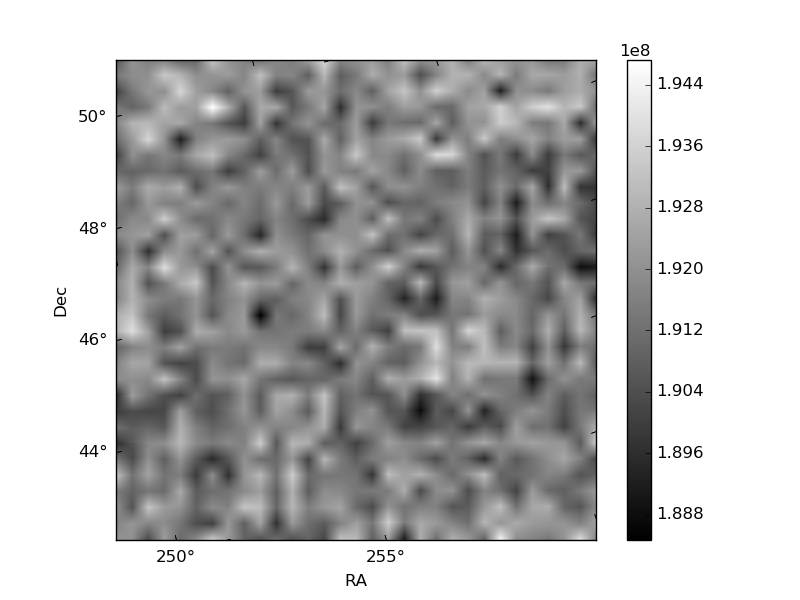
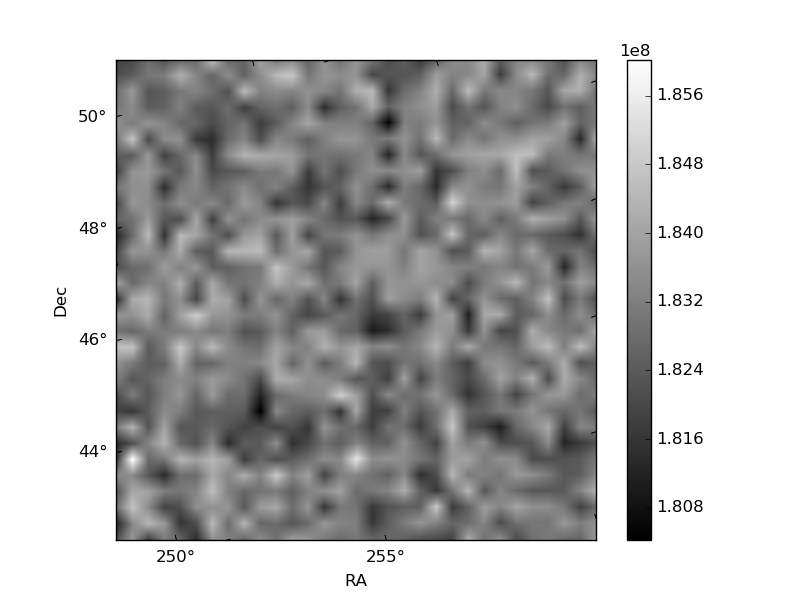
Histogram calculated using DETX and DETY for each event in the final _common_clean file
| Quadrant A | 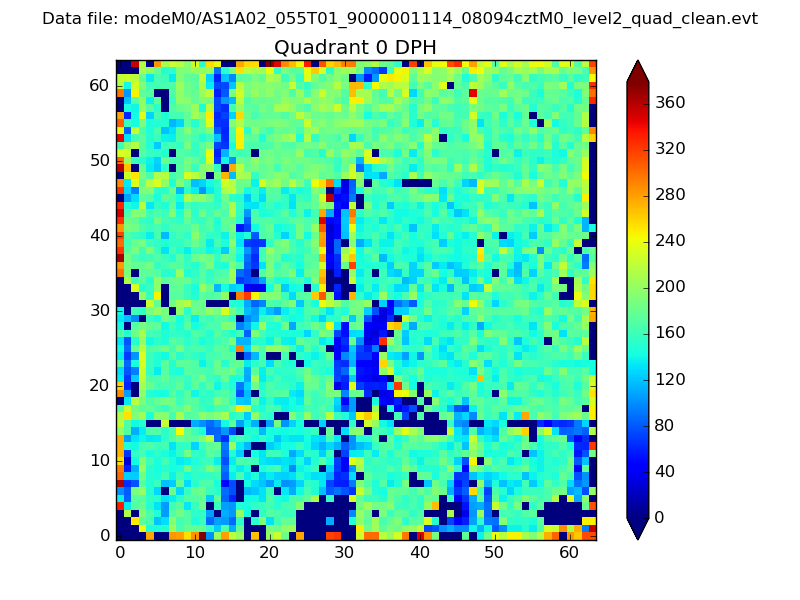 |
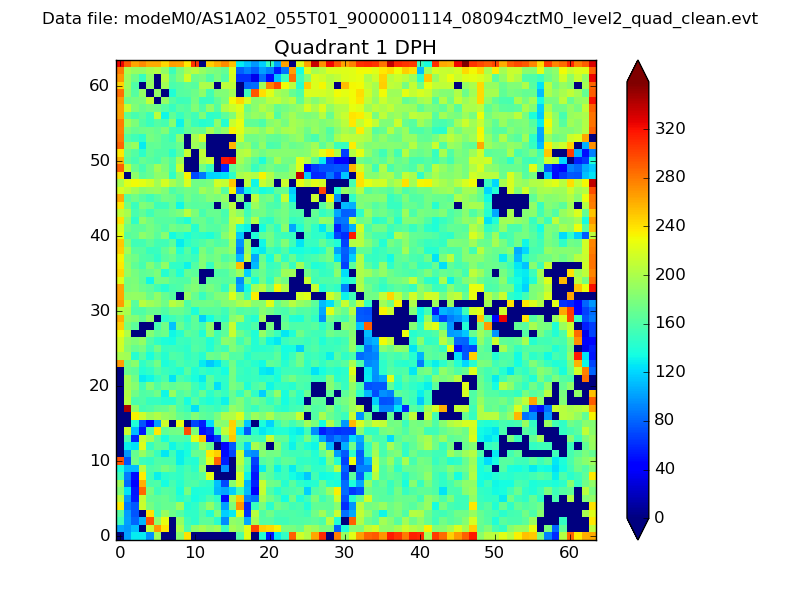 |
Quadrant B |
|---|---|---|---|
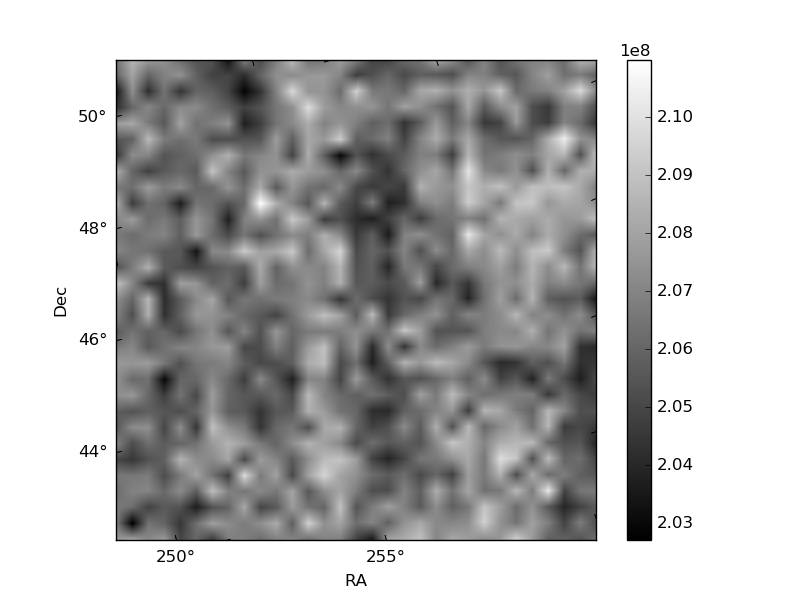
| Quadrant D | 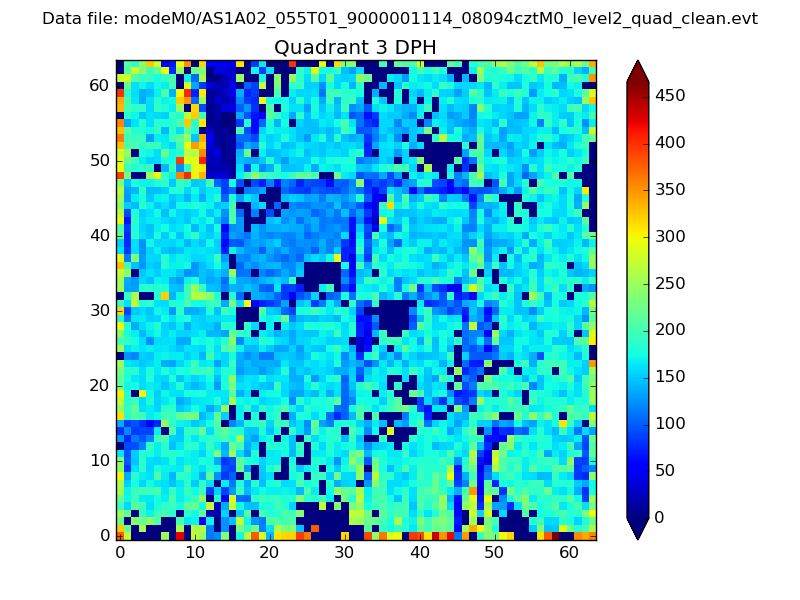 |
 |
Quadrant C |
| Plot type | Count rate plots | Images |
|---|---|---|
| Comparison with Poisson distribution Blue bars denote a histogram of data divided into 1 sec bins. Red curve is a Poisson curve with rate = median count rate of data. |
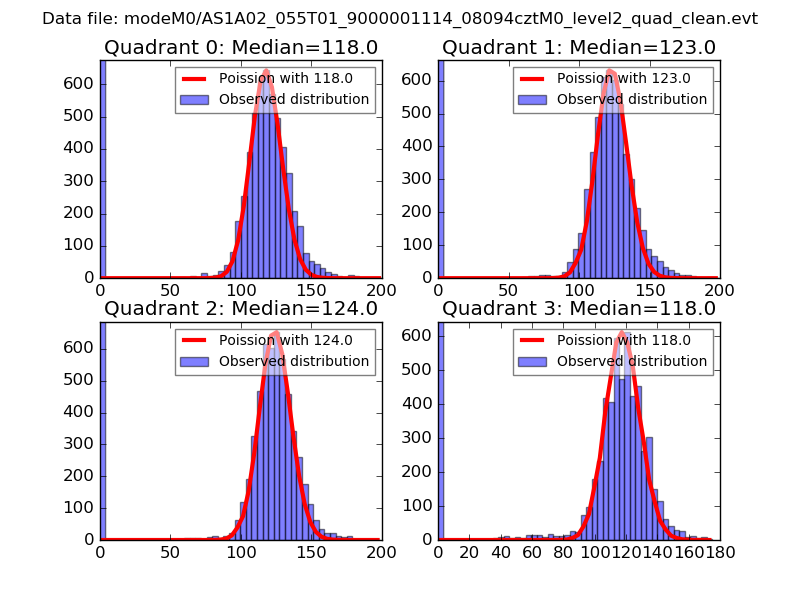 |
 |
| Quadrant-wise count rates Data is divided into 100 sec bins |
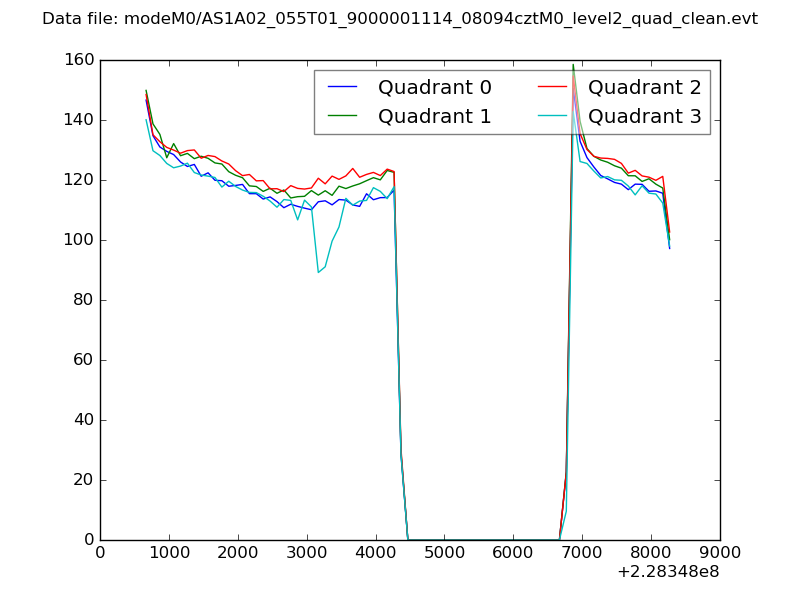 |
|
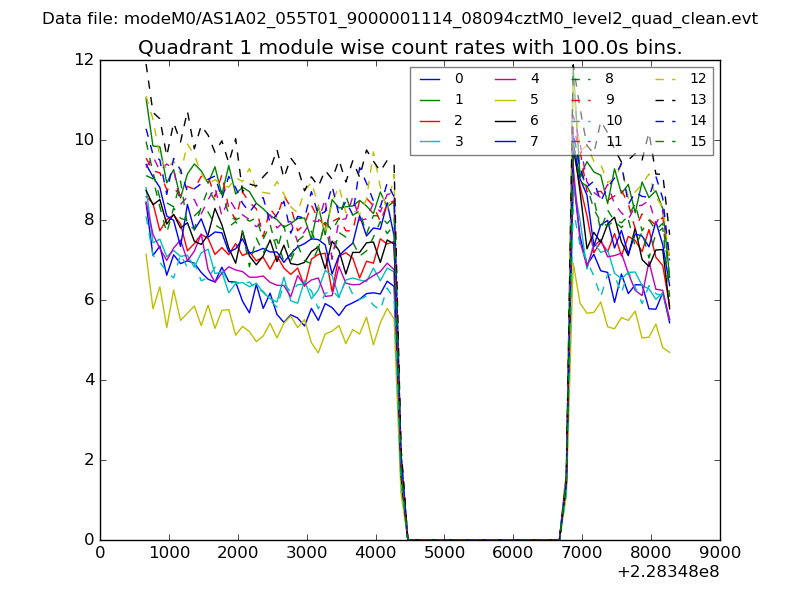
| Module-wise count rates for Quadrant A Data is divided into 100 sec bins |
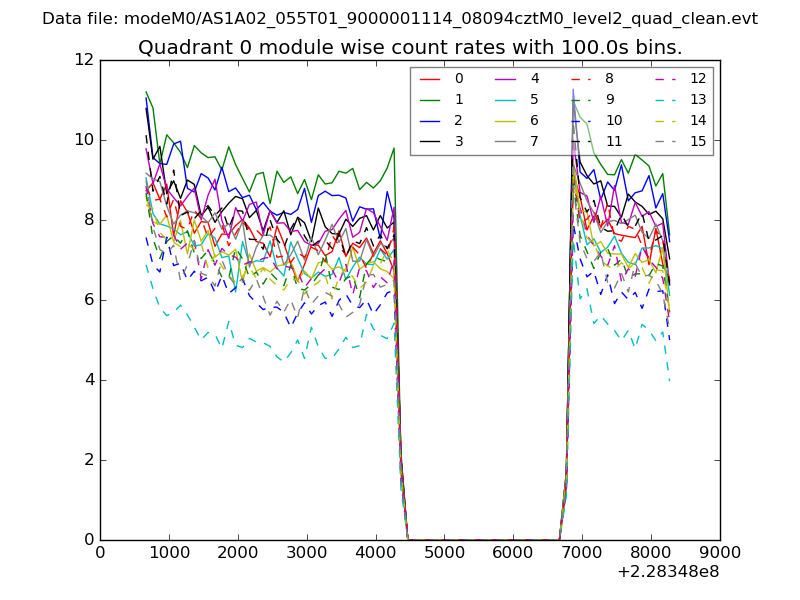 |
 |
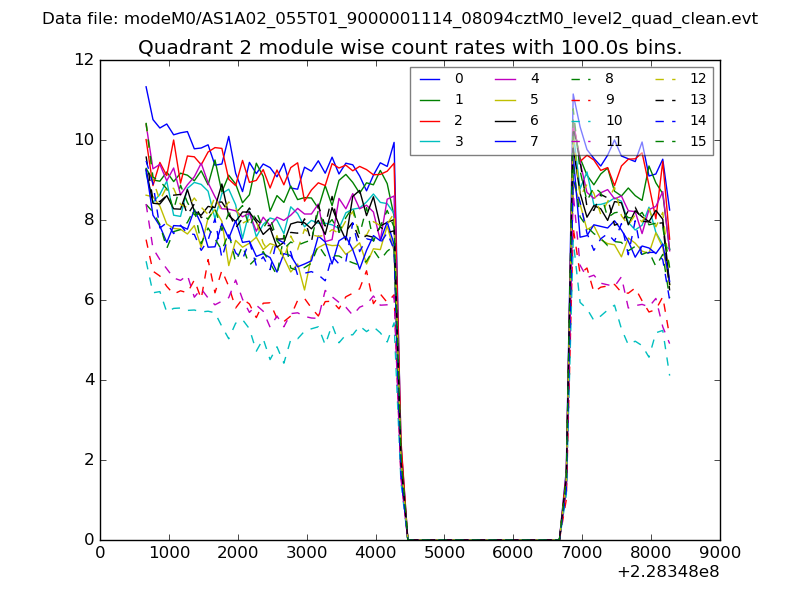
| Module-wise count rates for Quadrant B Data is divided into 100 sec bins |
 |
 |
| Module-wise count rates for Quadrant C Data is divided into 100 sec bins |
 |
 |
| Module-wise count rates for Quadrant D Data is divided into 100 sec bins |
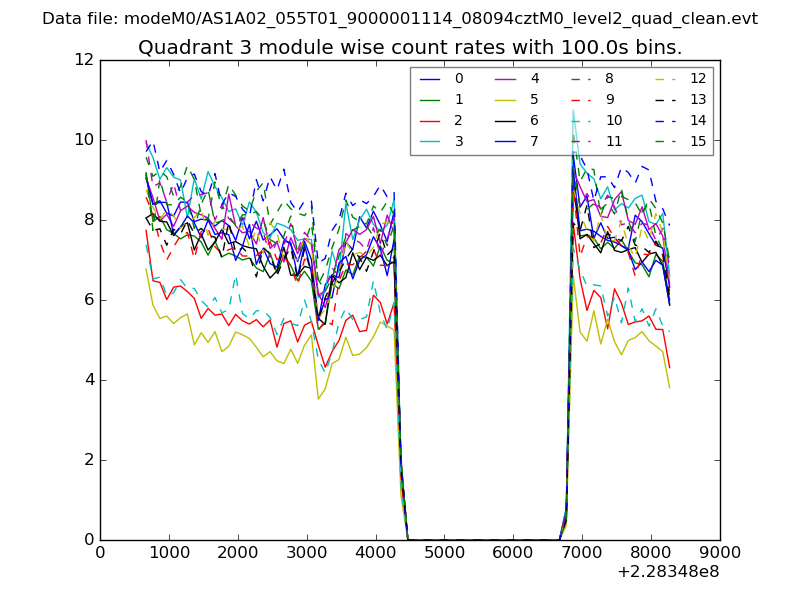 |
 |
| Parameter | Plot |
|---|---|
| CZT HV Monitor | 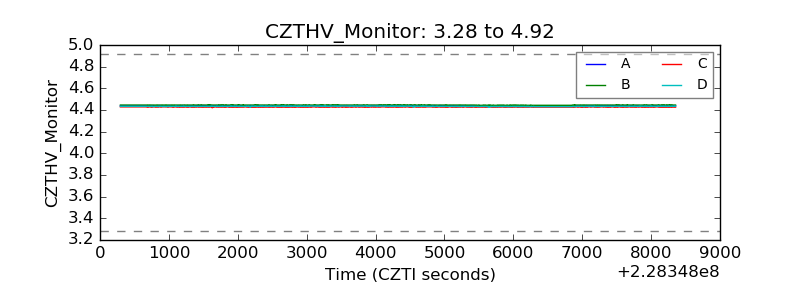 |
| D_VDD | 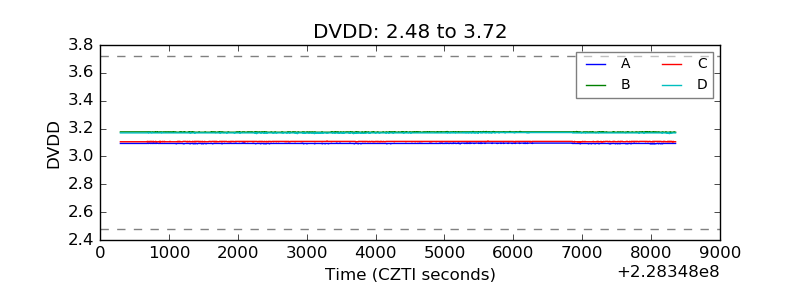 |
| Temperature 1 | 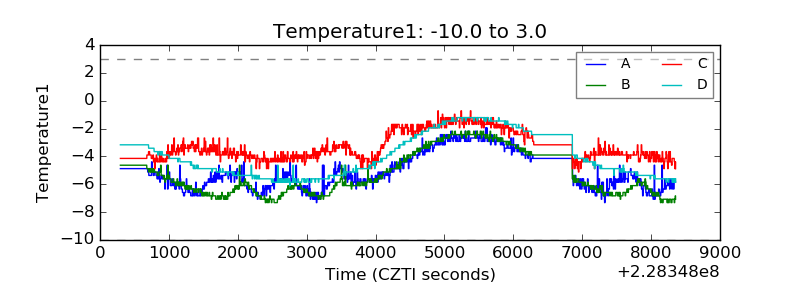 |
| Veto HV Monitor | 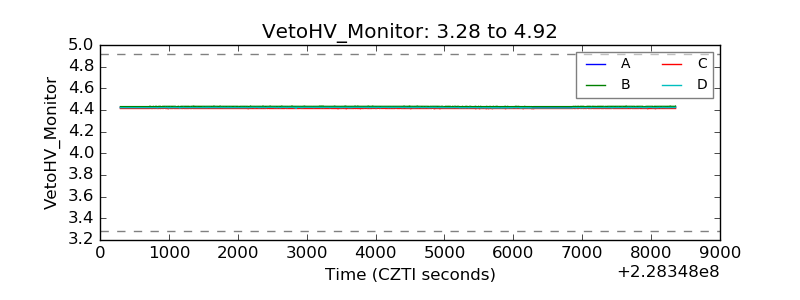 |
| Veto LLD | 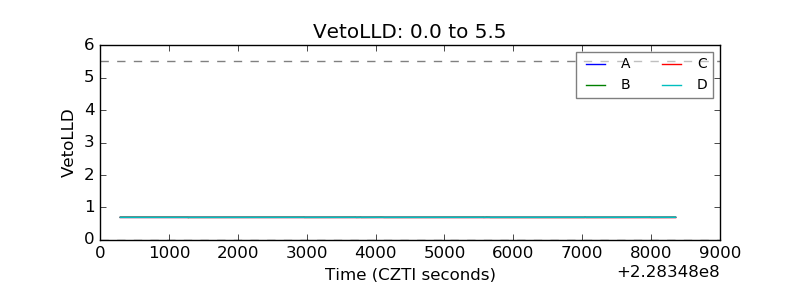 |
| Alpha Counter | 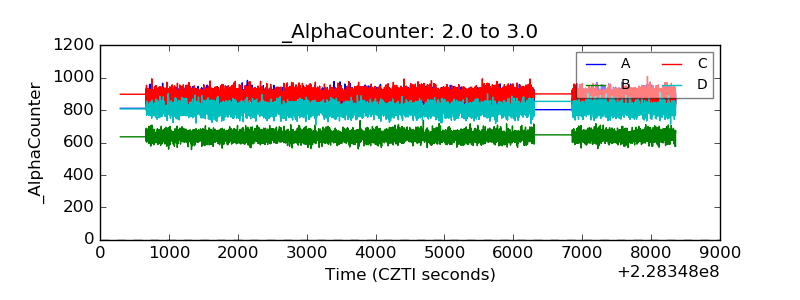 |
| _CPM_Rate | 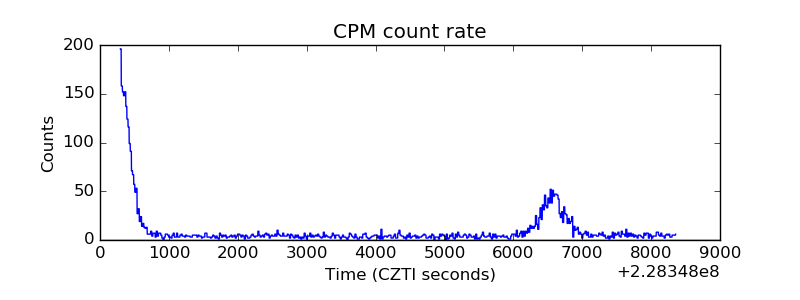 |
| CZT Counter | 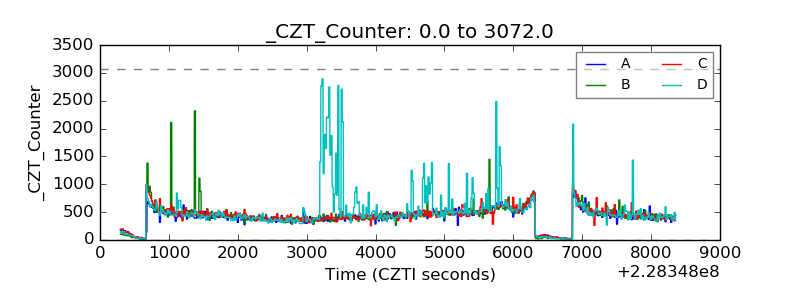 |
| +2.5 Volts monitor |  |
| +5 Volts monitor | 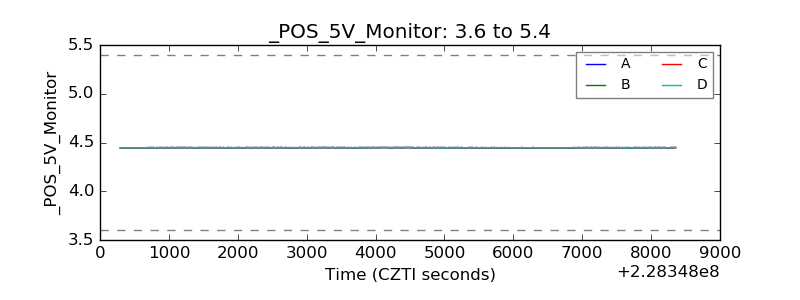 |
| _ROLL_ROT | 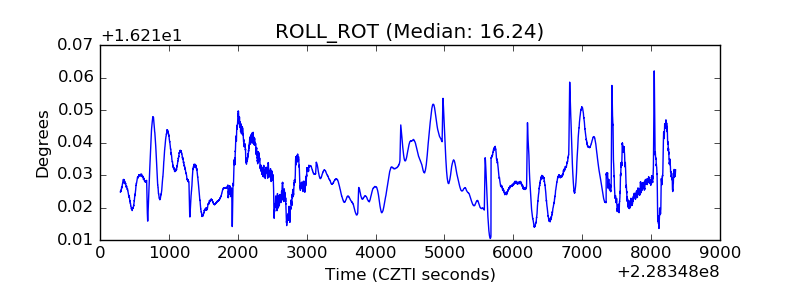 |
| _Roll_DEC | 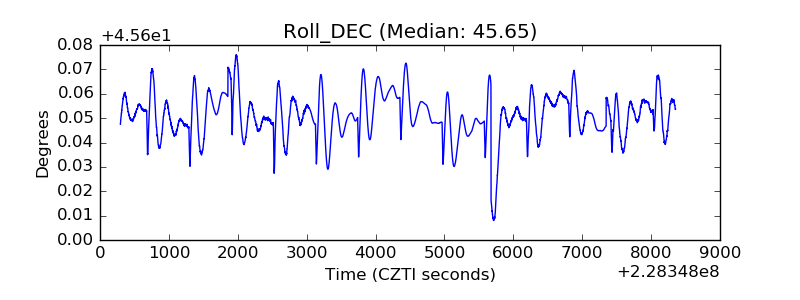 |
| _Roll_RA | 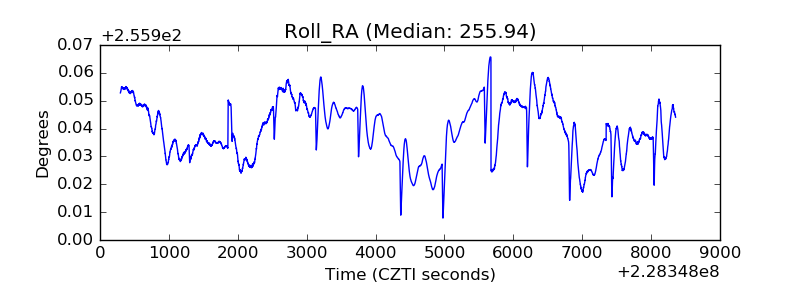 |
| Veto Counter | 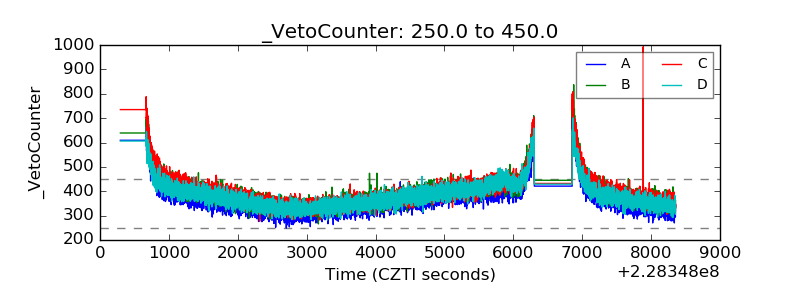 |