| Param | Original file | Final file |
|---|---|---|
| Filename | modeM0/AS1A02_055T01_9000001114_08096cztM0_level2.evt | modeM0/AS1A02_055T01_9000001114_08096cztM0_level2_quad_clean.evt |
| Size (bytes) | 570,510,720 | 127,958,400 |
| Size | 544.1 MB | 122.0 MB |
| Events in quadrant A | 4,079,014 | 805,075 |
| Events in quadrant B | 4,272,767 | 830,472 |
| Events in quadrant C | 4,123,733 | 836,284 |
| Events in quadrant D | 4,214,157 | 801,966 |
| Mode M0 | |||
|---|---|---|---|
| Quadrant | BADHDUFLAG | Total packets | Discarded packets |
| A | 0 | 18310 | 2 |
| B | 0 | 18763 | 1 |
| C | 0 | 18350 | 1 |
| D | 0 | 18993 | 1 |
| Mode SS | |||
|---|---|---|---|
| Quadrant | BADHDUFLAG | Total packets | Discarded packets |
| A | 0 | 174 | 0 |
| B | 0 | 174 | 0 |
| C | 0 | 174 | 0 |
| D | 0 | 174 | 0 |
| Quadrant | Total seconds | Saturated seconds | Saturation percentage |
|---|---|---|---|
| A | 8663 | 130 | 1.500635% |
| B | 8663 | 207 | 2.389472% |
| C | 8663 | 75 | 0.865751% |
| D | 8663 | 72 | 0.831121% |
Noise dominated data is calculated using 1-second bins in cleaned event files. If a bin has >2000 counts, and if more than 50% of those come from <1% of pixels, then it is considered to be noise-dominated and hence unusable.
| Quadrant | # 1 sec bins | Bins with >0 counts | Bins with >2000 counts | High rate bins dominated by noise | Noise dominated (total time) | Noise dominated (detector-on time) | Marked lightcurve |
|---|---|---|---|---|---|---|---|
| A | 8698 | 8664 | 0 | 0 | 0.00% | 0.00% | 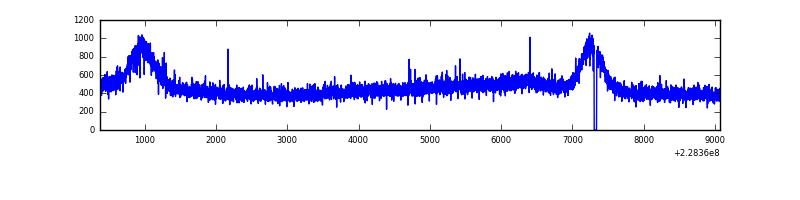 |
| B | 8698 | 8664 | 5 | 5 | 0.06% | 0.06% | 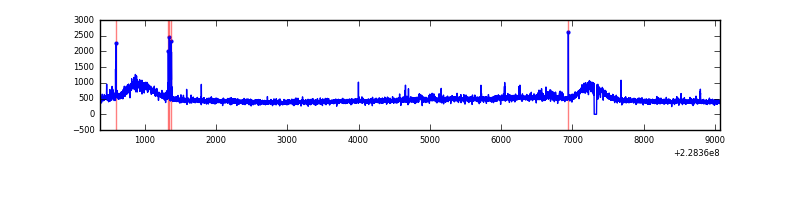 |
| C | 8698 | 8664 | 1 | 1 | 0.01% | 0.01% | 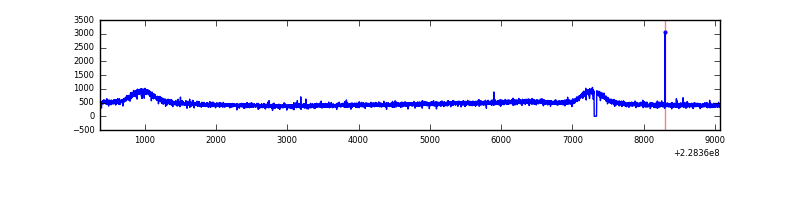 |
| D | 8698 | 8664 | 20 | 20 | 0.23% | 0.23% | 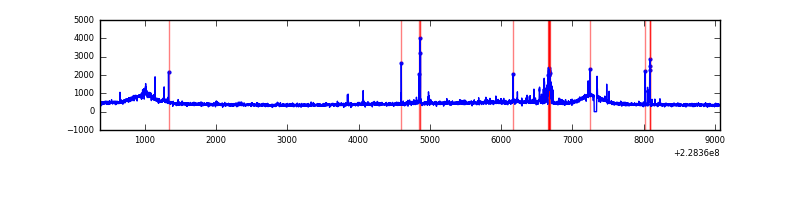 |
Top three noisy pixels from each quadrant. If the there are fewer than three noisy pixels in the level2.evt file, extra rows are filled as -1
| Pixel properties | Quadrant properties | ||||||
|---|---|---|---|---|---|---|---|
| Quadrant | DetID | PixID | Counts | Sigma | Mean | Median | Sigma |
| A | 0 | 226 | 9952 | 40.75 | 1060 | 1033 | 218.9 |
| A | 12 | 194 | 9342 | 37.97 | 1060 | 1033 | 218.9 |
| A | 3 | 137 | 4158 | 14.28 | 1060 | 1033 | 218.9 |
| B | 11 | 51 | 42808 | 198.3 | 1073 | 1043 | 210.6 |
| B | 0 | 214 | 38099 | 175.94 | 1073 | 1043 | 210.6 |
| B | 10 | 16 | 25695 | 117.05 | 1073 | 1043 | 210.6 |
| C | 1 | 16 | 28829 | 113.4 | 1045 | 1047 | 245.0 |
| C | 0 | 224 | 9591 | 34.87 | 1045 | 1047 | 245.0 |
| C | 13 | 61 | 8018 | 28.45 | 1045 | 1047 | 245.0 |
| D | 13 | 122 | 118220 | 427.69 | 1026 | 996 | 274.1 |
| D | 1 | 52 | 90608 | 326.95 | 1026 | 996 | 274.1 |
| D | 13 | 105 | 31577 | 111.57 | 1026 | 996 | 274.1 |
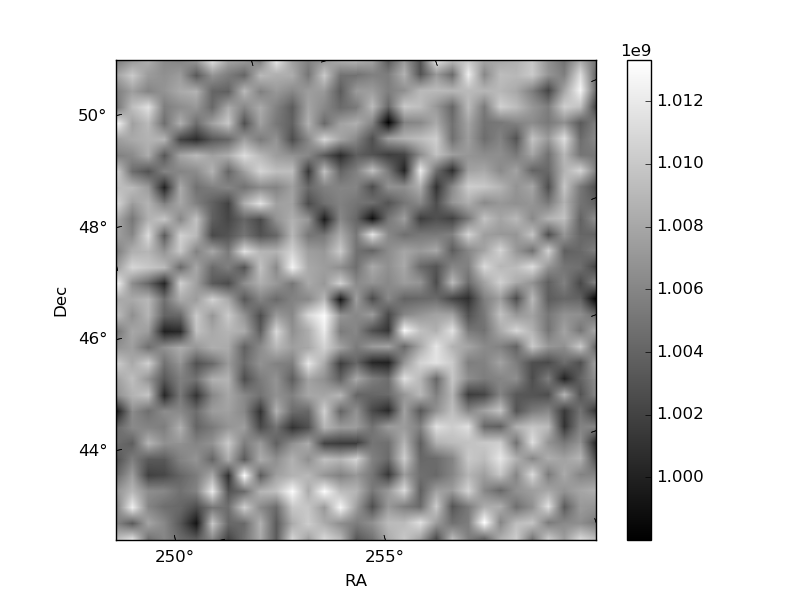
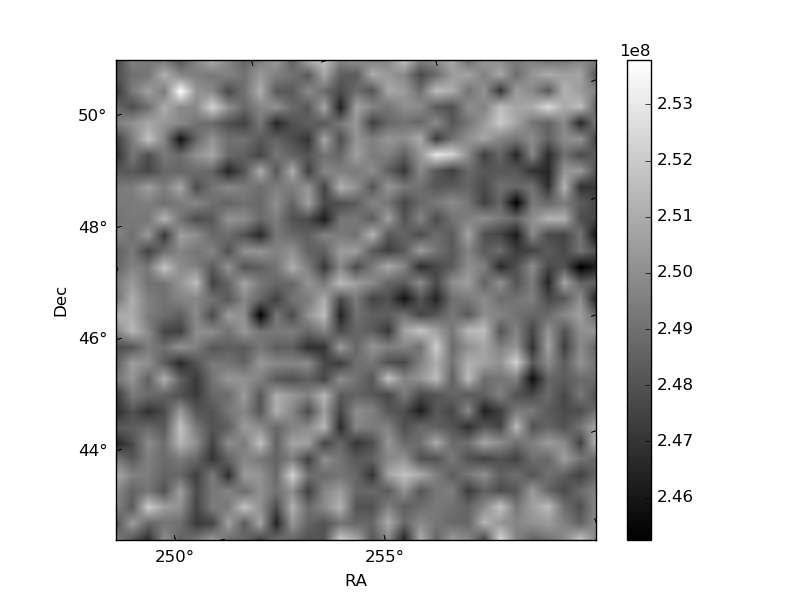
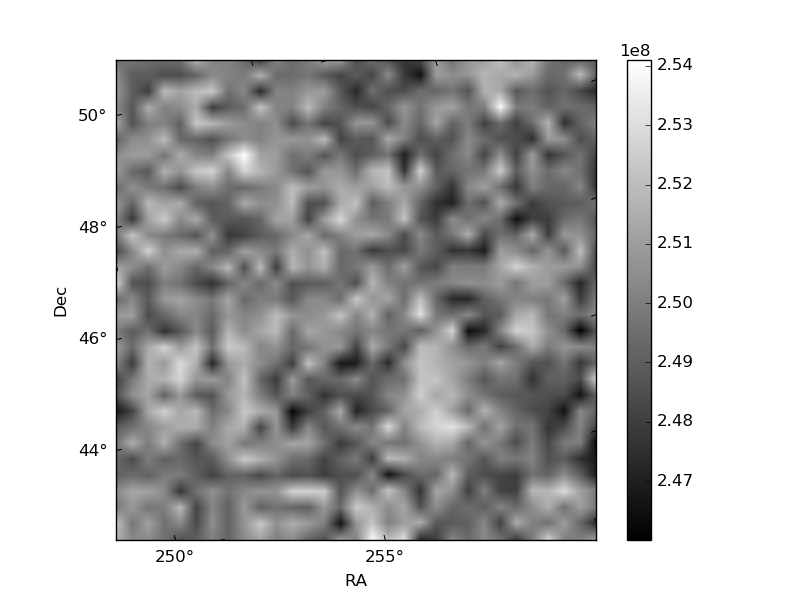
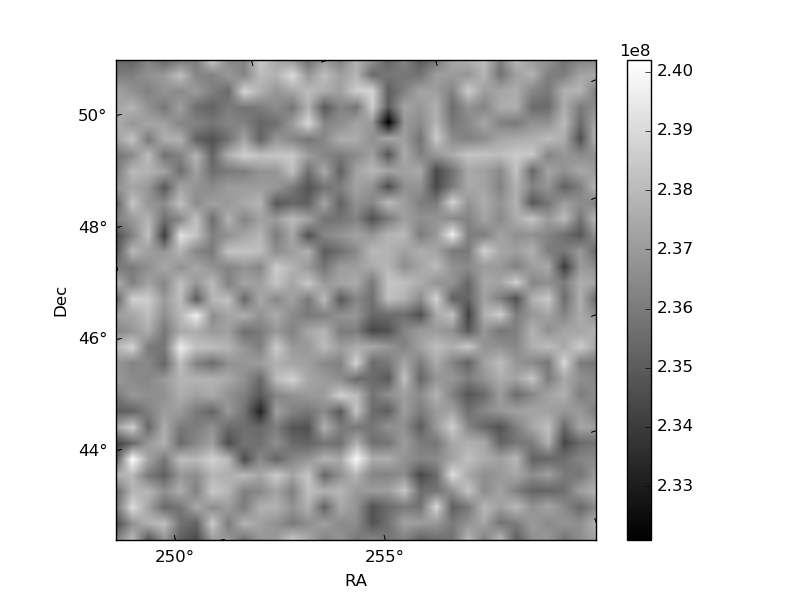
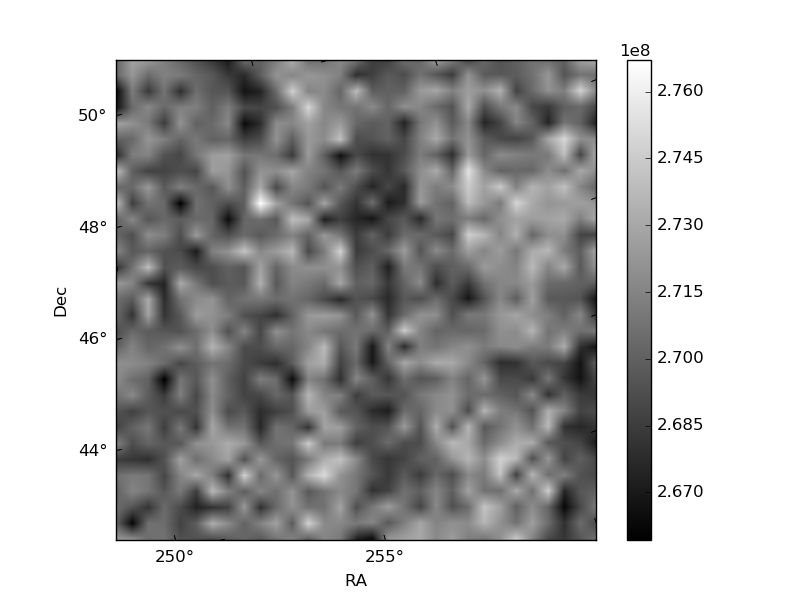
Histogram calculated using DETX and DETY for each event in the final _common_clean file
| Quadrant A | 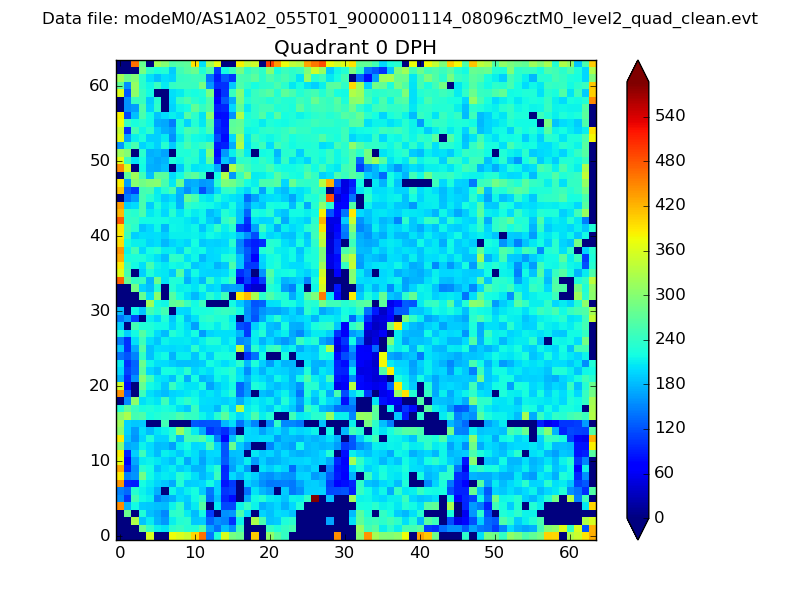 |
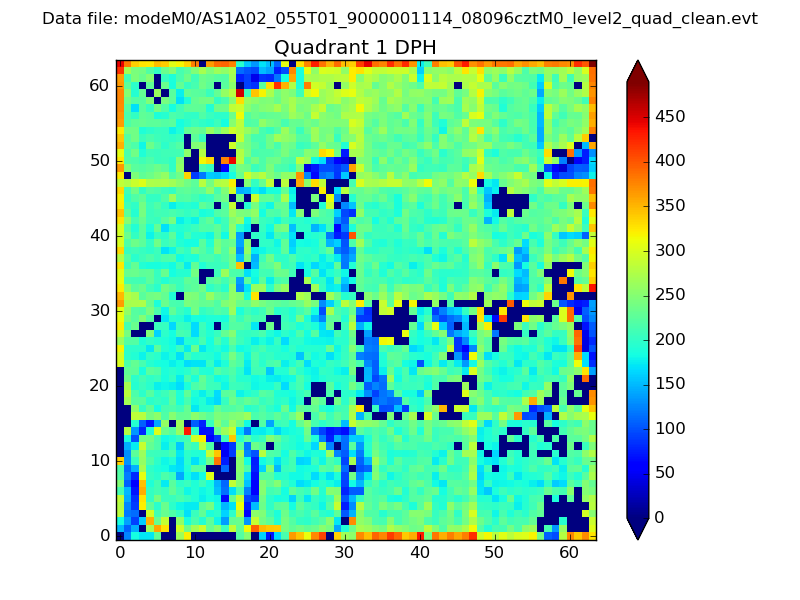 |
Quadrant B |
|---|---|---|---|
| Quadrant D | 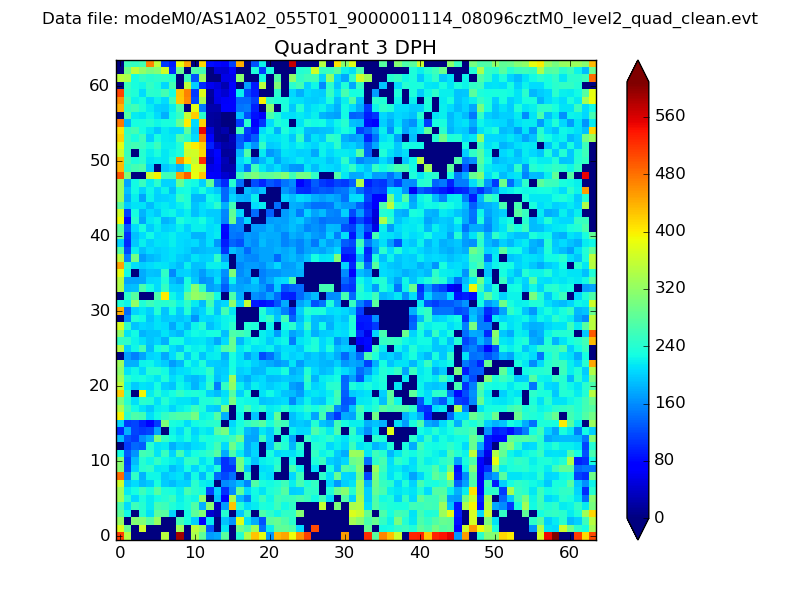 |
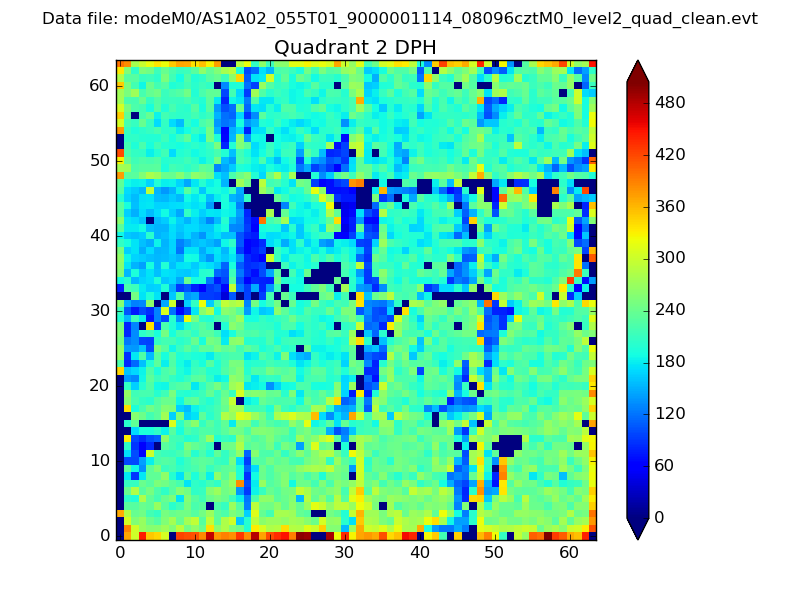 |
Quadrant C |
| Plot type | Count rate plots | Images |
|---|---|---|
| Comparison with Poisson distribution Blue bars denote a histogram of data divided into 1 sec bins. Red curve is a Poisson curve with rate = median count rate of data. |
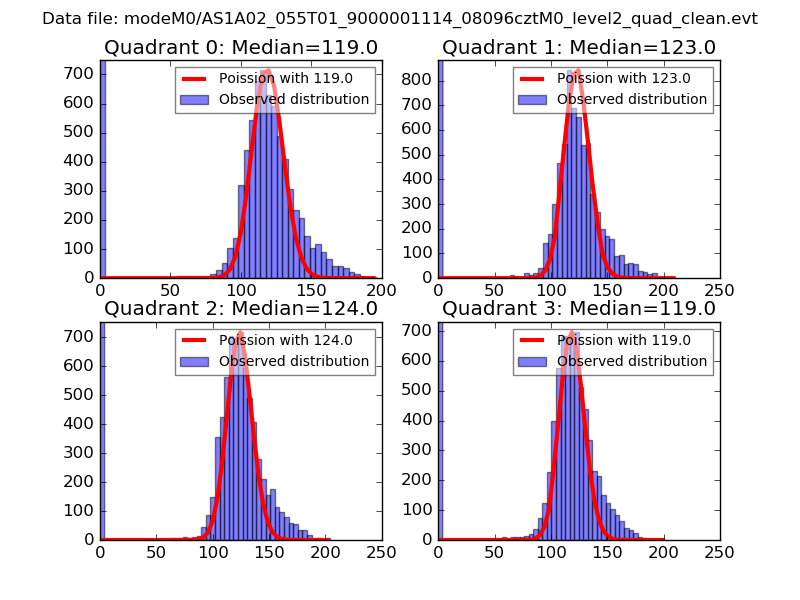 |
 |
| Quadrant-wise count rates Data is divided into 100 sec bins |
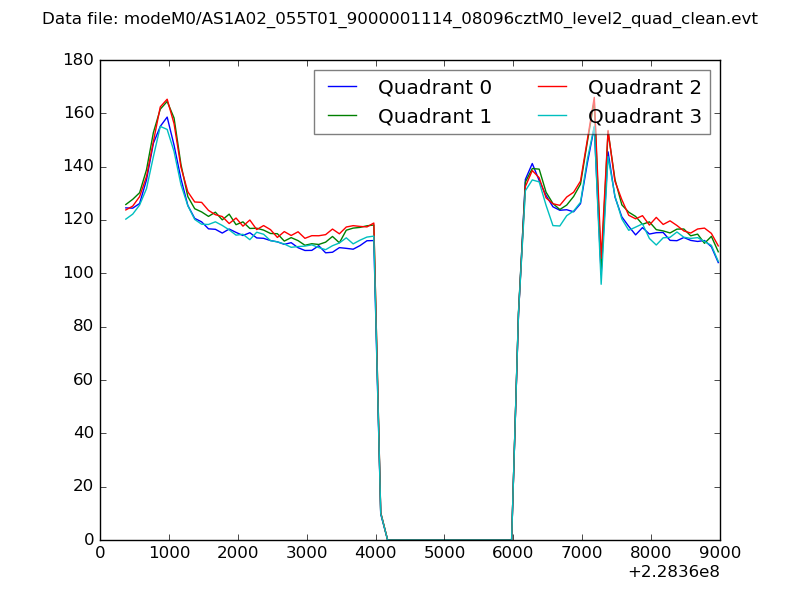 |
|
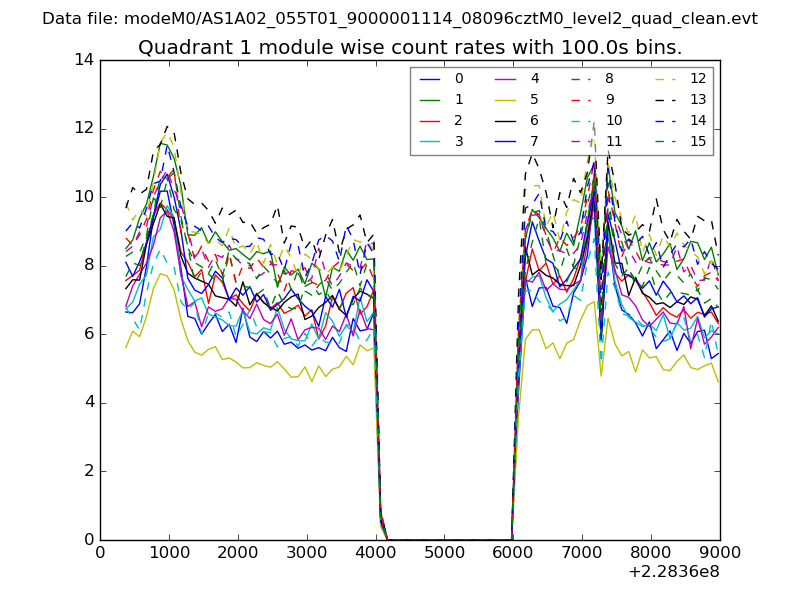
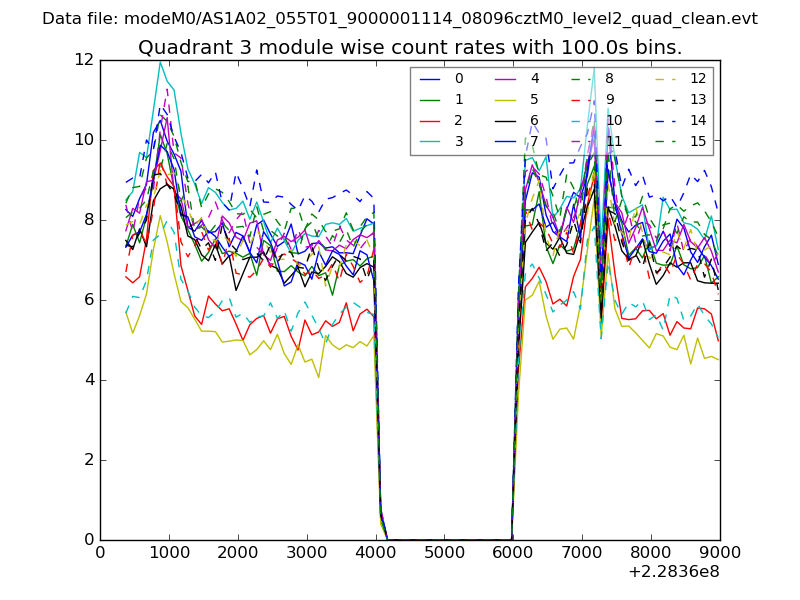
| Module-wise count rates for Quadrant A Data is divided into 100 sec bins |
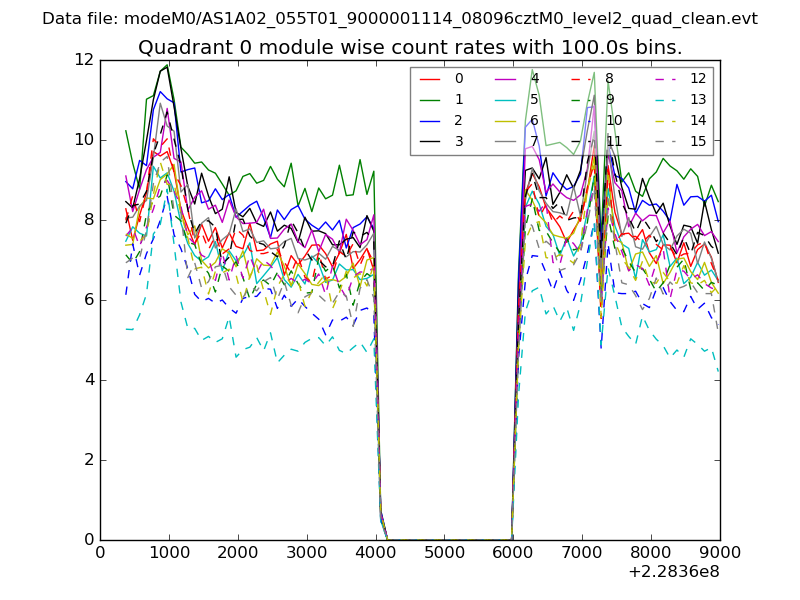 |
 |
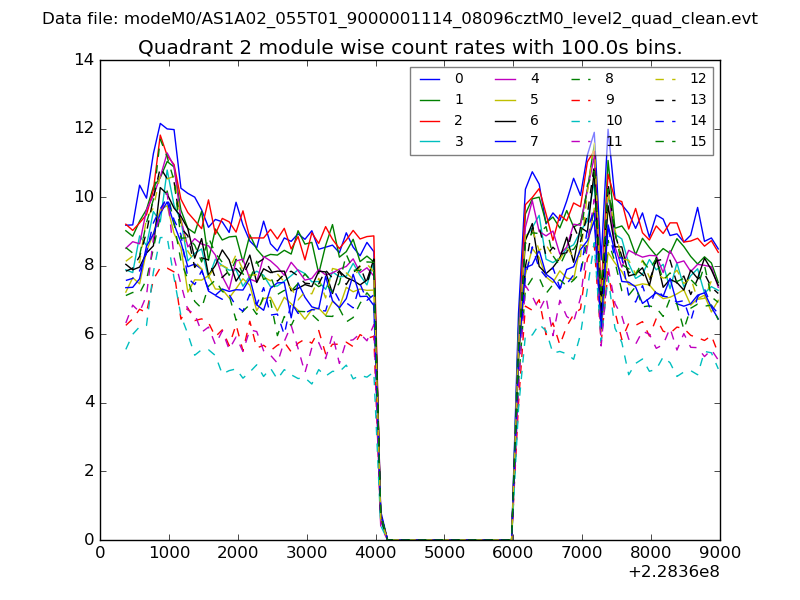
| Module-wise count rates for Quadrant B Data is divided into 100 sec bins |
 |
 |
| Module-wise count rates for Quadrant C Data is divided into 100 sec bins |
 |
 |
| Module-wise count rates for Quadrant D Data is divided into 100 sec bins |
 |
 |
| Parameter | Plot |
|---|---|
| CZT HV Monitor | 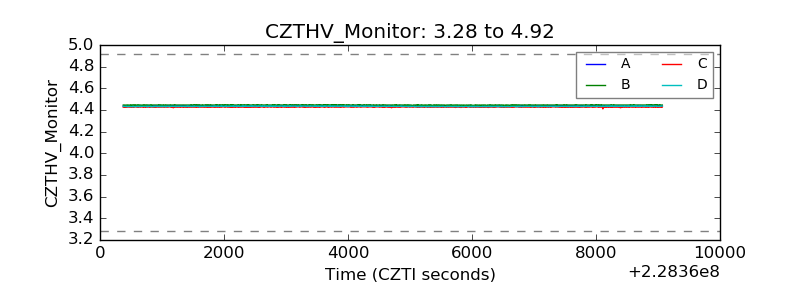 |
| D_VDD | 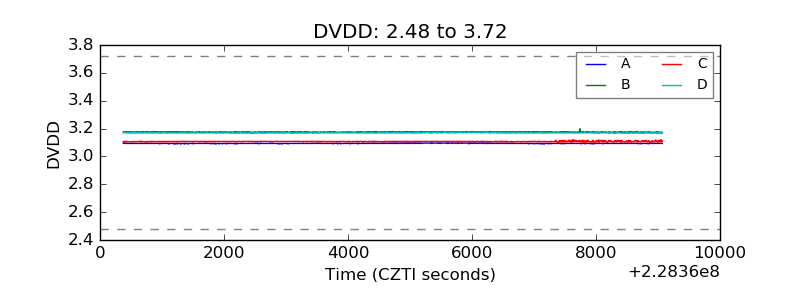 |
| Temperature 1 | 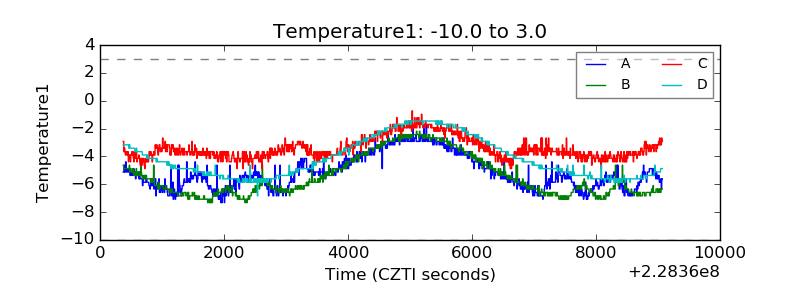 |
| Veto HV Monitor | 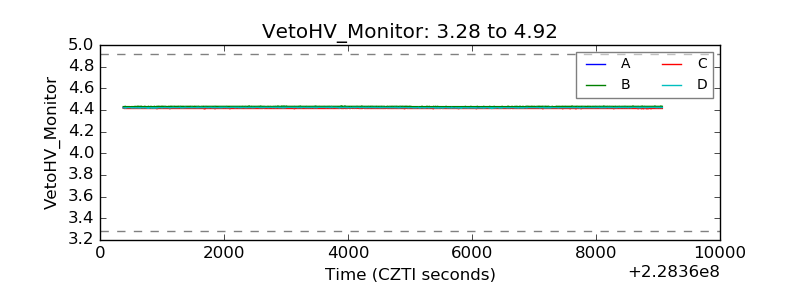 |
| Veto LLD | 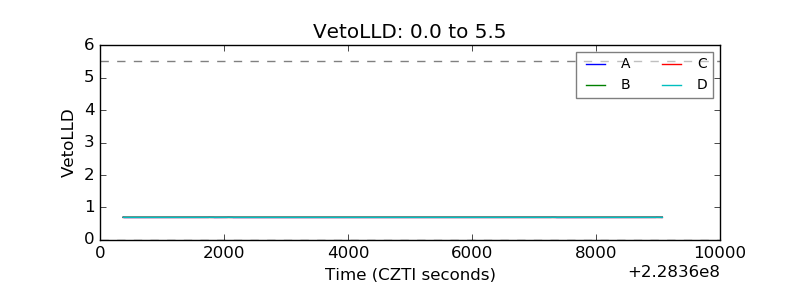 |
| Alpha Counter | 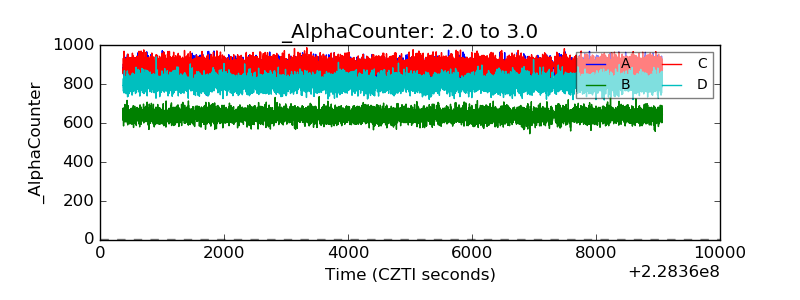 |
| _CPM_Rate | 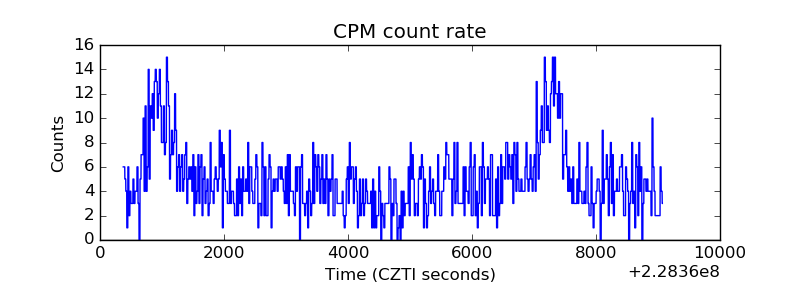 |
| CZT Counter | 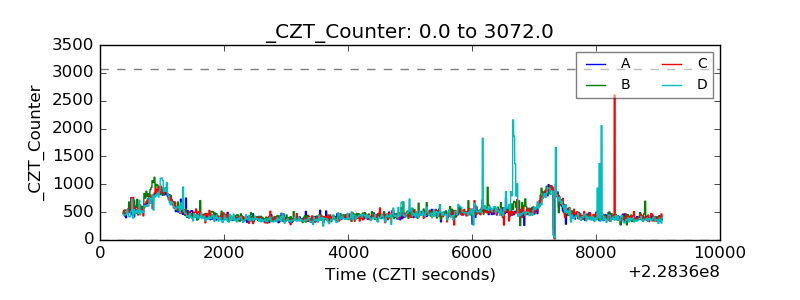 |
| +2.5 Volts monitor |  |
| +5 Volts monitor |  |
| _ROLL_ROT | 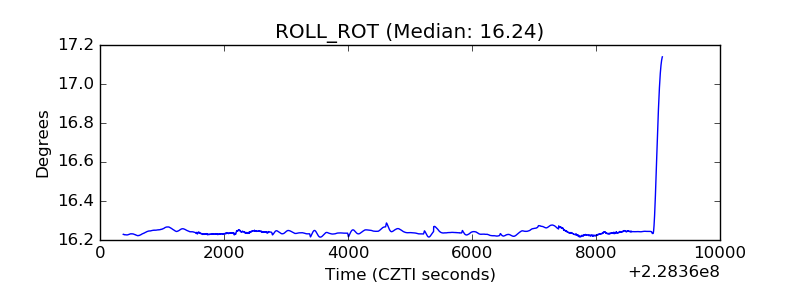 |
| _Roll_DEC | 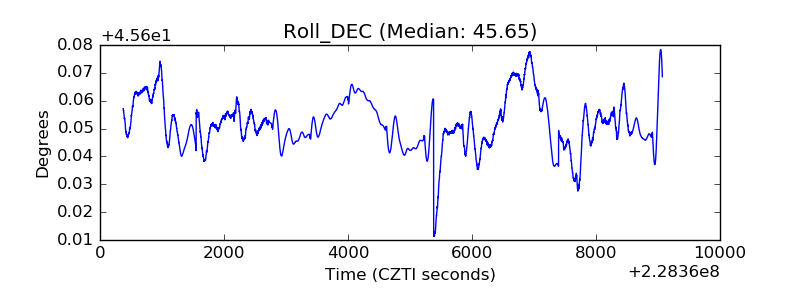 |
| _Roll_RA | 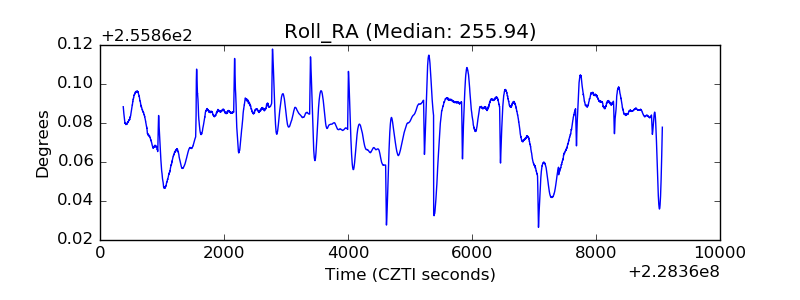 |
| Veto Counter | 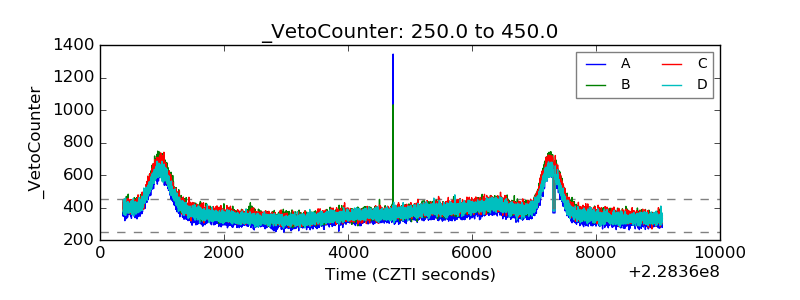 |